| This Week’s a.i. Stock Spotlight is United Aitlines ($UAL) |

Tanger Outlets ($SKT) is a publicly traded real estate investment trust (REIT) that specializes in owning and operating outlet shopping centers. Founded in 1981 by Stanley K. Tanger, the company pioneered the outlet mall concept in the United States. Tanger became profitable within a few years of its establishment and went public in 1993. Headquartered in Greensboro, North Carolina, Tanger Outlets operates approximately 38 outlet centers in the United States and Canada.
Tanger generates revenue primarily through leasing retail space to a variety of high-end and popular retail brands. These leases contribute to the company’s main profit centers across its outlet centers. With around 400+ employees, Tanger has demonstrated resilience in adapting to the evolving retail landscape.
The company faces stiff competition from other large outlet mall operators such as Simon Property Group and Macerich, which also manage significant outlet shopping venue portfolios. The biggest opportunity for Tanger lies in the growing trend of discount shopping, especially in economic downturns when consumers become more price sensitive. Conversely, the major risk involves the increasing shift towards online shopping, posing a threat to physical store traffic.
The outlook for Tanger involves navigating both significant opportunities and looming challenges. The increasing consumer interest in value shopping presents a clear opportunity for expansion and capturing additional market share, particularly in underserved regions. Conversely, the shift towards online shopping and potential economic downturns poses significant risks, as these factors may dampen consumer spending on discretionary items and affect physical foot traffic to outlets.
Founded as one of the earliest adopters of the outlet mall concept, Tanger has grown into a publicly traded Real Estate Investment Trust (REIT) , ensuring a steady stream of dividends to its shareholders thanks to a mandate to distribute at least 90% of its taxable income. The company’s commitment to sustainability is evident in its energy-efficient lighting and water conservation measures across its properties.
Tanger’s innovative approach extends to its marketing strategies and customer engagement. It was among the pioneers in leveraging digital marketing in the retail outlet sector, enhancing customer experience with TangerClub—a loyalty program offering exclusive benefits. The company’s active community engagement, such as the “TangerPink” campaign for breast cancer research, underscores its commitment to societal impact.
Economically, Tanger plays a vital role in local communities, boosting employment and tourism, particularly in smaller metropolitan areas. It has shown remarkable resilience during economic downturns, with outlet shopping becoming a preferred choice for consumers looking to stretch their dollars further. Additionally, Tanger’s geographic diversity, with properties across over 20 states and in Canada, helps mitigate regional economic risks.
In the glossy world of outlet malls, Tanger Outlets ($SKT) is more than just retail space; it’s a microcosm of economic resilience. Recent earnings calls painted a picture of a company that’s defying the retail gloom, with boosted full-year guidance that whispers confidence into the market. The Q2 2024 call was all about rising profits, underscored by smart financial maneuvers—think expanded credit lines and smarter debt strategies. This is a company that isn’t just surviving; it’s strategically thriving in the chaos of retail, banking on robust leasing and a tight grip on expenses.
However, when analysts zoom out and look at the longer term by studying the revenue and earnings which $SKT have generated over the last 5 years you see a story which is not as dynamic. As the table below illustrates, revenue has declined 2.8% over the last 5 years but earnings which have been very volatile have increased 13.1% . Wall Street is applauding $SKT’s financial management during a very difficult 5-year stretch.
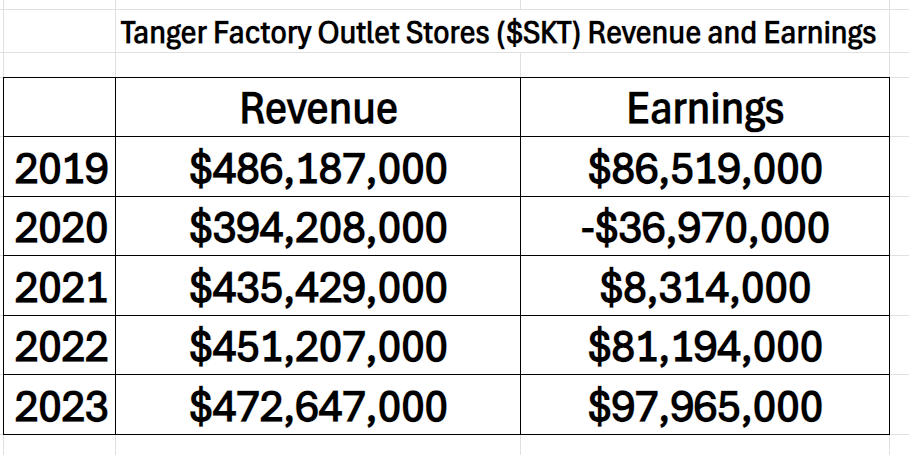
Over the last decade, Tanger has not only expanded organically but has also made strategic acquisitions that have broadened its market reach and solidified its presence in the outlet shopping center market. Analyst sentiment towards Tanger has generally been mixed, with the company seen as a steady player in its niche, albeit facing challenges from broader retail sector shifts. Tanger Outlets ($SKT) is interesting in its strategic response to the retail challenges posed by the COVID-19 pandemic. While many retail businesses faced downturns, Tanger managed to maintain a strong occupancy rate relative to the industry by quickly adapting its properties to accommodate new retail formats and consumer behaviors, such as the integration of curbside pickup services. This adaptation helped stabilize their revenue stream during a period when many traditional retailers were struggling.
$SKT also offers a dividend of $.27 cents or share which is currently a 3.21% yield.
In this weekly stock study, we will look at an analysis of the following indicators and metrics which are our guidelines which dictate our behavior in deciding whether to buy, sell or stand aside on a particular stock.
- Wall Street Analysts Ratings and Forecasts
- 52 Week High and Low Boundaries
- Best-Case/Worst-Case Analysis
- Vantagepoint A.I. Predictive Blue Line
- Neural Network Forecast (Machine Learning)
- VantagePoint A.I. Daily Range Forecast
- Intermarket Analysis
- VantagePoint A.I. Seasonal Analysis
- Our Suggestion
While we make all our decisions based upon the artificial intelligence forecasts, we do look at the fundamentals briefly, just to understand the financial landscape that $SKT is operating in.
Wall Street Analysts Ratings and Forecasts
The 7 analysts with 12-month price forecasts for Tanger stock have an average target of $32.25, with a low estimate of $30.00 and a high estimate of $34. The average target represents a decrease of -7.69% from the current stock price of 34.05.

We always advise traders to pay attention to the variance between the most bullish and bearish forecast as this represents the level of volatility that professional analysts are expecting over the coming year. This current level is only 12%, which is very low.
52 Week High and Low Boundaries

Over the last 52 weeks $SKT has traded as high as $34.81 and as low as $21.42.
We advise Power Traders to focus on the difference between these two values as it represents the historical volatility that the stock has exhibited over the past year. Currently this level is 39%, which becomes significant particularly when we compare it to any of the broader stock market indexes.
Picture this: the undulating 52-week highs and lows of a stock aren’t just markers; they’re the essence of the market’s drama over a year. These figures capture the peaks of optimism and the troughs of doubt. Look at $SKT, for instance. As it brushes against these historic summits, it’s not just climbing, it’s signaling a surge in ongoing investor trust, a bullish beacon. And for $SKT, a quick look at its year-long chart is like watching a suspenseful ascent, with every new high painting a vivid picture of enduring allure in the investor’s eye. Stocks that consistently notch new highs are riding a wave of approval, often spiraling even higher, and smart money watches these cues for the next lucrative wave.
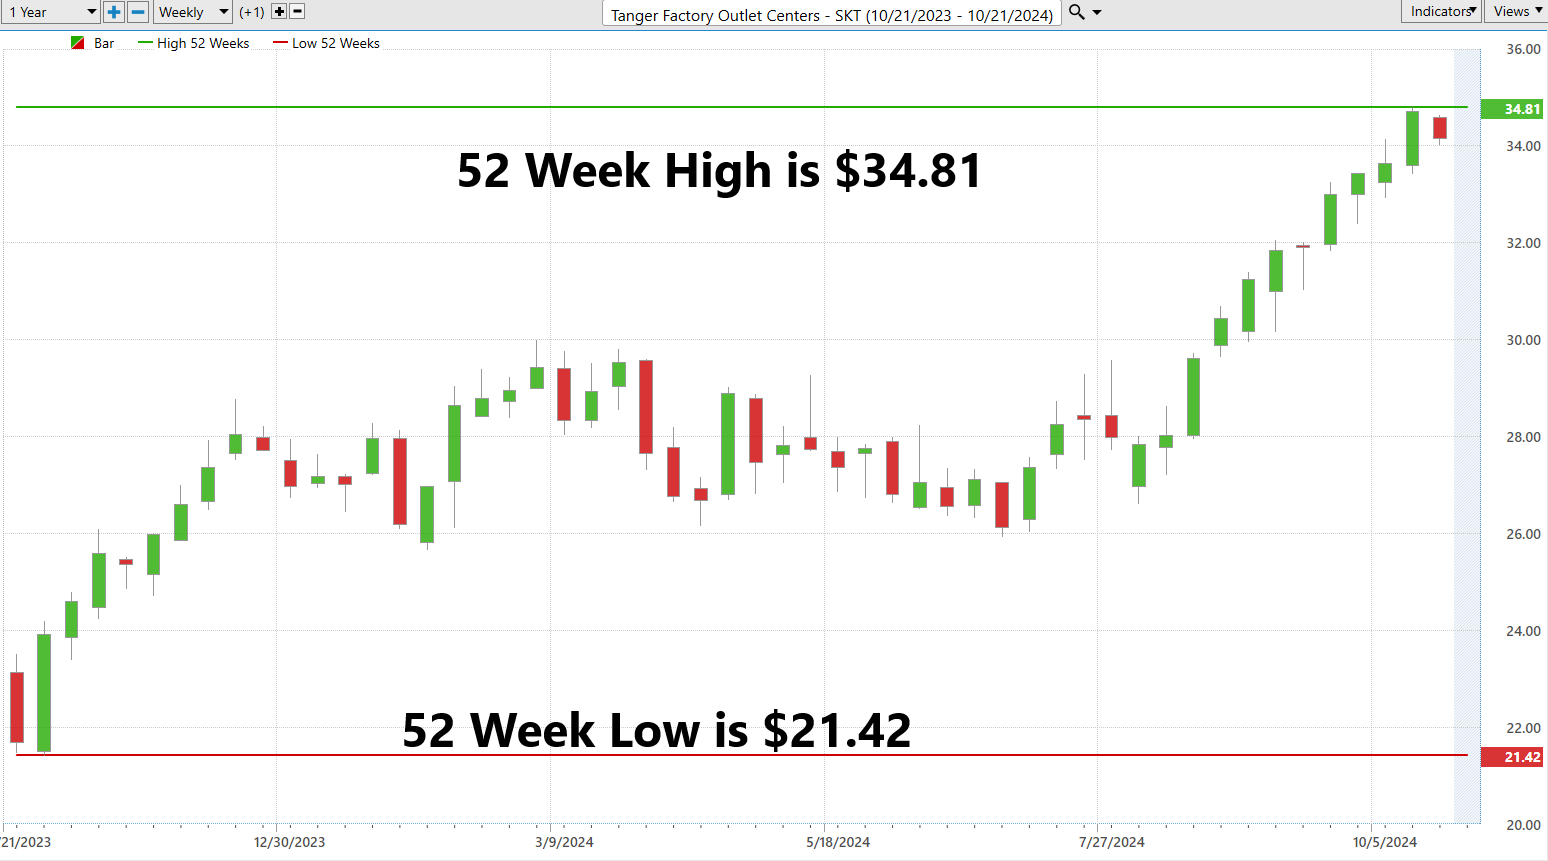
If you study the 52-week chart closely you will see that $SKT has made new 52-week highs in 10 of the 11 most recent weeks in its most recent price surge. That is the sign or a stock that has momentum and is overcoming barriers and is earning the trust of Wall Street.
Next, we often like to zoom out and look at the 10-year monthly chart to see how the past year fits into the longer-term trend.
Over the last ten years, $SKT has traded as high as $42.20 and as low as $4.05. The chart shows a sharp downturn at the heart of the pandemic when shutdowns were in force.

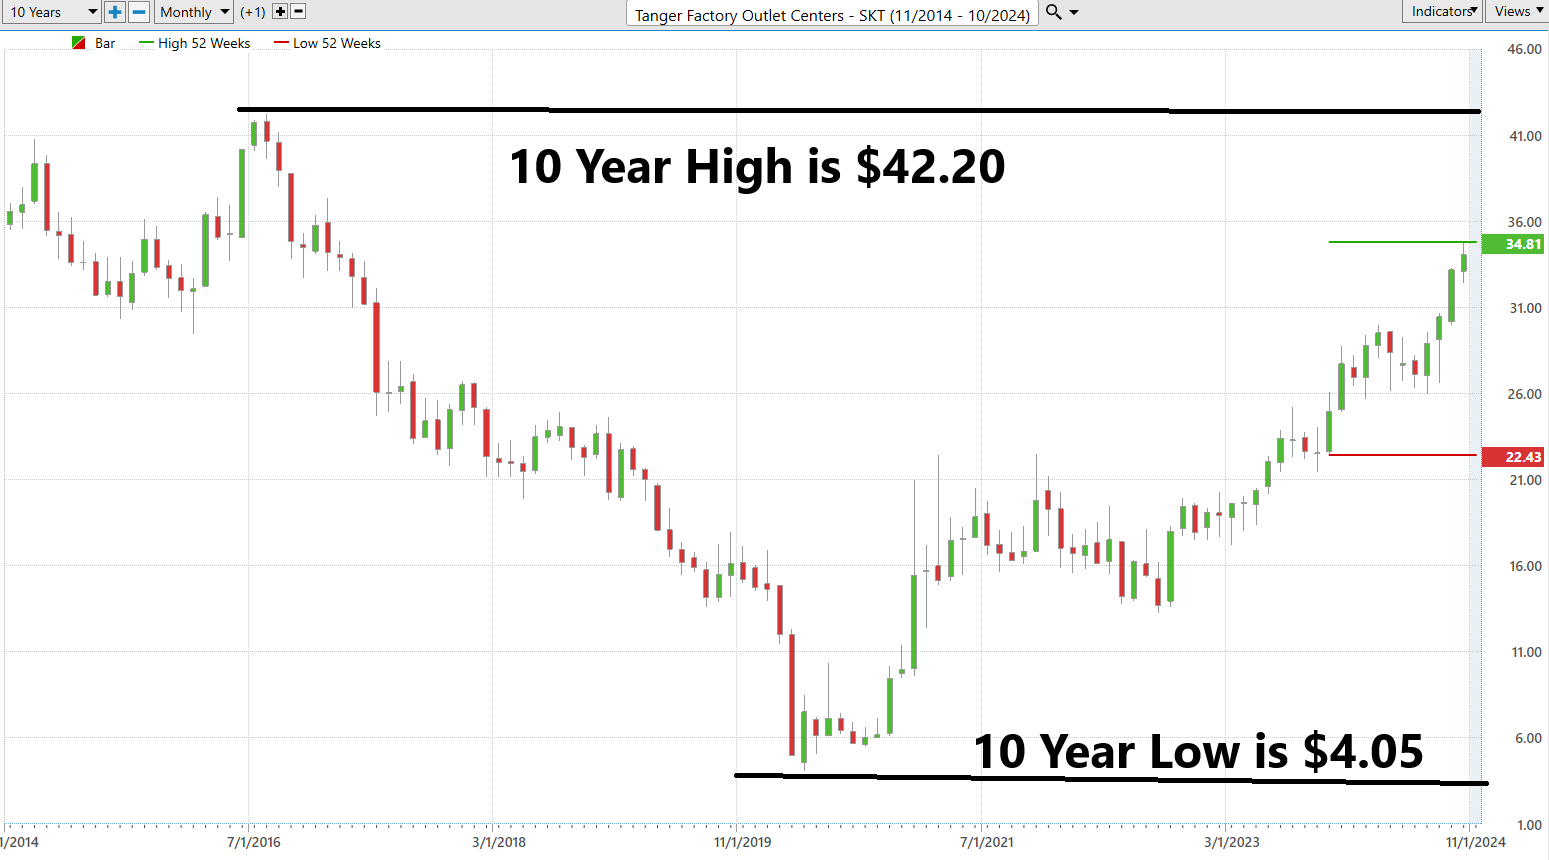
You can easily see that the next major area of resistance on the chart is the 10-year high at $42.20.
Best-Case/Worst-Case Analysis
Many traders enter the markets completely unaware and unprepared for the risk/reward associated with the trade. The simplest and most practical way to understand risk is by looking at the most consequential uninterrupted rallies and declines over the past year.
By delving into both the robust rallies and steep drops, traders can achieve a deeper understanding of market dynamics. It’s more than tactical — it’s about building a comprehensive strategy for navigating uncertainties in the financial markets. The stark contrasts between peak optimism and deep pessimism are telling, helping traders anticipate future market movements and shape well-informed, strategic decisions. Such readiness is vital for tackling the financial markets with confidence and foresight, blending the potential for gains with a cautious awareness of possible losses, thereby guiding traders toward sound decisions.
First off, we look at the best-case scenario:
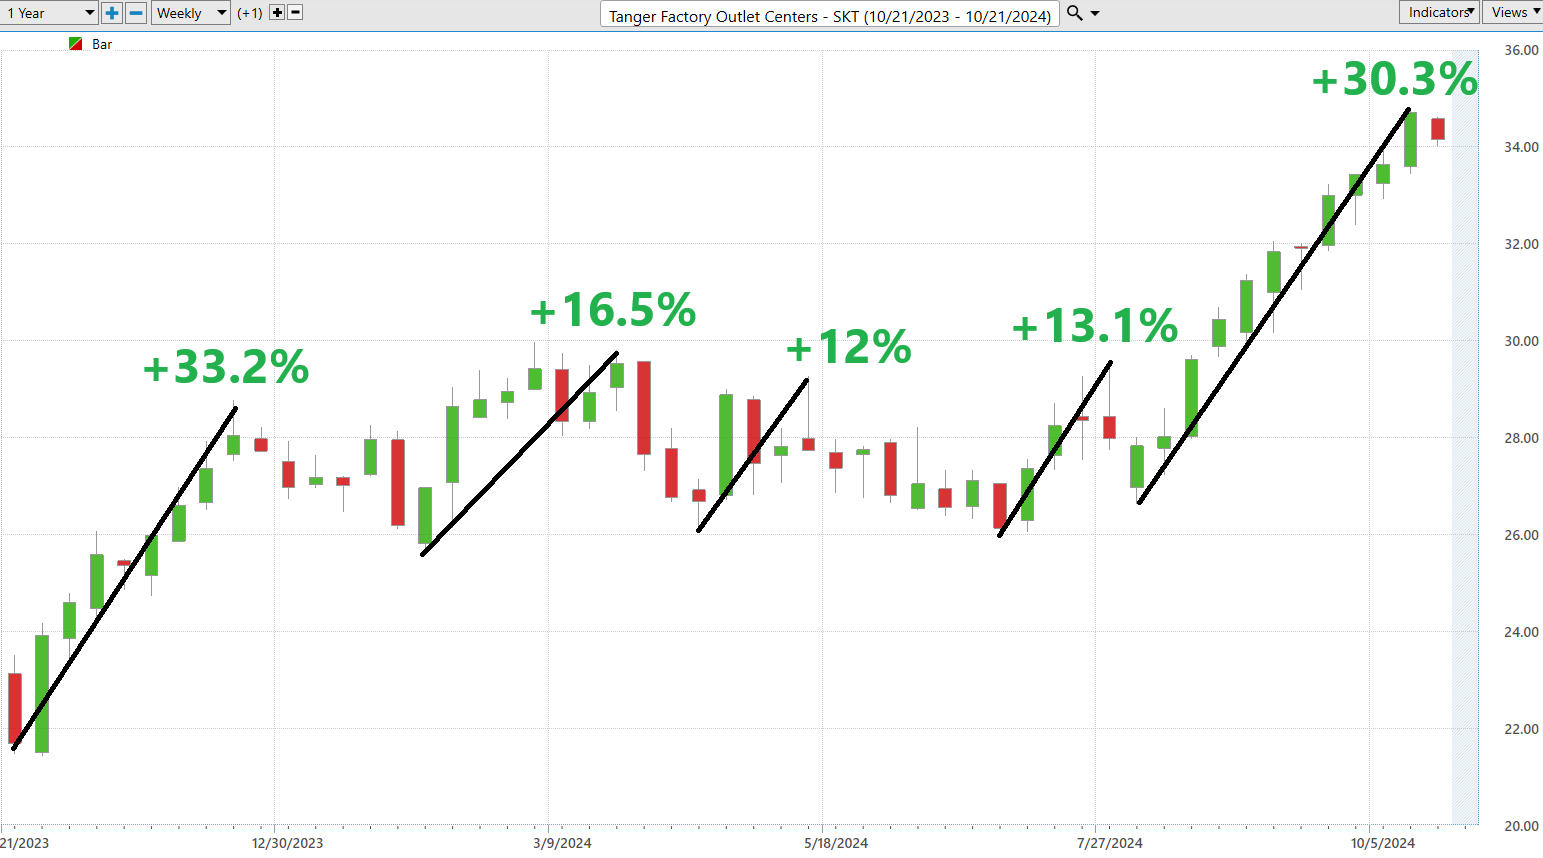
Next, we look at the worst-case scenario by assuming we bought the highs of each rallies and sold the lows.
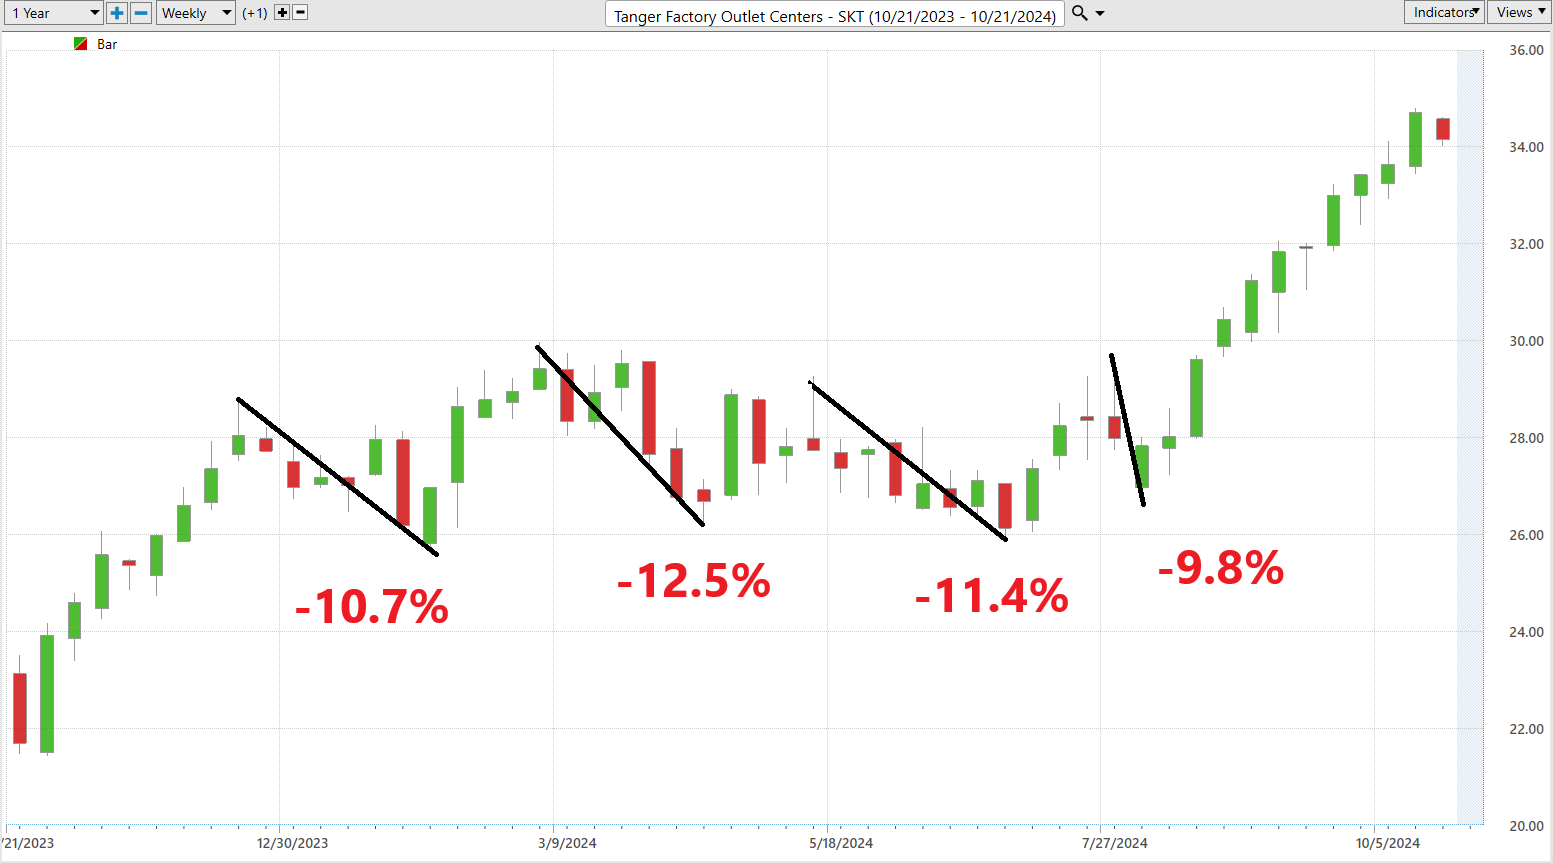
Just a glance at these two charts, and traders can gauge the risk-reward scenario for $SKT based on last year’s price movements. Now, let’s broaden the lens and stack $SKT up against broader market indexes across several timeframes. This comparison will shed light on how $SKT’s performance measures up to the varied rhythms of the stock market indices, offering a richer perspective on its standing. The rallies have been significantly larger than the declines and the bulls are clearly in control.

$SKT has outperformed the broader stock market indexes across all of the longer-term time frames.
Lastly, we look at beta. Beta is a measure of volatility that compares a stock’s performance to the broader stock market indexes. The beta of Tanger Outlets ($SKT) is 1.33.
Let’s break it down simply: Beta is a way to measure how much a stock’s price goes up and down compared to the whole stock market. If a stock has a beta of 1, it means it moves up and down just as much as the market does. Since $SKT has a beta of 1.33, it means it’s 33% more volatile than the market. If the market goes up a little, $SKT might go up .33% more, and if the market goes down, $SKT might go down more too. So, it’s a bit like a roller coaster that goes slightly faster than the one next to it!
Grasping the concept of beta is crucial because it gives us insights into the stock’s volatility in comparison to the broader market. This understanding is instrumental in shaping investment strategies, allowing investors to align their decisions with their personal appetite for risk.
Vantagepoint A.I. Predictive Blue Line
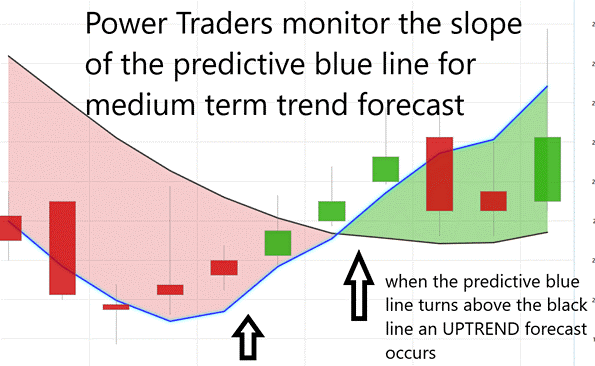
Dive into the deep end of A.I. market predictions for $SKT, jazzed up by VantagePoint Software. At the heart of this high-tech approach is the predictive blue line—an AI-powered marvel melded with intermarket analysis. Think of it as your lighthouse in the choppy seas of the financial markets.
Now, let’s zero in on the slope of this predictive blue line and its dance with the stock’s price. It’s a visual drama where the key scene is when the blue line vaults over the black line, queuing for a market trend shift.
Here’s what you need to keep your eyes on:
– The path of the predictive blue line sets the stage for $SKT’s market moves, sketching out what might come next.
– Enter the ‘Value Zone’ — this is any price below the predictive blue line which is a prime spot for traders to snatch up shares when prices dip to or below this predictive line, or to unload them during a downtrend as prices climb above.
– A dipping blue line? That’s your heads-up that prices might tumble, suggesting a good time for traders to pull back or hedge.
Armed with VantagePoint’s futuristic A.I., traders get a front-row seat to the latest trend predictions, keeping tabs on shifts in the blue line’s slope—essential intel for steering through market turbulences with agility.
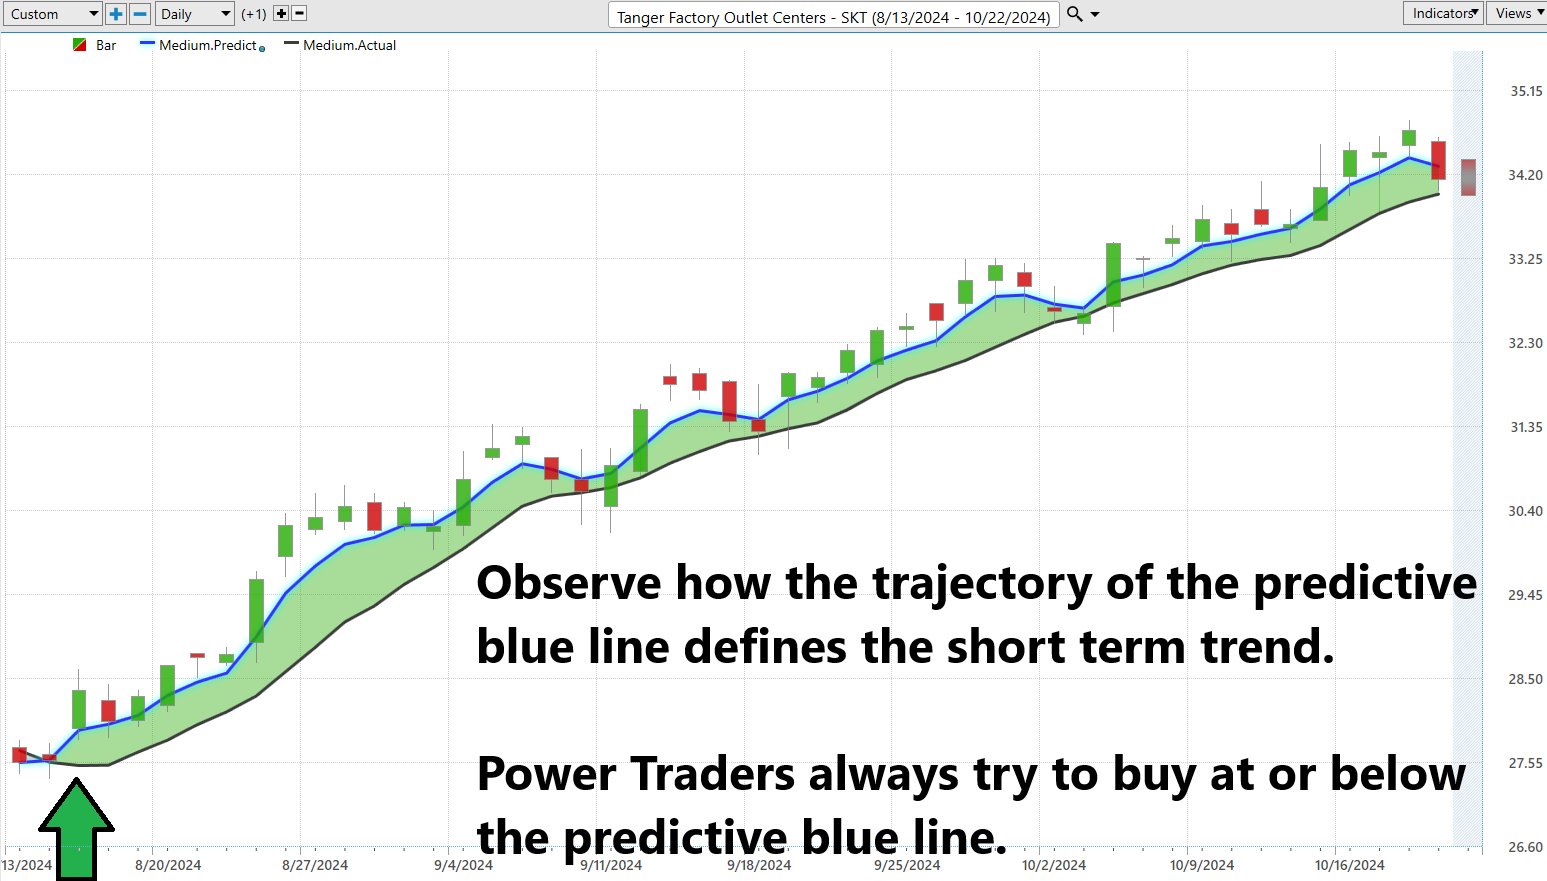
In the fast-paced world of finance, market players are constantly in search of tools that can refine their investment strategies. At the cutting edge of this technological frontier is VantagePoint Software, which harnesses artificial intelligence to decode financial markets, offering traders essential foresight into potential risks and rewards. At the heart of its functionality is the predictive blue line — a vital indicator that hints at forthcoming market trends. When this line trends upward, it signals a bullish market trajectory, potentially opening buying opportunities. Conversely, a downward trend could suggest a bearish outlook, prompting traders to exercise caution or consider selling. This tool does more than simply predict market movements; it provides strategic guidance on the timing of trades, significantly enhancing the potential for meaningful gains.
Neural Index (Machine Learning)
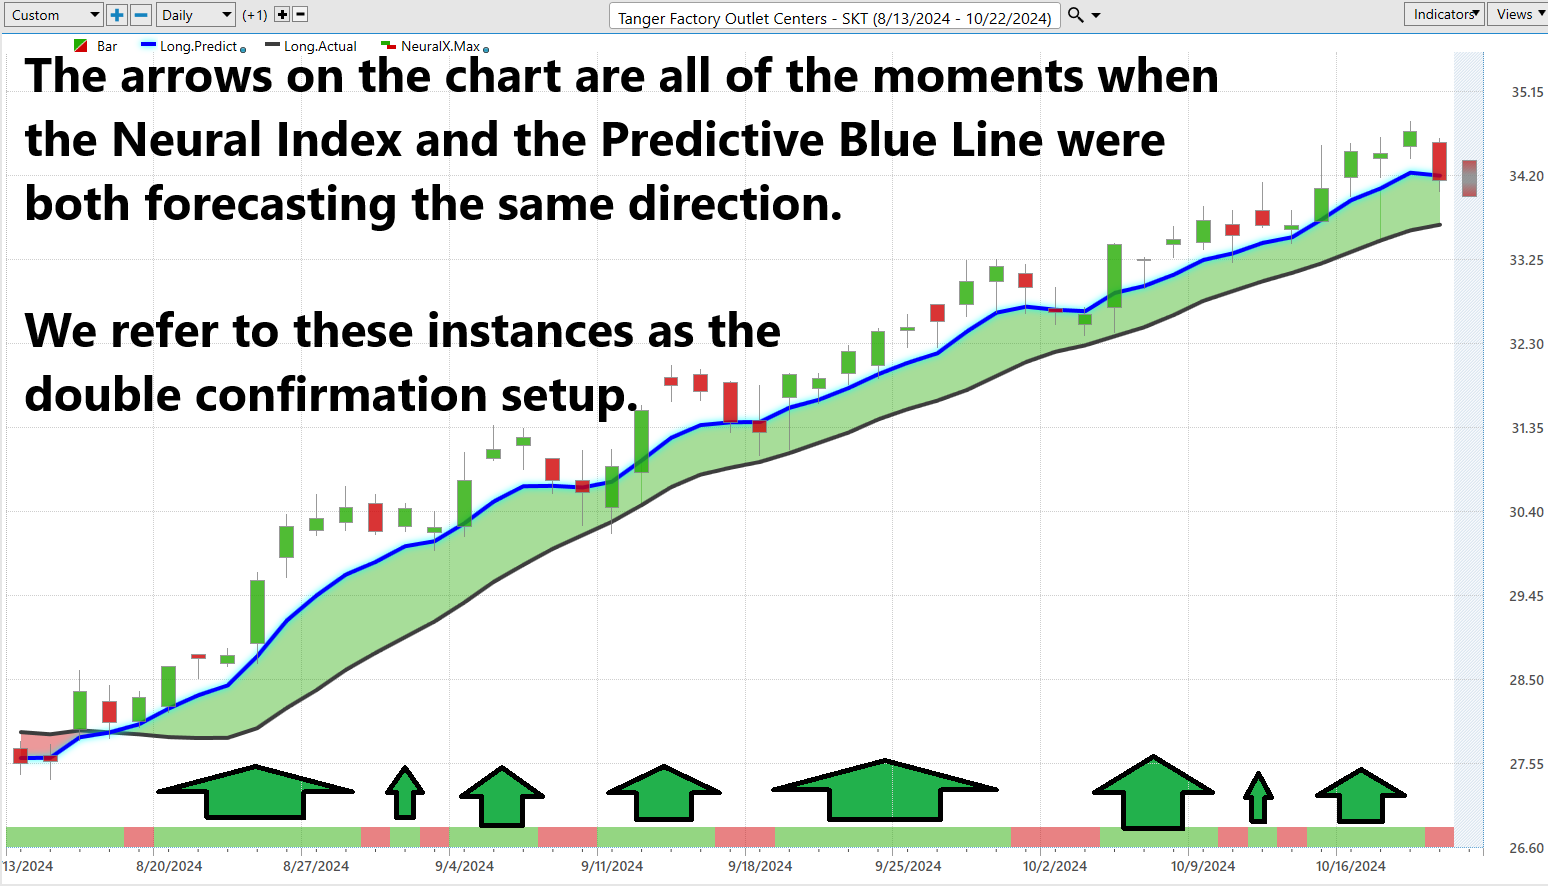
Neural networks are a sophisticated form of artificial intelligence that mimic the human brain’s approach to processing information. These networks utilize layers of interconnected “neurons” to analyze extensive market data, ultimately predicting future price movements. As these networks process data, they adjust and strengthen their neuron connections, which enhances their predictive accuracy over time.
Traders develop these neural networks by feeding them vast amounts of data, such as historical price trends and various market indicators. Through continuous refinement of connections within the neurons, the network becomes increasingly adept at identifying and forecasting market patterns.
In practical application, traders often employ tools like the Neural Index Indicator on their trading charts. This tool functions similarly to a traffic light, indicating whether market conditions are strong or weak. When used in conjunction with other indicators, such as the Predictive Blue Line, it helps traders determine the best times to execute trades. This fusion of advanced analytical tools not only improves the precision of trades but also emphasizes the importance of accuracy in making informed trading decisions, allowing traders to navigate the markets more effectively.
VantagePoint Software Daily Price Range Prediction
Let’s get right to the point. In the world of trading, timing isn’t just a luxury; it’s the entire playbook. For those Power Traders tuning in, the VantagePoint A.I. Daily Range Forecast isn’t merely a tool—it’s their ace in the hole. It’s about pinpointing those exact moments to make your move or hit the exit, the pivotal points that can make or break a trade.
Now, remember, volatility is always lurking, a constant presence, but merely having data on hand doesn’t cut it anymore. You’ve got to transform it — turn that raw data into actionable insights with the real heavy hitters: A.I., machine learning, neural networks. These aren’t just cool tech terms; they’re critical tools that hone your edge, slicing through the market clutter with sharp, clear forecasts.
Here’s what’s on deck: the daily, weekly, monthly average trading ranges for $SKT over the past year.

But in trading, what really matters is spotting those prime moments for entry and exit. Want to know precisely when to dive in or duck out? The Daily Range Forecast chart acts like your personal navigator in the hectic trading arena. It charts a path for your short-term trades with the precision needed to navigate the market’s ups and downs effectively. There’s no room for guesswork—the forecast lays out the exact trading range for the next day, with the trend clearly marked.
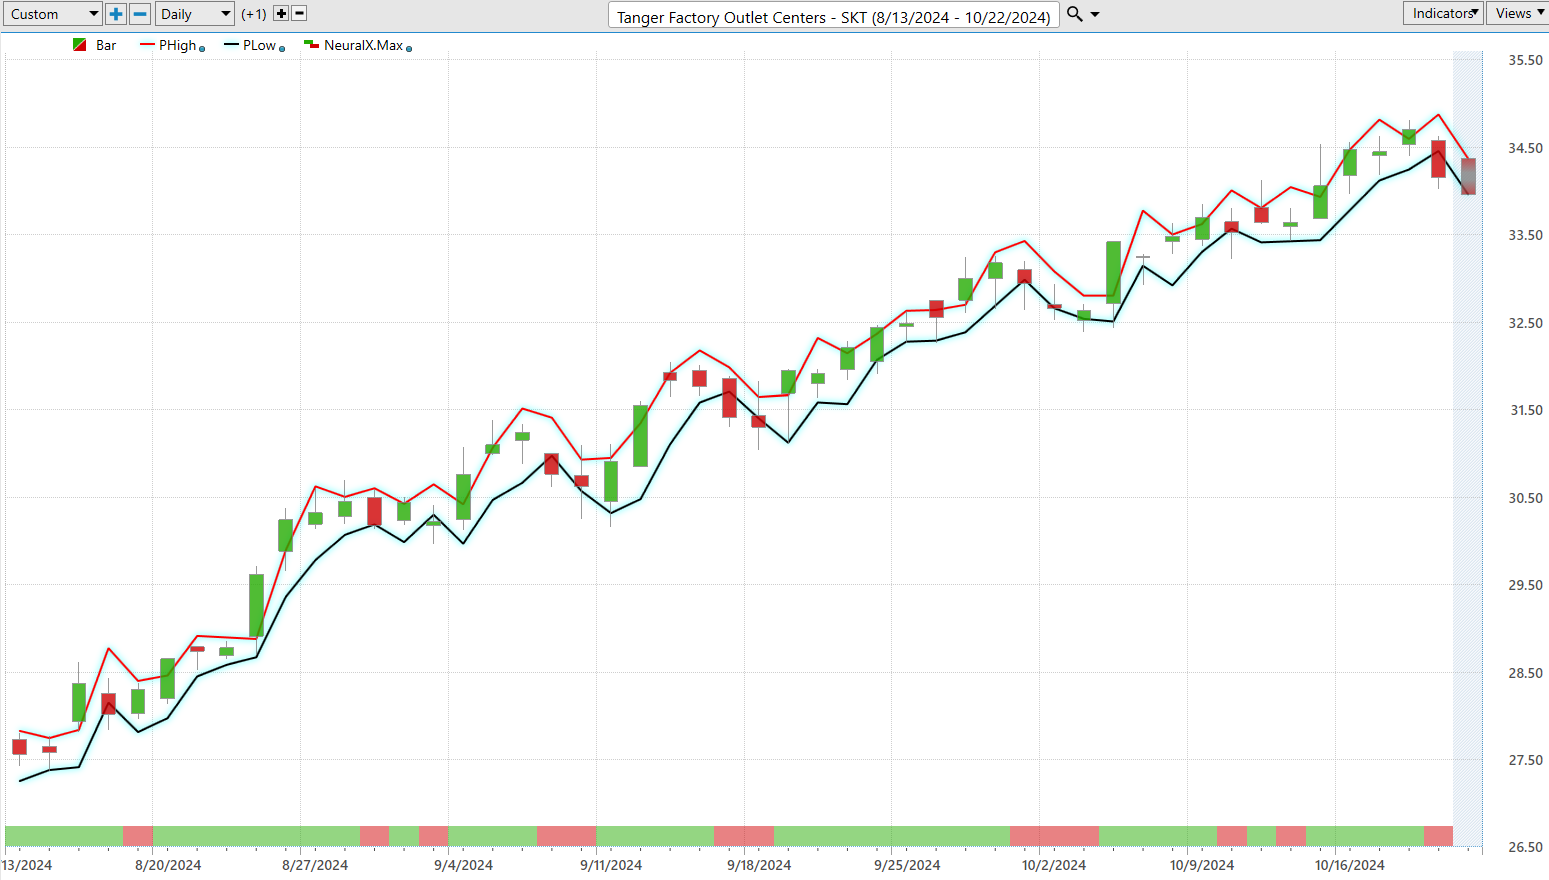
With VantagePoint A.I.’s Daily Range Forecast at your disposal, you are not merely surviving the tumultuous market waters; you are thriving. This powerful tool harnesses the capabilities of artificial intelligence to forecast market movements with extraordinary precision, providing you with the critical insights needed to time your trades with expert finesse.
Intermarket Analysis
Imagine peering into a kaleidoscope, where every twist shifts the pattern of colorful glass into a new configuration. That’s intermarket analysis. It’s the art of looking beyond the simple price movements within one market to see how the swirling currents of related markets influence one another. This method doesn’t just focus on stocks, or bonds, or commodities in isolation; it considers them as part of a grand, interconnected ballet, where the leaps and bounds in one sector can set the stage for moves in another.
Intermarket analysis? Think of it as playing detective in the world of trading. You’re not just peering into one market like stocks or bonds, but you’re also cross-examining how currencies, commodities, and other assets interact and influence one another. Take gold, for instance. When its prices hike, it’s not just a signal in a vacuum — it can shed light on movements in stocks or currency fluctuations.
By deciphering these complex relationships, traders and analysts can spot trends that might not be apparent when viewing markets in isolation. For example, a spike in oil prices might hint at upcoming turbulence in airline stocks, or a shift in bond yields could signal a movement in the currency markets. Intermarket analysis is about weaving these threads together, crafting a richer, more nuanced tapestry of global financial markets. It’s not just an analytical tool; it’s almost an art form, perfect for those who dare to see the market’s hidden narratives unfold.
Let’s spotlight two giants in this arena: John Murphy and Louis Mendelsohn. Murphy was instrumental in pushing the narrative that these markets aren’t just parallel lines but deeply interwoven webs. He penned seminal texts that guide traders through these intricate relationships for sharper trading insights. Then you’ve got Mendelsohn, who went a step further by forging the VantagePoint A.I. software, a tool that synthesizes vast amounts of market data through A.I., neural networks, and machine learning to forecast market trends.
Here is the intermarket analysis graphic which highlights the 31 key drivers of price:
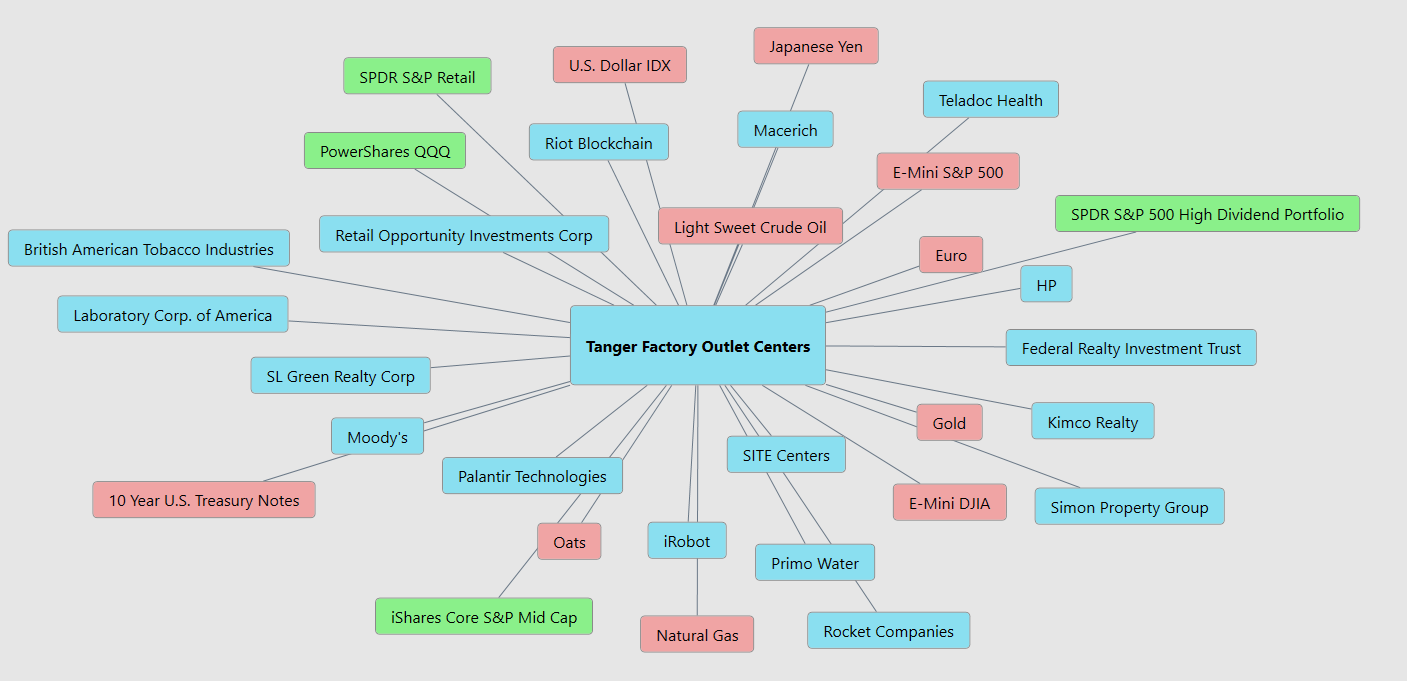
Adopting intermarket analysis isn’t just beneficial; it’s crucial. It provides traders with a panoramic view of the global financial ecosystem, helping them to make well-informed decisions by considering how intertwined and mutually influential these markets are. In today’s globalized market landscape, where dynamics in one corner of the world can ripple through others in real-time, understanding these connections is more vital than ever.
VantagePoint A.I. Seasonal Analysis
Seasonal analysis digs into the patterns that show up like clockwork every year in the markets. Think about how weather shifts mess with agricultural commodities, or how the holiday rush boosts retail stocks, or even how tax tweaks at the end of the year might shake things up.
Take Larry Williams, for instance, a titan when it comes to using seasonal trends to navigate the commodity markets. He famously turned a modest $10,000 into a staggering $1 million in under a year during a high stakes trading competition, leveraging these seasonal insights alongside other savvy trading moves.
So, what’s the scoop on using seasonal analysis? Here’s the seasonal analysis chart of $SKT. Observe how the stock has a seasonal tendency to rally on average 7 ½% until the end of the first week of December. We advise you to place $SKT on your trading radar watchlist and pay attention to its price action in the weeks ahead.
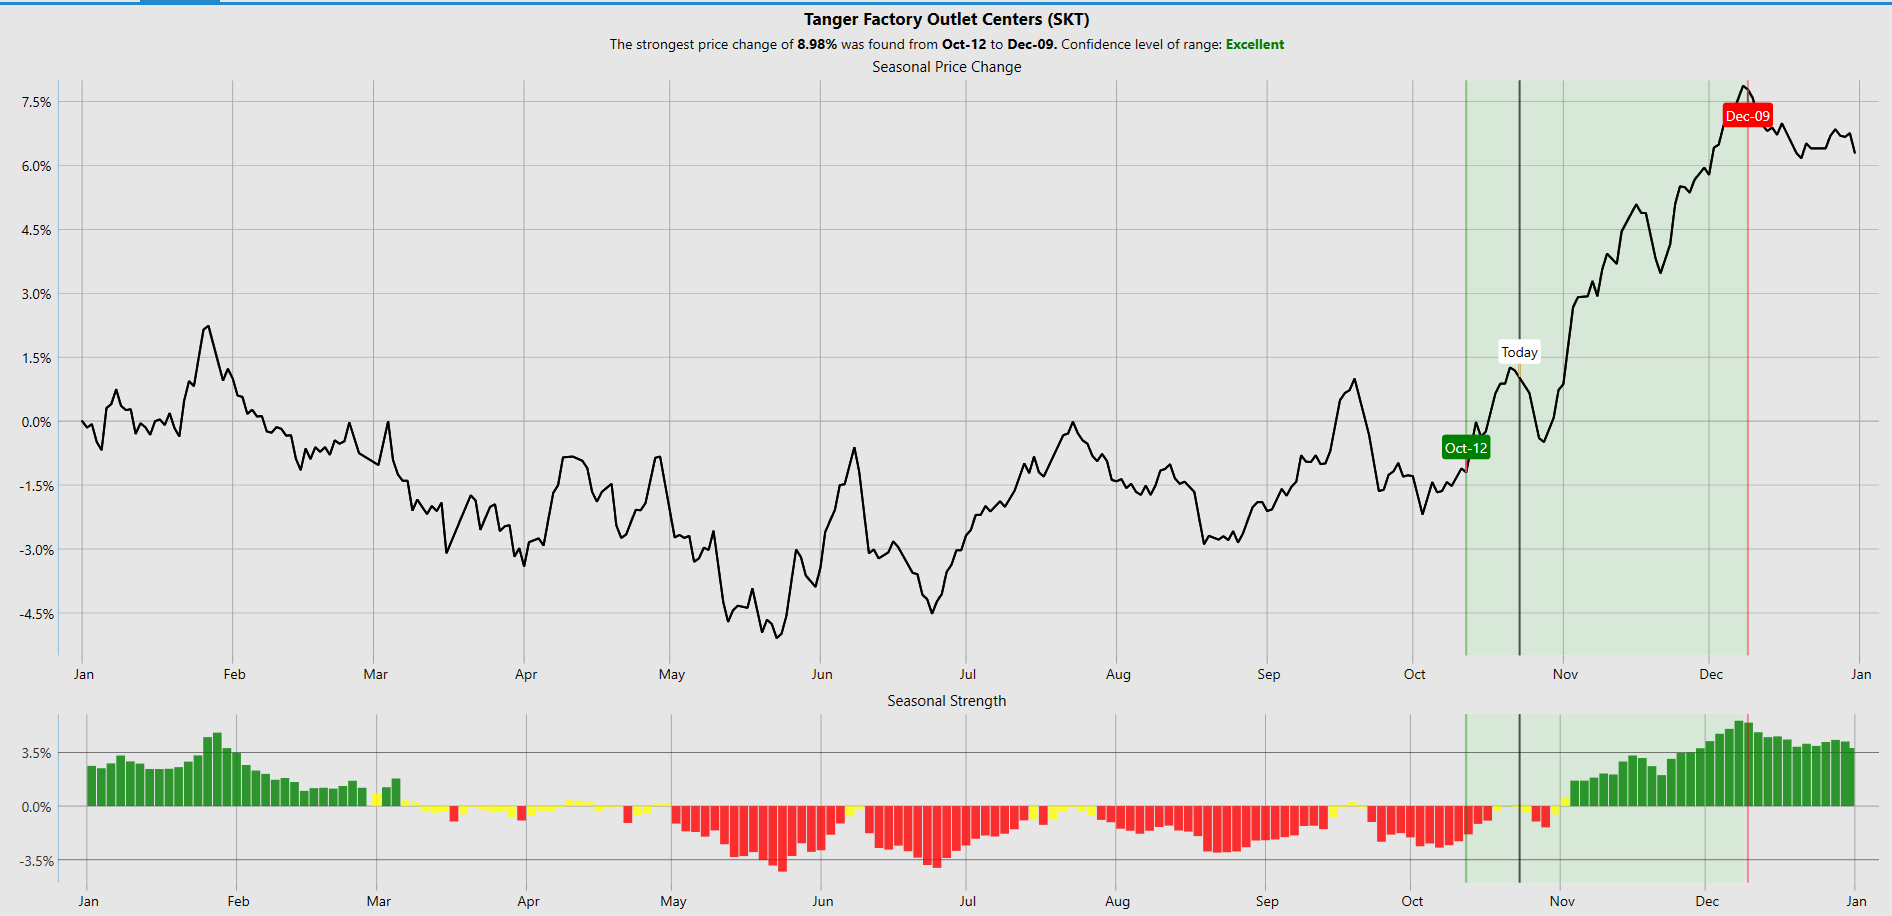
Seasonal analysis helps pin that down, sharpening your buying or selling strategies. By getting a read on potential dips or downturns, you can brace yourself and safeguard your investments before the storm hits. Spotting the prime times for market highs and lows can seriously boost your chances of nailing that perfect trade.
Remember, while no strategy offers a surefire win, mixing seasonal analysis with other technical and fundamental tools can seriously deepen your market insight and amp up your trading game.
Our Suggestion
The next earnings call is scheduled for November 4, 2024.
In the last two earnings calls, Tanger Outlets ($SKT) displayed solid financial performance with noteworthy improvements in key metrics. During the most recent quarter, Tanger reported enhanced revenue figures and increased funds from operations (FFO), a critical measure in the REIT industry. The company also highlighted its successful leasing activities, which have contributed to a high occupancy rate across its portfolio of outlet centers.
In the previous quarter, Tanger continued to demonstrate robust financial health, with improvements in same-center net operating income (NOI) and a notable reduction in its debt levels. Management’s commentary during the calls focused on strategic initiatives aimed at driving traffic and enhancing shopper experience, which have begun to yield positive results.
Given this strong performance and the strategic moves by Tanger’s management, Wall Street analysts are optimistic about the company’s future. There is growing expectation that the upward momentum seen in Tanger’s stock following these positive earnings reports will continue. Analysts believe that the company’s focus on high occupancy, effective cost management, and adaptive business strategies position Tanger well to capitalize on the recovering retail sector and maintain its rally in the stock market.
Practice good money management on all of your trades.
Rely on the daily range forecast for short-term swing trading opportunities.
It’s not magic.
It’s machine learning.
Disclaimer: THERE IS A HIGH DEGREE OF RISK INVOLVED IN TRADING. IT IS NOT PRUDENT OR ADVISABLE TO MAKE TRADING DECISIONS THAT ARE BEYOND YOUR FINANCIAL MEANS OR INVOLVE TRADING CAPITAL THAT YOU ARE NOT WILLING AND CAPABLE OF LOSING.
VANTAGEPOINT’S MARKETING CAMPAIGNS, OF ANY KIND, DO NOT CONSTITUTE TRADING ADVICE OR AN ENDORSEMENT OR RECOMMENDATION BY VANTAGEPOINT AI OR ANY ASSOCIATED AFFILIATES OF ANY TRADING METHODS, PROGRAMS, SYSTEMS OR ROUTINES. VANTAGEPOINT’S PERSONNEL ARE NOT LICENSED BROKERS OR ADVISORS AND DO NOT OFFER TRADING ADVICE.

