
| This Week’s a.i. Stock Spotlight is Applovin ($APP) |
AppLovin Corporation (NASDAQ: APP), incorporated in 2011 and headquartered in Palo Alto, California, operates through a robust business model in the software application industry, focusing primarily on enhancing the marketing and monetization of digital content. The company generates revenue through its two main segments: the Software Platform and Apps. Its offerings include a range of marketing software solutions and mobile gaming applications, which serve as its major profit centers. Beyond its core advertising services, AppLovin has expanded into the gaming sector, owning several gaming studios which contribute to its revenue through free-to-play mobile games. AppLovin leverages artificial intelligence extensively, particularly in its MAX platform, which optimizes the value of advertising inventory through real-time bidding processes. Over the past decade, AppLovin has made significant acquisitions to boost its capabilities and market share, including the purchase of Machine Zone and Adjust GmbH, enhancing its technology stack and market reach.
AppLovin has witnessed a meteoric rise in its stock price, surging by 760% in the recent year, positioning it as one of the best performers in the Russell 1000 index. Despite this rapid growth, it was notably snubbed for inclusion in the S&P 500, an event that triggered one of its worst trading days in two years. This exclusion could be seen as both a short-term setback and a potential indicator of volatility in its stock valuation.
Financially, AppLovin reported robust third-quarter revenue of $1.20 billion, a 39% increase from the previous year, surpassing analyst expectations. This performance underscores its strong foothold in the ad-tech sector, which has been buoyed by it’s A.I.-driven platforms like MAX and Adjust, catering effectively to both advertisers and publishers. The revenue and earnings table below clearly shows that revenue has been growing explosively, and that earnings have been very volatile. This is often the case with high-growth companies.

Despite its explosive growth, AppLovin faces significant competition from other tech giants in the advertising space, such as The Trade Desk and Google. However, it continues to innovate, as seen with its recent ventures into connected TV and streaming video markets through acquisitions like Wurl, which enhances its content distribution and advertising capabilities.
From a financial perspective, AppLovin has taken on considerable leverage, with a recent public offering of $3.55 billion in senior notes to fund its ongoing expansions and possibly future acquisitions, which marks a pivotal move in its growth strategy but also increases its debt burden.
Historically, Wall Street analysts have been generally favorable towards AppLovin, often categorizing it as a buy due to its innovative market approach and solid earnings growth, which is projected to increase significantly in the coming year. Most analysts are concerned about high debt levels, and the company’s dependency on the volatile ad market along with intense competition, regulatory challenges, and market saturation in digital advertising.
In summary, AppLovin stands out as a dynamic player in the tech and advertising sectors, with significant growth driven by strategic innovations and market expansion. However, its recent rapid stock price increases and high levels of debt introduce elements of risk that warrant close monitoring by investors and analysts alike. This balance of opportunities and challenges makes AppLovin a quintessential example of a high-reward, high-risk asset in today’s volatile market environment. $APP is expected to continue growth with innovative advertising solutions, though market volatility and high valuation pose risks. Their major catalysts moving forward are reason enough to place them on your radar as there is potential inclusion in major indices, new product launches, and market expansion strategies.
What is truly impressive about the fundamental performance of the company is that Q3 revenue of $1.20 billion was up 39% year-over-year. This type of growth speaks loud and clear that the company is growing quickly.
In this stock study, we will look at an analysis of the following indicators and metrics which are our guidelines, and which dictate our behavior in deciding whether to buy, sell or stand aside on a particular stock.
- Wall Street Analysts Ratings and Forecasts
- 52 Week High and Low Boundaries
- Best-Case/Worst-Case Analysis
- Vantagepoint A.I. Predictive Blue Line Indicator
- Neural Network Forecast (Machine Learning)
- VantagePoint A.I. Daily Range Forecast
- Intermarket Analysis
- Our Suggestion
While we make all our decisions based upon the artificial intelligence forecasts, we do look at the fundamentals briefly, just to understand the financial landscape that $APP is operating in.
Wall Street Analysts Forecasts

Nineteen of Wall Street’s sharpest minds have zeroed in on AppLovin, each offering their own predictions for the next 12 months. They’ve crunched the numbers, debated scenarios, and finally landed on an intriguing consensus. The magic number? $306.61 is the average price target they’ve set, offering a tantalizing glimpse at potential returns.
But wait, the plot thickens!
The forecasts range dramatically — from a cautious low of $66.00 to an exhilarating high of $480.00. Such a wide array spells opportunity, and also a hint of mystery. Why such variance? What do they see that we might be missing?
Currently, AppLovin is trading at $321.06, sitting above the average target, suggesting a slight dip of 4.50% might be on the horizon according to these financial wizards. Now, with such insights at your fingertips, the question becomes — what’s your move? Will you bet on the promise of growth to the dizzying highs, take heed of the potential fall to lower bounds, or see wisdom in the average play?
This scenario isn’t just about numbers; it’s about narratives.
We always advise traders to pay very close attention to the variance between the most bullish and bearish forecasts. This value provides a very good estimate of expected future volatility. Currently this value is 129%, which is incredibly high and tells us that analysts are expecting huge volatility moving forward.
52 Week High and Low Boundaries

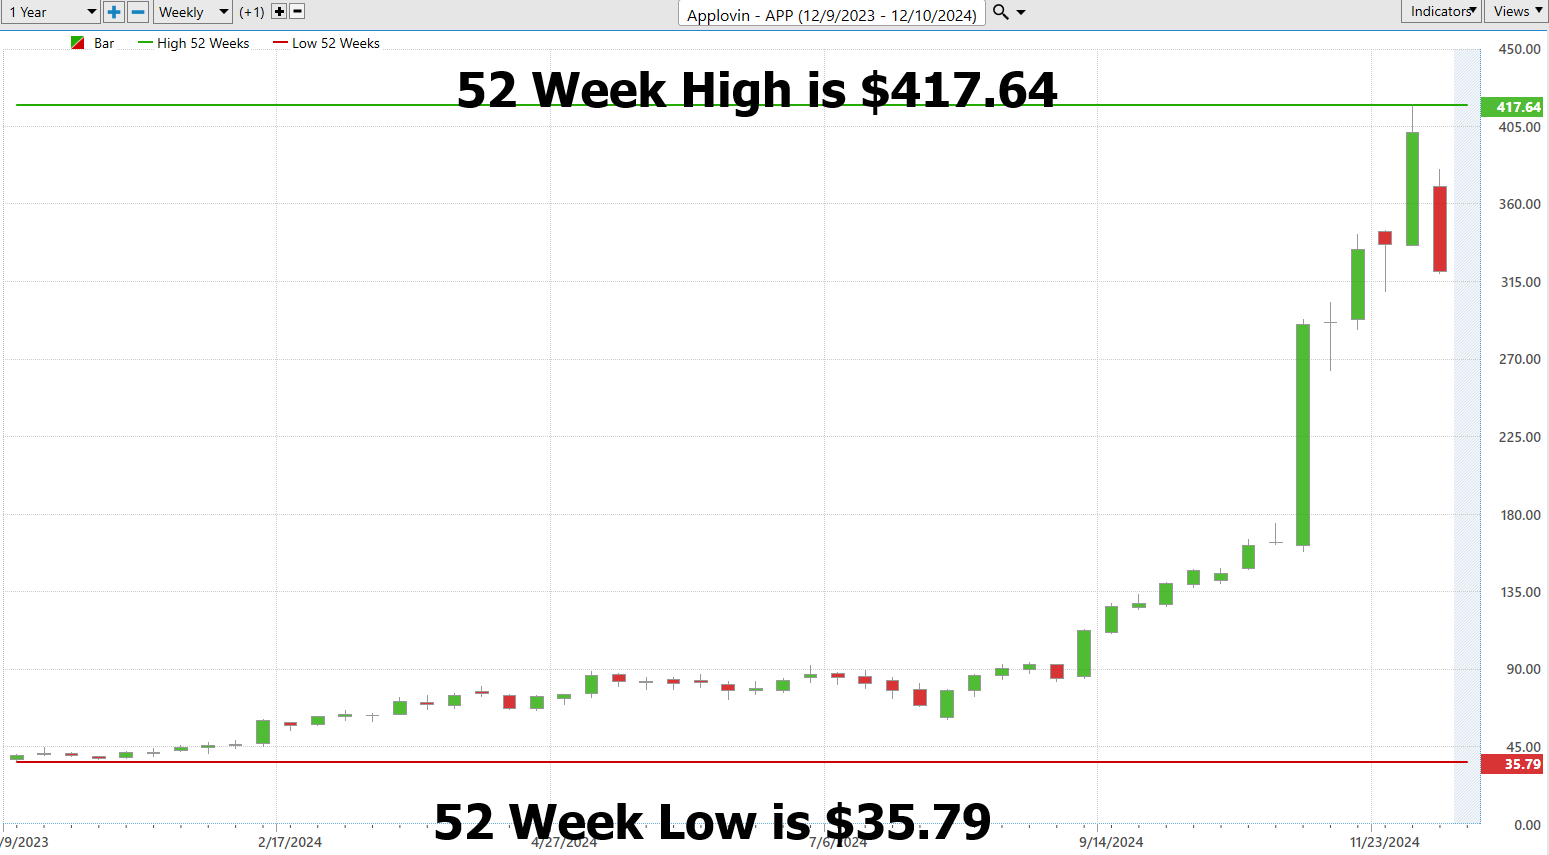
For new traders, diving into the stock market isn’t just about picking winners; it’s about understanding the battlefield. The annual trading range of a stock serves as a critical barometer for measuring a stock’s volatility — showing the highest and lowest prices within a given year. This range gives you the lay of the land, revealing how much ground a stock can cover when it runs wild or retreats. Knowing these boundaries helps in setting realistic expectations about potential profit and loss, and it’s crucial for strategizing entries and exits. It’s about knowing when to hold your ground and when to charge.
But there’s more to it than just numbers on a chart. This historical volatility isn’t just a record of the past; it’s a glimpse into the potential future. If history repeats itself, understanding that a stock has swung wildly between highs and lows in the past arms you with the insight to anticipate similar moves ahead. It prepares you mentally and strategically to face market upheavals without blinking — an essential skill in the stock trading arena. Remember, knowledge of past volatility helps in taming the beasts of risk and opportunity on the trading floor.
Traders should always start every trading opportunity by analyzing the 52-week chart. This will provide context.
Best-Case/Worst-Case Analysis
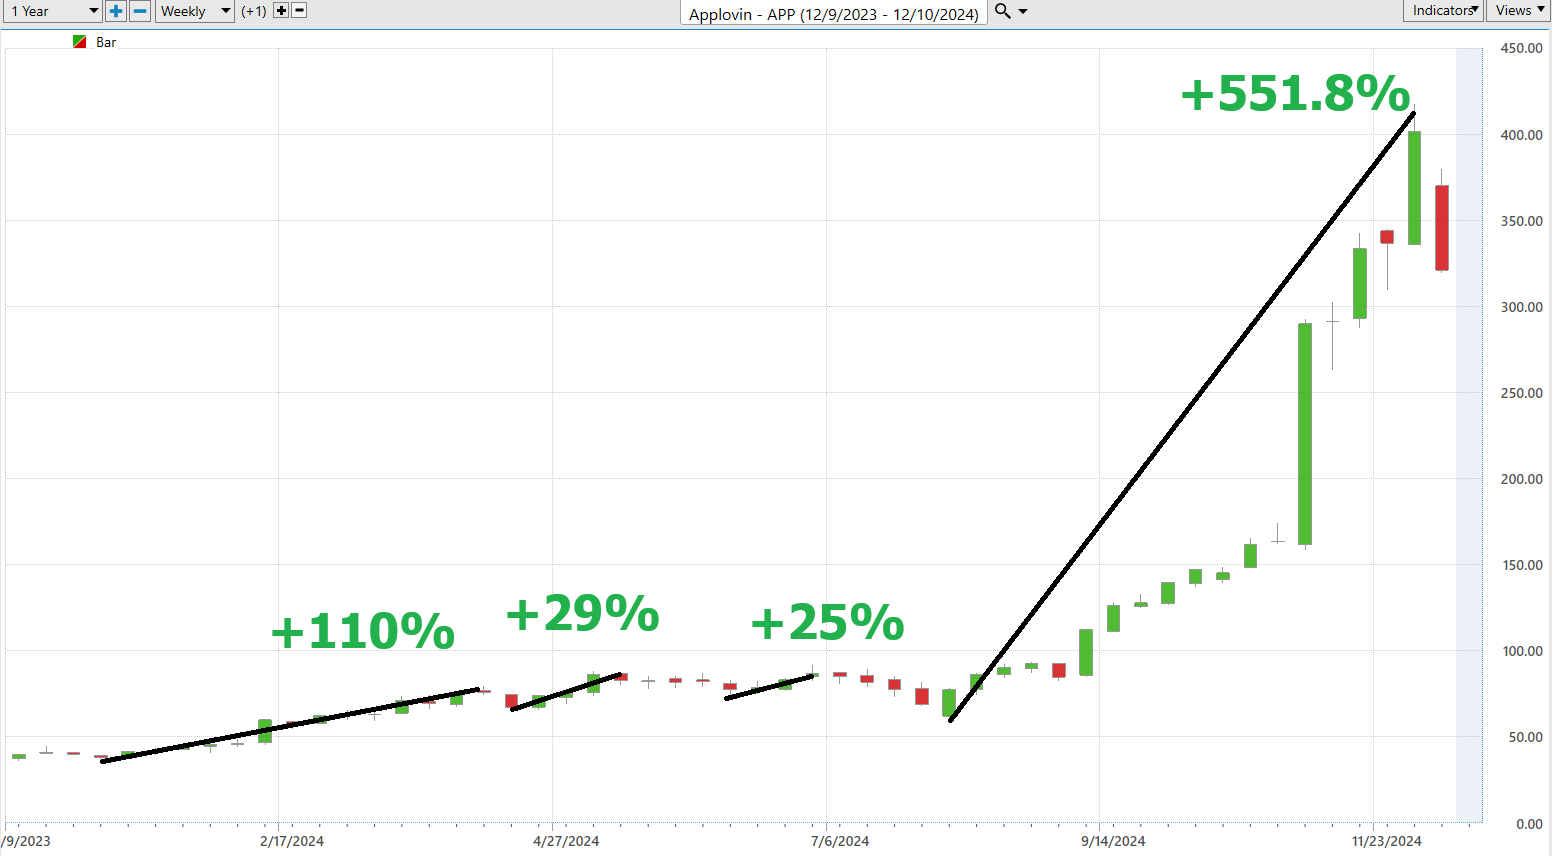
To truly excel in trading, one should develop an obsession with accurately measuring risk and reward. The simplest and most direct way to do this is by analyzing the largest uninterrupted rallies and declines a stock has experienced over the past year. This practical approach not only clarifies the potential risks and rewards but also aids in fine-tuning position sizes based on the observed volatility, providing a strategic edge in navigating the market’s fluctuations.
In the stock market, volatility isn’t just a challenge — it’s the game changer, especially when it blindsides traders with losses. By scrutinizing a stock’s largest uninterrupted rallies and declines over the past year, we can decipher much more than just its past behavior; we’re peering into the very essence of what drives its peaks and troughs. This deep dive into the stock’s performance under stress isn’t merely about tallying ups and downs — it’s about crafting a battle plan that respects the stock’s potential for dramatic swings. This rigorous analysis arms traders with the foresight to navigate future storms, strategically positioning them to harness volatility, not just endure it.
First, we look at the best-case scenario by measuring the largest uninterrupted rallies over the past 52 weeks.
Then we measure the largest uninterrupted declines for the worst-case scenario:
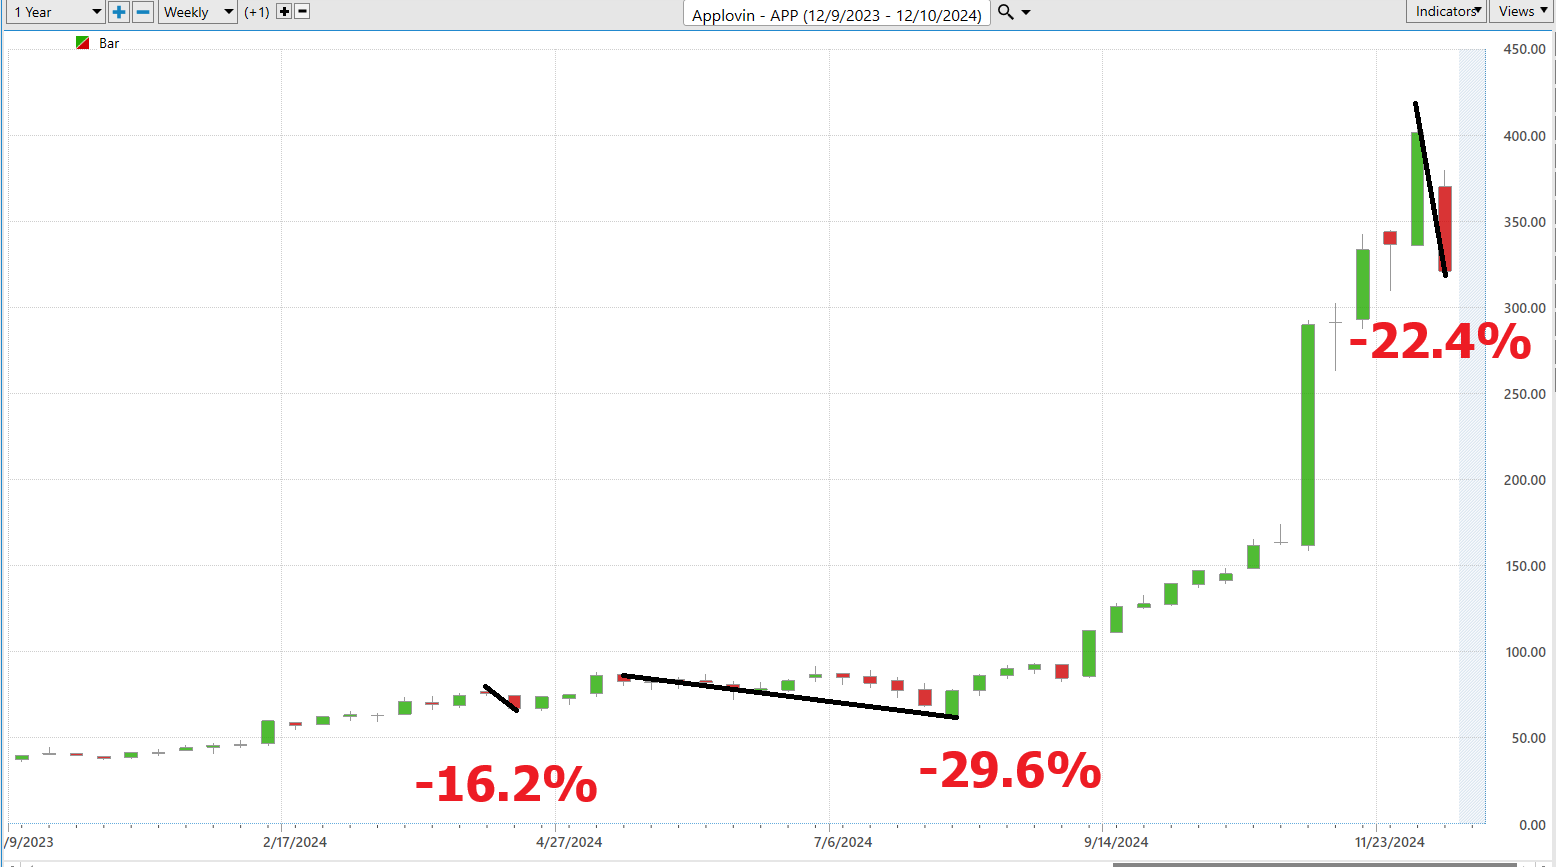
This practical exercise allows any trader to see two charts which not only show the potential but also clearly outline the risk.
This comparative analysis is indispensable for traders aiming to skillfully navigate through the volatile waters of $APP’s price shifts and the broader fluctuations of the global markets with a level of informed precision that only such practical study can provide.
Next, we compare $APP to the broader stock market indexes.

The volatility in $APP is clearly visible in this graphic which allows us to see the magnitude of volatility on the upside and downside.
AppLovin’s beta is 2.28. This figure is more than just a number — it’s a key indicator of how much more volatile AppLovin’s stock is compared to the broader market. For those new to trading, think of beta as a measure of a stock’s sensitivity to market movements. A beta of 1 means a stock moves in line with the market. However, a beta of 2.28, like that of AppLovin, suggests the stock will swing 128% as aggressively compared to the market average. This can spell bigger risks, but also potentially greater rewards, setting the stage for strategic decisions on risk management and investment sizing based on how much heat you, as a trader, are prepared to handle in the market’s ebb and flow.
Vantagepoint A.I. Predictive Blue Line
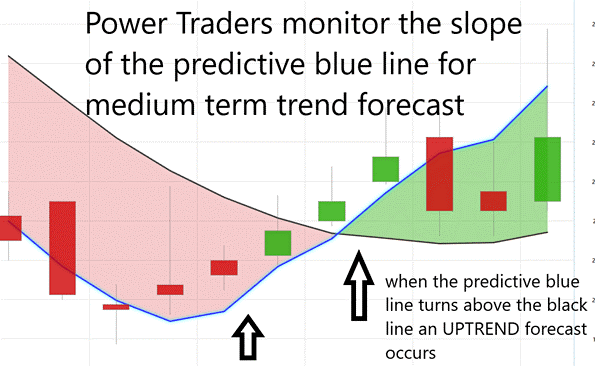
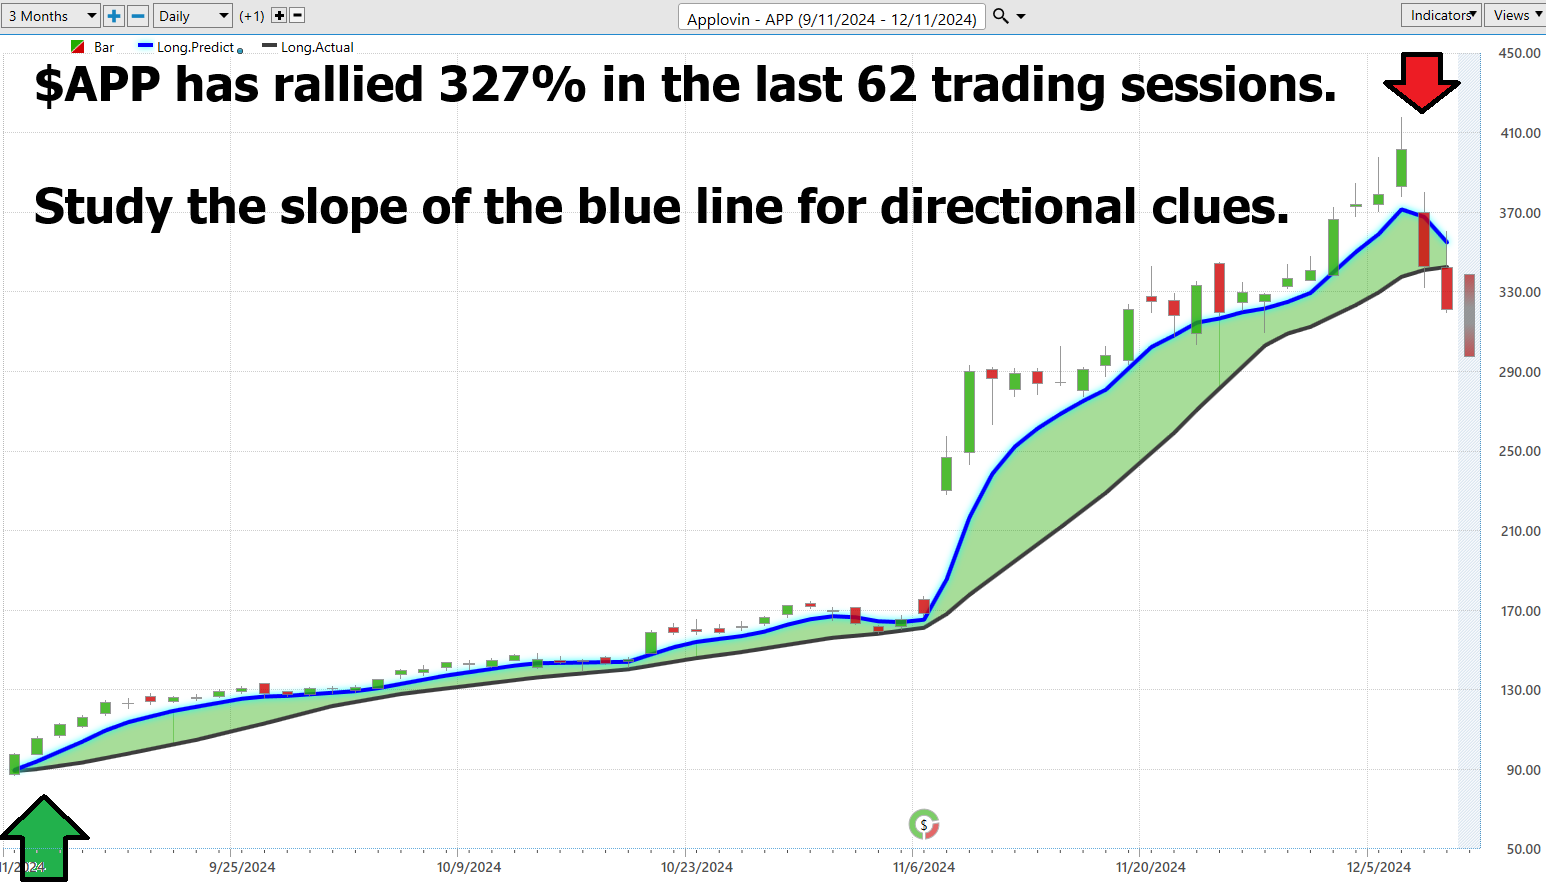
Let’s step into the exciting world of VantagePoint Software’s A.I.-driven forecasts for $APP, where the centerpiece is the “predictive blue line.” This isn’t merely a line on a chart; it’s a cutting-edge fusion of artificial intelligence and deep market insight crafted to precisely forecast the future trajectory of $APP’s stock price.
This predictive blue line is your compass in the stock market wilderness, guiding you through the thicket of daily trading decisions:
- Examine the Slope : Observe whether this line is ascending or descending. Its direction offers a crucial hint about the upcoming price action of the stock. An upward trend could signal a rising stock price, whereas a downward trend might suggest an impending drop.
- Value Zone Vigilance : This zone is critical. If $APP’s stock price approaches or dips below this blue line, it might be the perfect time to consider buying. On the flip side, if the stock price surpasses the line in a downward trend, it could be a signal to sell and reallocate your investments.
- Downward Slope Warning : A downward shift in the blue line should raise a red flag, hinting that the stock price may soon decrease. This alert is essential for deciding whether to sell off some of your holdings or adjust your strategy to mitigate potential losses.
Leveraging this predictive blue line from VantagePoint allows traders to skillfully navigate through market volatility, empowering them to make informed, strategic trading decisions. This tool doesn’t just track stock movements — it helps you anticipate them, giving you a formidable advantage in the fast-paced trading arena.
Neural Network Indicator (Machine Learning)
Envision a neural network as an elite brainstorming squad where each participant, or node, engages in collaborative problem-solving, mirroring the intricate web of our brain’s neurons. These nodes tirelessly sift through extensive datasets — from stock fluctuations to market trends — piecing together clues in a complex analysis.
Why do neural networks represent a revolutionary advantage for traders, especially those skilled navigators of today’s swift market currents? They slice through the daily noise to unearth intricate patterns that might escape human scrutiny, pinpointing the most opportune moments for trading actions. This method is rooted not in instinct but in precise, data-informed insights that can significantly amplify profitability.
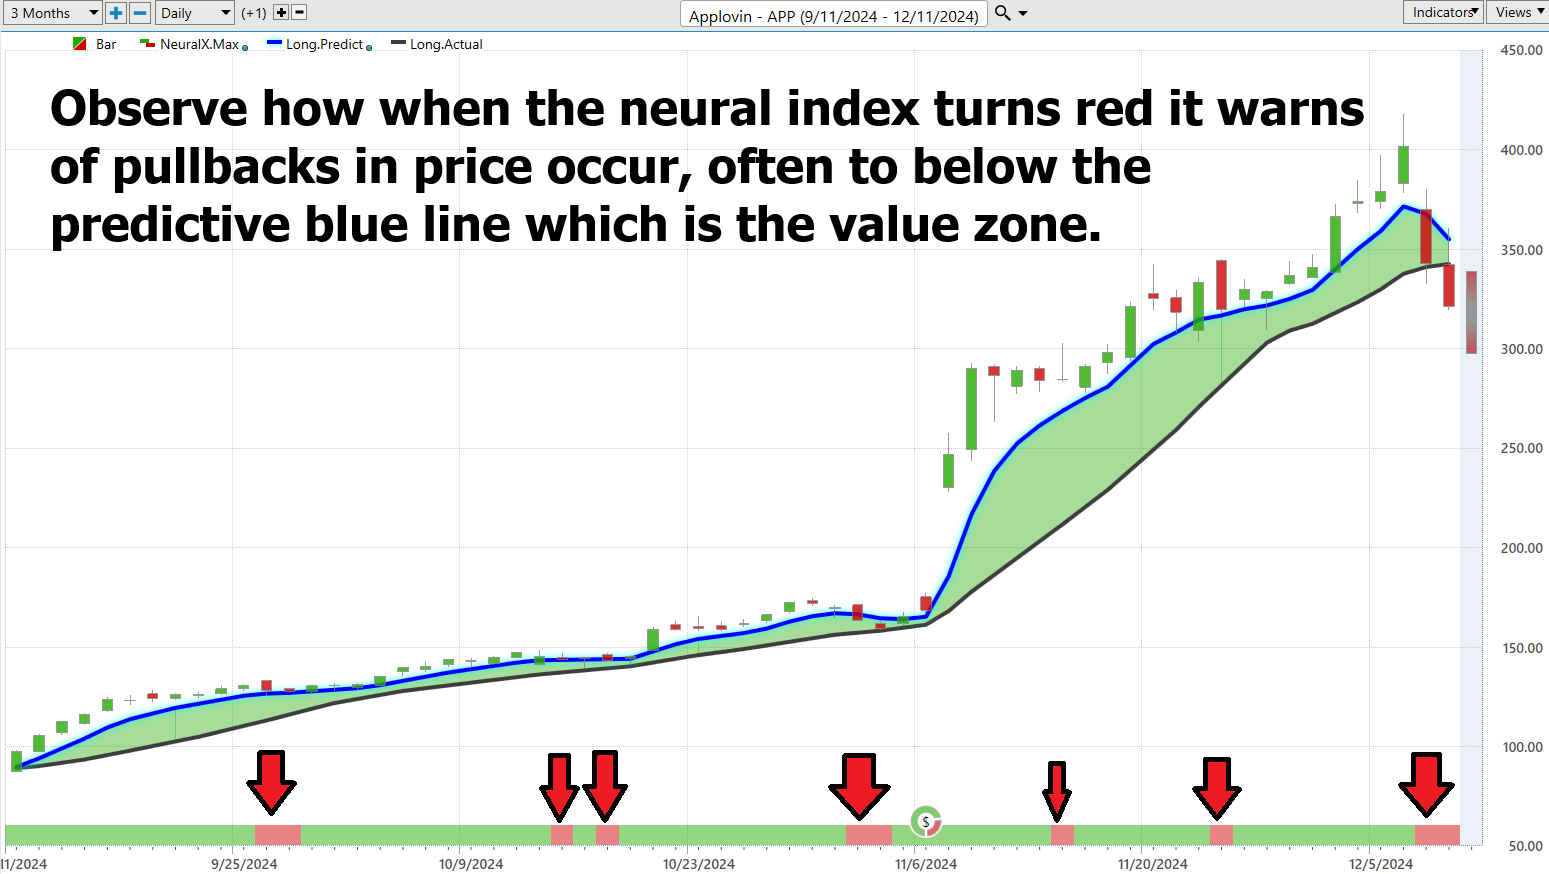
Study the chart below and observe how when the neural index turns red it warns of pullbacks in price often to below the predictive blue line which is the value zone.
Neural networks are redefining trading by delivering swift processing, unparalleled accuracy, and continuous learning, reducing human error while enhancing forecasting accuracy. They keep traders on the pulse of market fluctuations with real-time updates, serving as an adept guide through the unpredictable waters of finance.
Harnessing these insights equips traders with a practical, systematic strategy for anticipating price movements in $APP.
VantagePoint Software Daily Price Range Prediction
In the high-stakes world of trading, timing isn’t merely a luxury — it’s the very pulse of profitability. For those in the elite cadre of Power Traders, the VantagePoint A.I. Daily Range Forecast transcends the ordinary; it’s a transformative tool that hones their instincts, allowing them to pinpoint the exact moments to enter or exit trades—decisions that are critical to their financial triumphs.
Market volatility isn’t just part of the trading landscape; it’s an ever-present backdrop every trader must contend with. Yet, in today’s complex market terrain, mere data doesn’t suffice. To truly rise above and secure a competitive advantage, this data must be converted into actionable insights. Enter the realm of artificial intelligence, machine learning, and neural networks—far more than mere industry jargon, these technologies are indispensable for slicing through market noise and delivering razor-sharp predictions.
Below, we present the average trading ranges for $APP over the past year.

Understanding the volatility you’re likely to encounter is just a fragment of the broader trading strategy. The true art in trading hinges on the precise timing of market entry and exit. VantagePoint’s A.I. Daily Range Forecast transcends the typical use of charts; it serves as a navigational aid for the astute short-term swing trader, delineating expected daily price movements with remarkable precision. In the intense arena of trading, precision isn’t merely beneficial — it’s imperative.
This tool, standing on the forefront of technological advancement, meticulously parses the nuances of each trading session. It provides traders with a roadmap through the day’s fluctuations to those pivotal trading opportunities. Look at the chart below. Do you see how the trend lines and projections stand out? This display is not just visually compelling; it’s a robust demonstration of the tool’s predictive prowess and its crucial role in formulating strategic trading decisions.
Intermarket Analysis
Imagine you’re at the controls of a vast network of train tracks, where every switch and signal affect the movement and timing of different trains across the system. Intermarket analysis is akin to being the master controller who doesn’t just monitor one train or track but understands how adjusting one line influences traffic across the entire network.
In the financial world, this means scrutinizing various markets — like stocks, bonds, currencies, cryptocurrencies, and commodities — simultaneously to discern how shifts in one can ripple through the others. For instance, if oil prices climb, it could lead airline stocks to falter due to rising fuel costs. Or an increase in interest rates might lower bond prices, influencing how and where people invest in stocks or real estate. This comprehensive oversight enables traders to predict and adapt to market movements more effectively, managing their investments across the financial landscape with the precision of a skilled train dispatcher.
AppLovin Corporation ($APP) requires a nuanced understanding to unravel the threads that might influence its stock performance. Key to this endeavor is examining $APP’s alignment within the technology sector, benchmarking its dynamics against leading tech indices like the NASDAQ. As the digital advertising sphere evolves, so too does the necessity to monitor broader economic indicators such as interest rates, which affect both consumer spending and corporate investment capacities in technology. Additionally, understanding the macroeconomic environment, including GDP growth rates and consumer confidence, offers a window into potential shifts in advertising expenditures that directly correlate with $APP’s revenue streams.
Below are the 31 key drivers of price at this time.
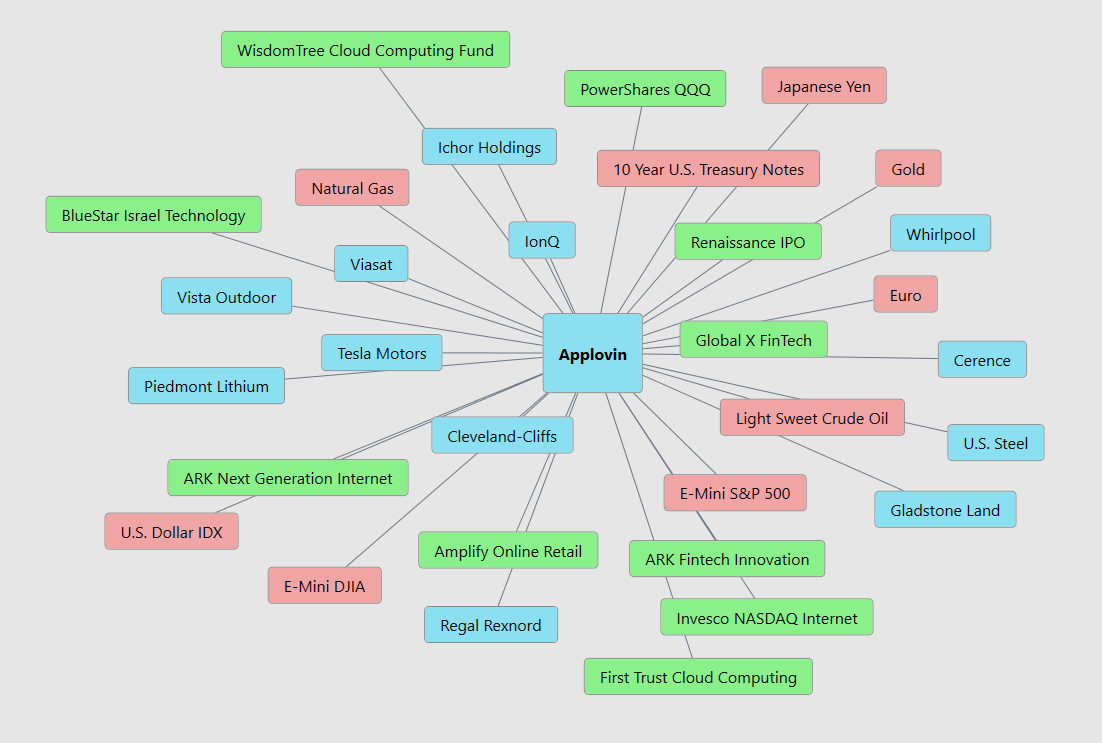
Trends in mobile usage, app engagement, and the digital shift in advertising budgets are paramount in forecasting $APP’s operational success. Regulatory scrutiny around data privacy and antitrust concerns also looms large, posing potential risks or restraints to its business model and operational freedom. Equally, as a global player, $APP must navigate the turbulent waters of currency fluctuations which could sway its financial outcomes. Together, these factors coalesce to form a complex matrix of variables that traders and investors must analyze to predict $APP’s price movements accurately, ensuring strategic decisions are grounded in a comprehensive understanding of both market-specific and macroeconomic influences.
Our Suggestion
Over the last two quarters, AppLovin Corporation ($APP) has demonstrated remarkable financial performance, which illuminates both opportunities and challenges the company faces.
AppLovin’s third-quarter earnings for 2024 showed a significant uptick, with earnings reported at $434.3 million, marking a 40.1% increase from the previous quarter. This period highlighted the company’s robust growth trajectory, showcasing a stunning 1,000% year-over-year earnings growth, which was highlighted in their reported annual earnings. This level of earnings growth is a powerful catalyst for stock price surges and analysts will be glue to the next earnings call scheduled for February 7, 2025.
The consistent growth in earnings and the successful leveraging of AI and software solutions demonstrate AppLovin’s ability to capitalize on the increasing demand for mobile technology and digital advertising solutions. Their strategic acquisitions and expansions into new markets are poised to sustain growth momentum by broadening their client base and enhancing service offerings.
Despite these opportunities, AppLovin faces challenges typical of the fast-evolving tech sector, such as maintaining innovation pace, dealing with intense competition, and navigating regulatory changes affecting digital privacy and advertising. The high growth rate also sets a high bar for future performance, potentially putting pressure on the company to sustain its growth trajectory.
Overall, AppLovin’s recent earnings calls reflect a company on a rapid growth path, with significant opportunities tempered by industry-specific risks. The management’s focus on technological innovation and market expansion strategies are crucial as they navigate both the opportunities and challenges ahead.
We suggest using the VantagePoint A.I. daily range forecast for short-term opportunities. Practice good money management on all your trades. $APP deserves to be on your radar because of its massive volatility.
Let’s be careful out there.
It’s not magic.
It’s machine learning.
Disclaimer: THERE IS A HIGH DEGREE OF RISK INVOLVED IN TRADING. IT IS NOT PRUDENT OR ADVISABLE TO MAKE TRADING DECISIONS THAT ARE BEYOND YOUR FINANCIAL MEANS OR INVOLVE TRADING CAPITAL THAT YOU ARE NOT WILLING AND CAPABLE OF LOSING.
VANTAGEPOINT’S MARKETING CAMPAIGNS, OF ANY KIND, DO NOT CONSTITUTE TRADING ADVICE OR AN ENDORSEMENT OR RECOMMENDATION BY VANTAGEPOINT AI OR ANY ASSOCIATED AFFILIATES OF ANY TRADING METHODS, PROGRAMS, SYSTEMS OR ROUTINES. VANTAGEPOINT’S PERSONNEL ARE NOT LICENSED BROKERS OR ADVISORS AND DO NOT OFFER TRADING ADVICE.

