This week’s ai stock spotlight is Agnico Eagle ($AEM)
Agnico Eagle Mines Limited, a distinguished name in the mining industry, has a rich history and a wealth of achievements that underline its leading position. Originally established as a small silver producer in Cobalt, Ontario, the company’s unique name, ‘Agnico’, is ingeniously derived from the chemical symbols for silver (Ag), nickel (Ni), and cobalt (Co). This nod to its origins underscores a heritage steeped in the exploration of these metals. Notably, Agnico Eagle distinguished itself as the first Canadian company to employ cyanide heap leach processes for gold extraction, setting a precedent in the industry for innovative mining techniques. Today, it operates the LaRonde mine in Quebec, renowned as the deepest base metal mine in the world, and the Meadowbank mine, one of the Arctic region’s most significant gold sites.
Agnico Eagle’s commitment to sustainability and community is evident in several key aspects of its operations. The company has maintained a pristine environmental record with no major spills, underscoring its dedication to sustainable mining practices — an effort that led to it being named the most sustainable mining company in Canada in 2019. It also boasts one of the industry’s lowest employee turnover rates, highlighting a positive and stable working environment. Further, Agnico Eagle is actively involved in community development projects wherever it operates, ensuring that its presence contributes positively to local areas. At its Goldex mine in Quebec, the company pushes the envelope on technological advancements, using the site to test cutting-edge mining technologies that could revolutionize the industry. Through these endeavors, Agnico Eagle not only leads in mining but also in corporate responsibility and innovation.
Agnico Eagle Mines Limited ($AEM), has been a prominent player in the production of precious metals since 1957 . With operations spread across Canada, Finland, and Mexico, and further exploration in the United States and Sweden, Agnico Eagle is renowned for its high-grade mineral reserves and stable production capabilities. The company’s financial health is robust, marked by consistent gold production and effective cost management strategies that shield profits despite the unpredictable swings in gold prices.
The firm ranks as one of the top gold producers globally, leveraging a substantial reserve base and low-cost production facilities. This position is bolstered by a reputation for operational excellence and a commitment to responsible mining practices, attributes that resonate strongly with environmentally conscious investors. Agnico Eagle’s growth trajectory is strategically set on expanding its existing mining operations and broadening its exploration and development projects. The company is also keen on enhancing its portfolio through mergers and acquisitions, a move well-timed with the rising global demand for gold and other precious metals.
However, the journey is not without its challenges. Agnico Eagle faces significant risks including regulatory changes specific to international mining operations, environmental hazards, and the unpredictable nature of exploration and mining activities. The volatility of gold prices adds another layer of financial uncertainty that could impact the company’s profitability. Despite these challenges, Agnico Eagle’s stock performance remains tightly intertwined with the fluctuating prices of gold, often gaining during periods of economic uncertainty when gold is viewed as a safe haven by investors.
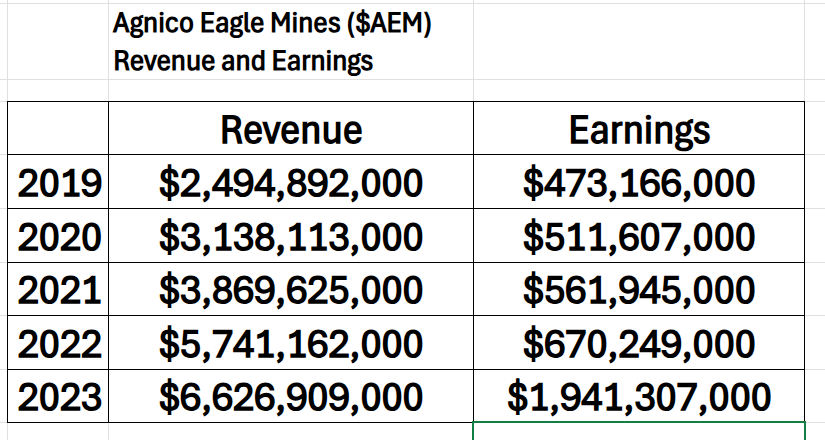
Over the last 5 years, $AEM has impressively grown revenues and earnings.
The company’s market valuation often reflects its strong capability to generate free cash flow, particularly in a stable gold price environment. Its price-to-earnings ratio generally runs higher than many of its peers, justified by its uninterrupted performance, superior asset quality, and efficient managerial practices. Under the leadership of CEO Ammar Al-Joundi, the company is celebrated for its seasoned management team and stringent corporate governance, which are pivotal in the highly scrutinized mining sector.
Commitment to sustainability forms a core part of Agnico Eagle’s operational ethos. The company is devoted to maintaining high environmental standards and actively engages with local communities to minimize its ecological footprint. These efforts are integral to its identity and strategic operations, aligning with its broader corporate social responsibility goals.
Agnico Eagle Mines Limited is a formidable player in the gold mining sector, offering stability and potential for growth. Its proactive approach to expanding production and adhering to stringent environmental and social governance practices positions it advantageously for future development, especially in the face of fluctuating gold prices. For investors seeking a reliable entity in the precious metals market, Agnico Eagle presents a compelling option, blending resilience with progressive mining solutions.
In this stock study we will look at the following metrics and indicators.
1) Wall Street Analysts’ Estimates
2) 52-week high and low boundaries
3) Vantagepoint A.I. Predictive Blue Line Analysis
4) The Best Case – Worst Case Scenarios
5) Neural Network Forecast
6) Daily Range Forecast
7) Intermarket Analysis
8) Our trading suggestion
We don’t base decisions on things like earnings or fundamental cash flow valuations. However, we do look at them to better understand the financial landscape that a company is operating under.
Wall Street Analysts Forecasts
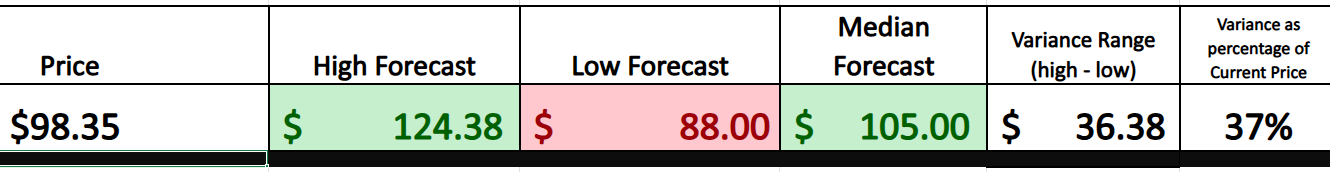
According to the issued ratings of 8 analysts in the last year, the average twelve-month price prediction for Agnico Eagle Mines is $105 with a high price target of $124.38 and a low price target of $88.00.
We always suggest traders pay very close attention to the variance between the most bullish and most bearish forecasts. This is the expected volatility of the asset moving forward. Currently this value, expressed as a percentage is 37% which is high. This tells us that the expectations are that $AEM in the next year could be trading 37% higher and or lower than current levels.
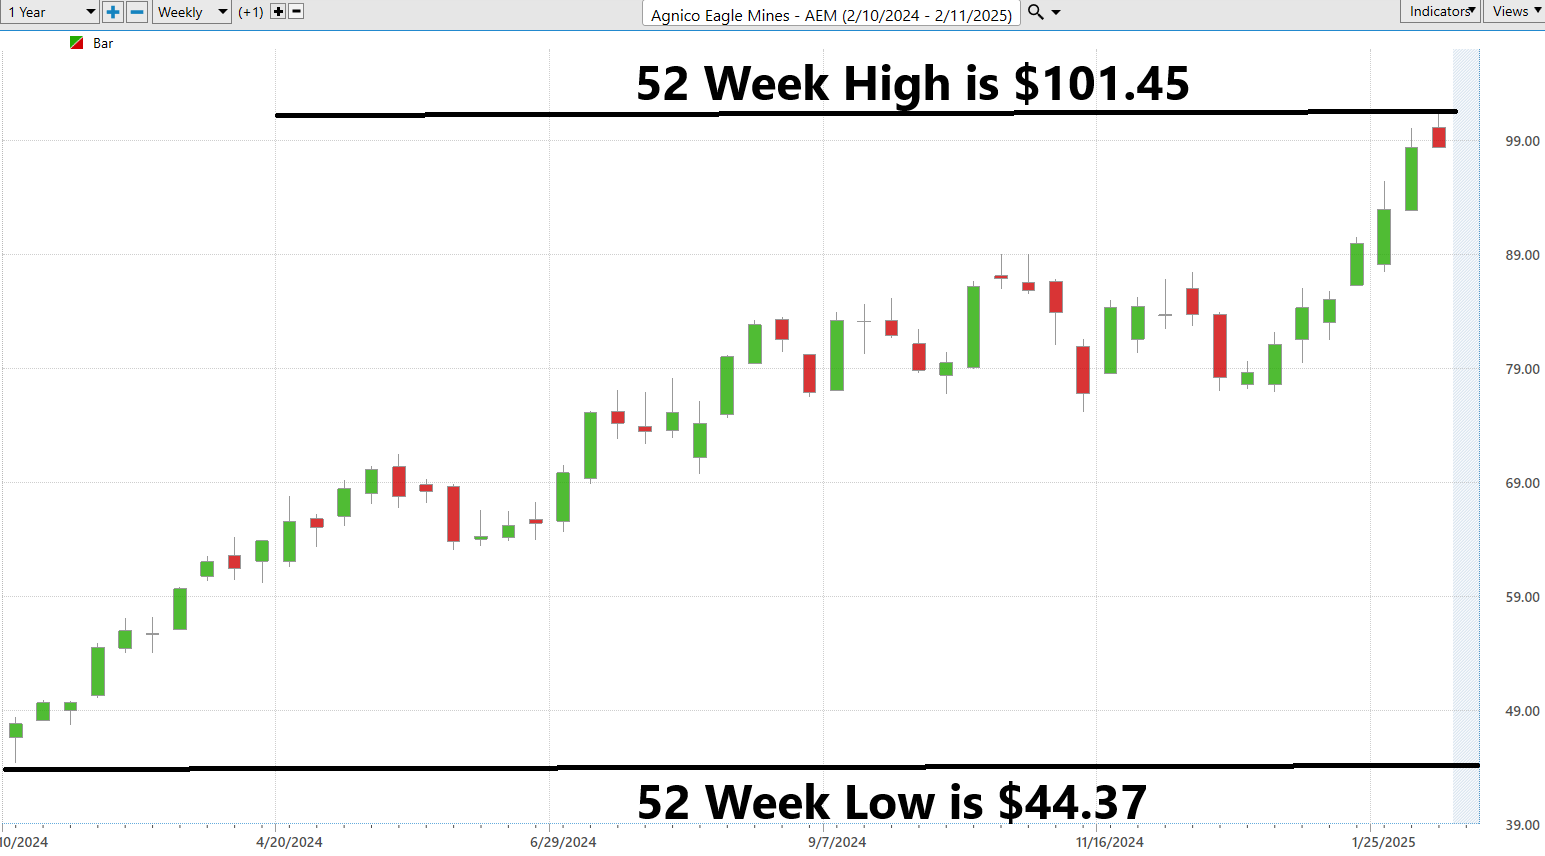
52 Week High and Low Boundaries
When it comes to navigating the stock market, one of the smartest moves a trader can make is to keep a close eye on a stock’s 52-week range. Think of it as a yearly report card that reveals how a stock has performed relative to the broader market’s ebb and flow.
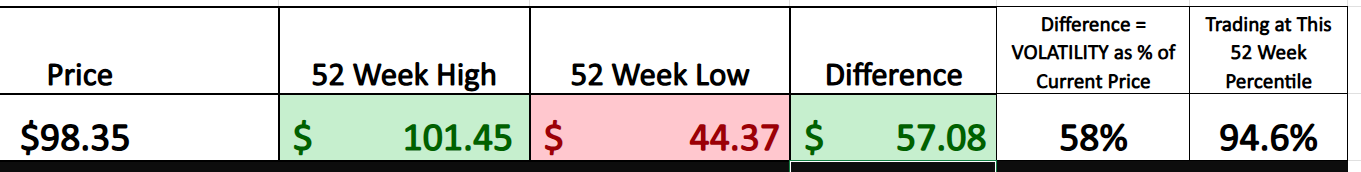
For Agnico Eagle Mines Limited ($AEM), the past year has shown a substantial trading spectrum, with the stock hitting a peak of $101.45 and dipping to a low of $43.37. This range not only highlights the volatility and the potential risk-reward scenario for the stock but also serves as a critical benchmark for assessing its current valuation against historical performance. Understanding these boundaries can provide traders with key insights into timing their trades, particularly in identifying potential entry and exit points.
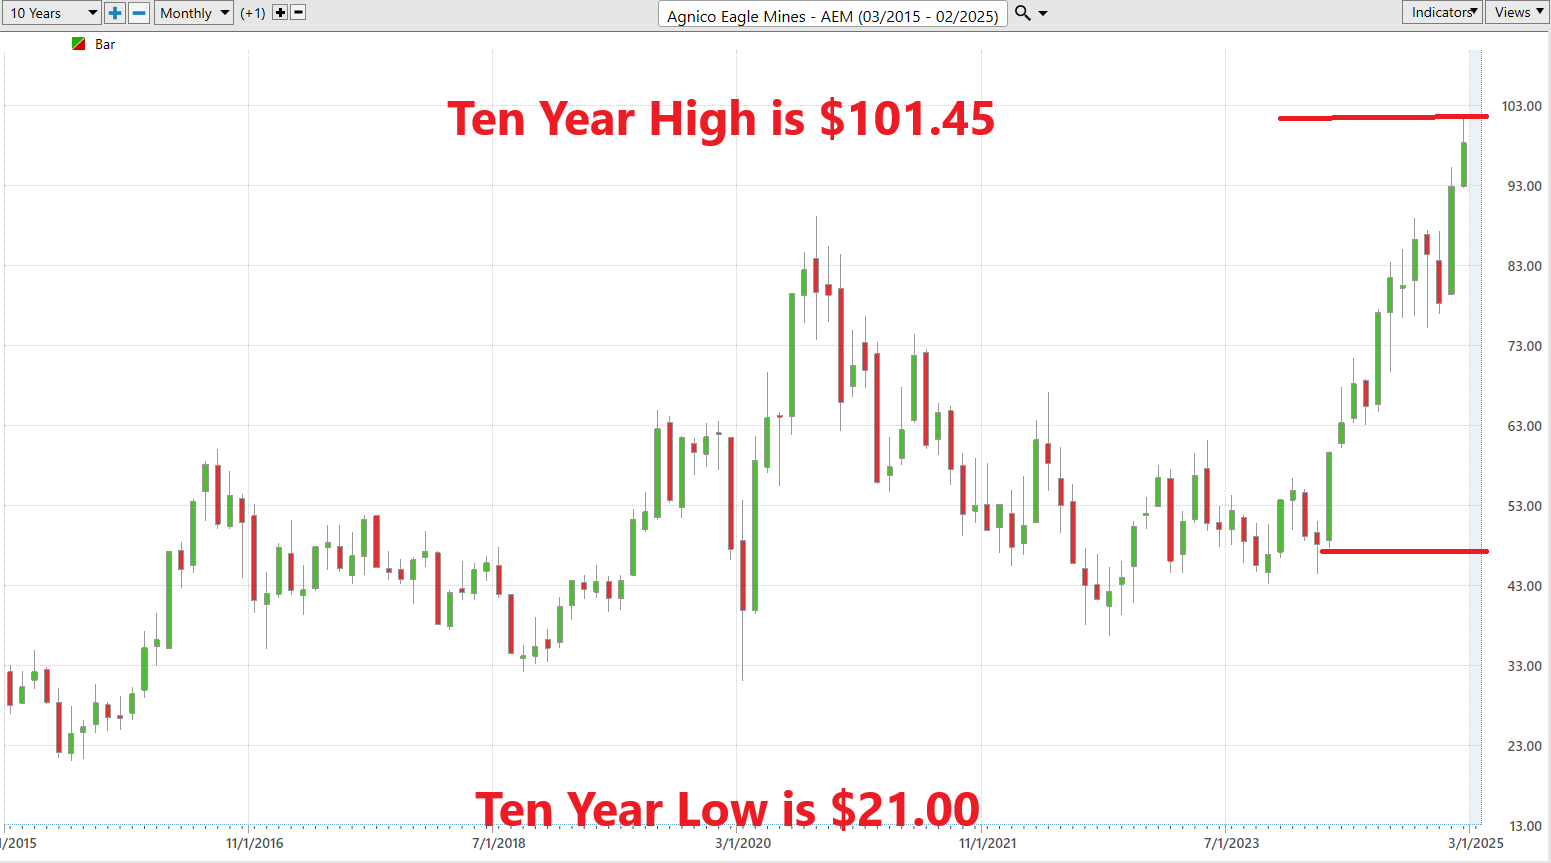
To truly grasp the long-term trajectory of a stock, stepping back to examine the 10-year chart is invaluable. This broader perspective offers a clear visual representation, placing the last 52 weeks in the context of the decade’s overall trend. By zooming out, traders can objectively assess how recent movements compare to longer-term patterns, enabling a deeper understanding of the stock’s historical performance and potential future direction. This approach not only helps in identifying enduring trends but also in spotting significant anomalies or shifts that could impact future trading decisions.
Best-Case/Worst-Case Analysis
Picture this: we’re mapping out the market’s peaks and troughs over the last year as if we’re charting the highs and perilous lows of the ocean during a tempest. This isn’t just analysis — it’s a survival strategy that helps us navigate volatility of financial markets with precision.
Why does this matter? Because this method allows us to see beyond the noise — to isolate the moments of sheer market euphoria as well as the times when the floor seems to drop out from underneath us. It’s not about guesswork; it’s about informed, strategic insights that reveal the true nature of market volatility.
This strategy is crucial. It doesn’t just help us guess; it helps us know. By understanding the highs and lows, we gain a comprehensive view of where a stock has been and, critically, where it could go. It’s this dual awareness of potential gains and inherent risks that equips us to make decisions that are both bold and calculated.
This isn’t about mere tactics; it’s about building a robust strategy that leverages knowledge of market dynamics to drive smart, effective investment decisions.
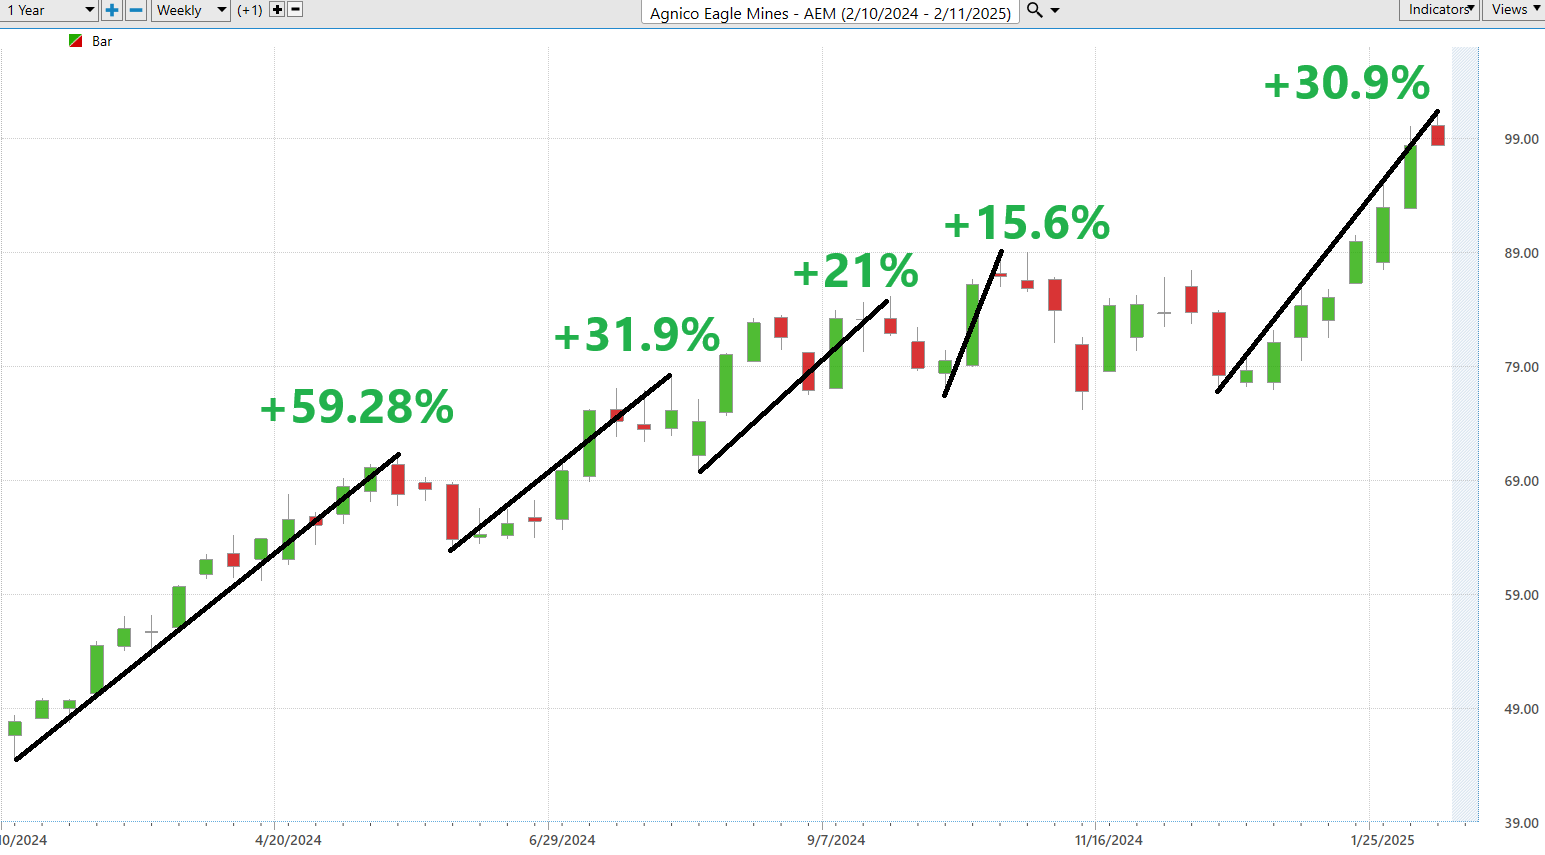
So, let’s apply this analytical lens to Agnico Eagle Mines ($AEM), starting with a look at the best-case and then the worst-case scenarios from the past year. This analysis will help us uncover the potential rewards and risks associated with $AEM, setting the stage for informed and strategic plays in your investment journey. Let’s get down to business and decode these patterns together.
Here is the best-case scenario:
Followed by the worst-case scenario:
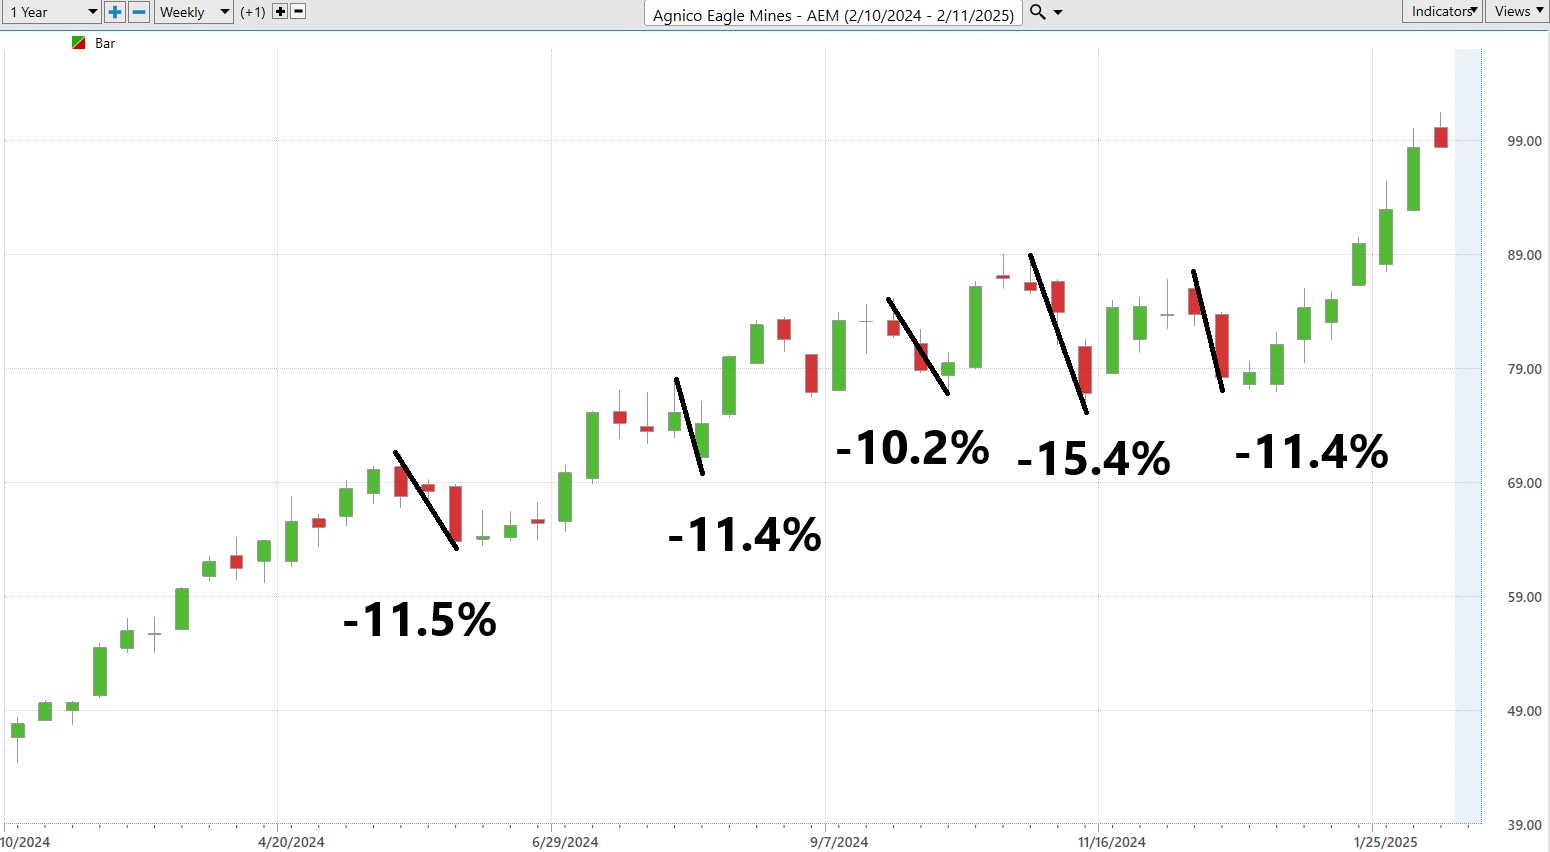
From these two simple charts you can quickly see the strength of the rallies versus the weakness of the declines. Should the following year be anything like last year, this information can prove to be extremely valuable.
Next, we want to compare the performance of $AEM to the broader stock market indexes. This allows us to see how the stock performed across multiple time frames.
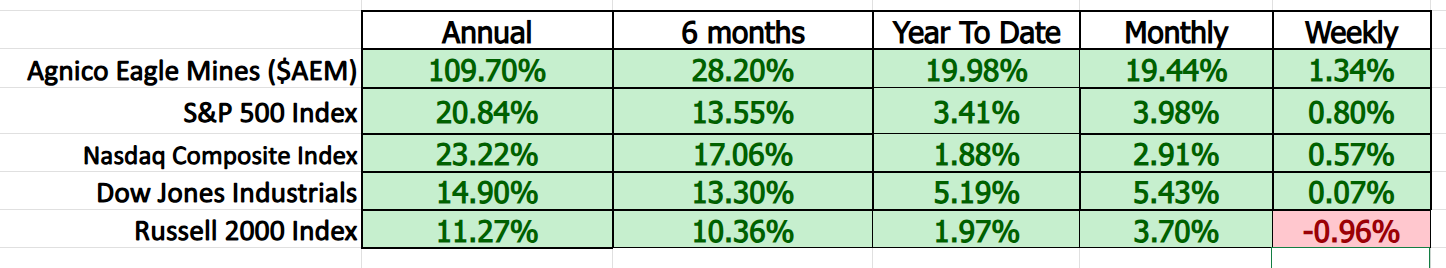
$AEM has clearly outperformed.
However, the beta of Agnico Eagle Mines Limited ($AEM) is 1.08. This figure represents the stock’s volatility in relation to the market, where a beta of 1.08 suggests that $AEM’s price movements are historically 8% more volatile than the market average. Its recent performance is quite impressive.
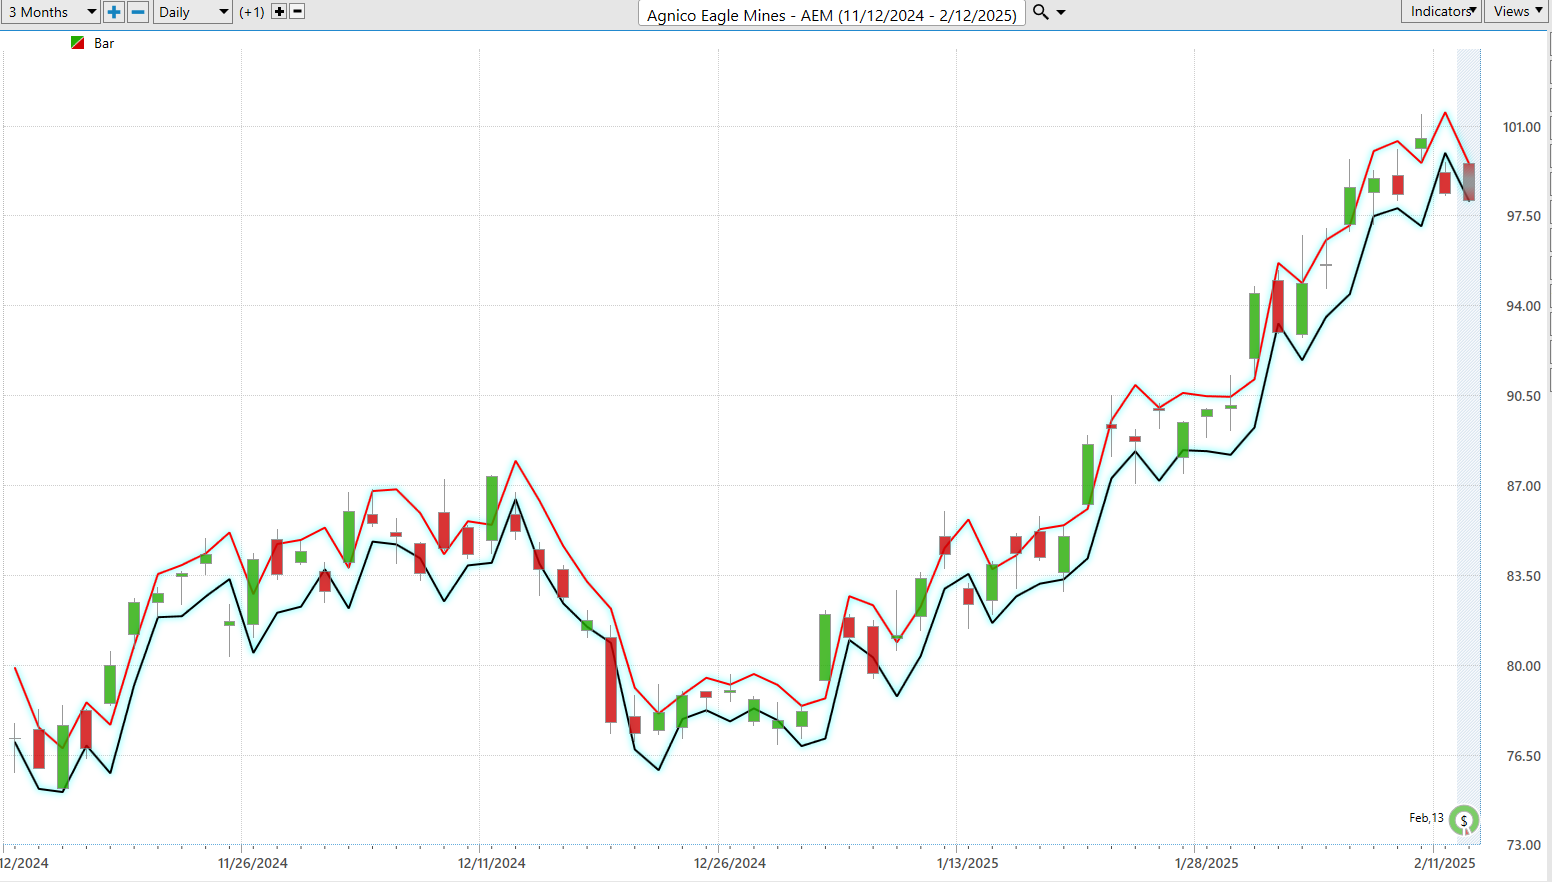
Vantagepoint A.I. Predictive Blue Line
Our core trading principles are straightforward yet profoundly impactful, particularly in navigating the complexities of $AEM’s trajectory:
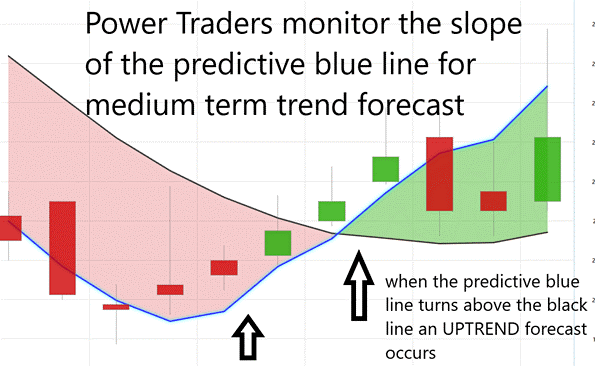
- The direction and slope of the predictive blue line are pivotal, dictating not just the trend but the overarching direction of $AEM. This line is our compass in the often turbulent sea of market fluctuations.
- The concept of the “VALUE ZONE” is crucial. It’s about identifying optimal buying opportunities at or below this predictive blue line during upward trends and selling opportunities above it when the trend reverses downward.
- As the predictive blue line trends downward, a clear signal emerges: anticipate lower prices. Traders might then choose to step back, observing from the sidelines, or proactively hedge their positions to mitigate potential losses.
Thanks to the sophisticated algorithms of VantagePoint Software and its artificial intelligence capabilities, traders receive timely and precise trend forecasts by monitoring these critical slopes.
In the financial markets, the predictive blue line emerges not just as a tool, but as a beacon guiding investors. For those tracking stocks like $AEM, this isn’t merely another metric — it’s an essential forecasting instrument that illuminates the path forward, clarifying market direction and potential strategies.
The predictive blue line stands as a testament to the zenith of VantagePoint’s A.I. technology, masterfully blending neural networks with exhaustive intermarket analysis. This sophisticated tool delves deep into the core structure of market movements, dissecting the intricacies of what drives prices and uncovering hidden layers of value. It’s not just about observing trends — it’s about understanding the underlying forces at play, providing traders with a decisive edge in a competitive landscape.
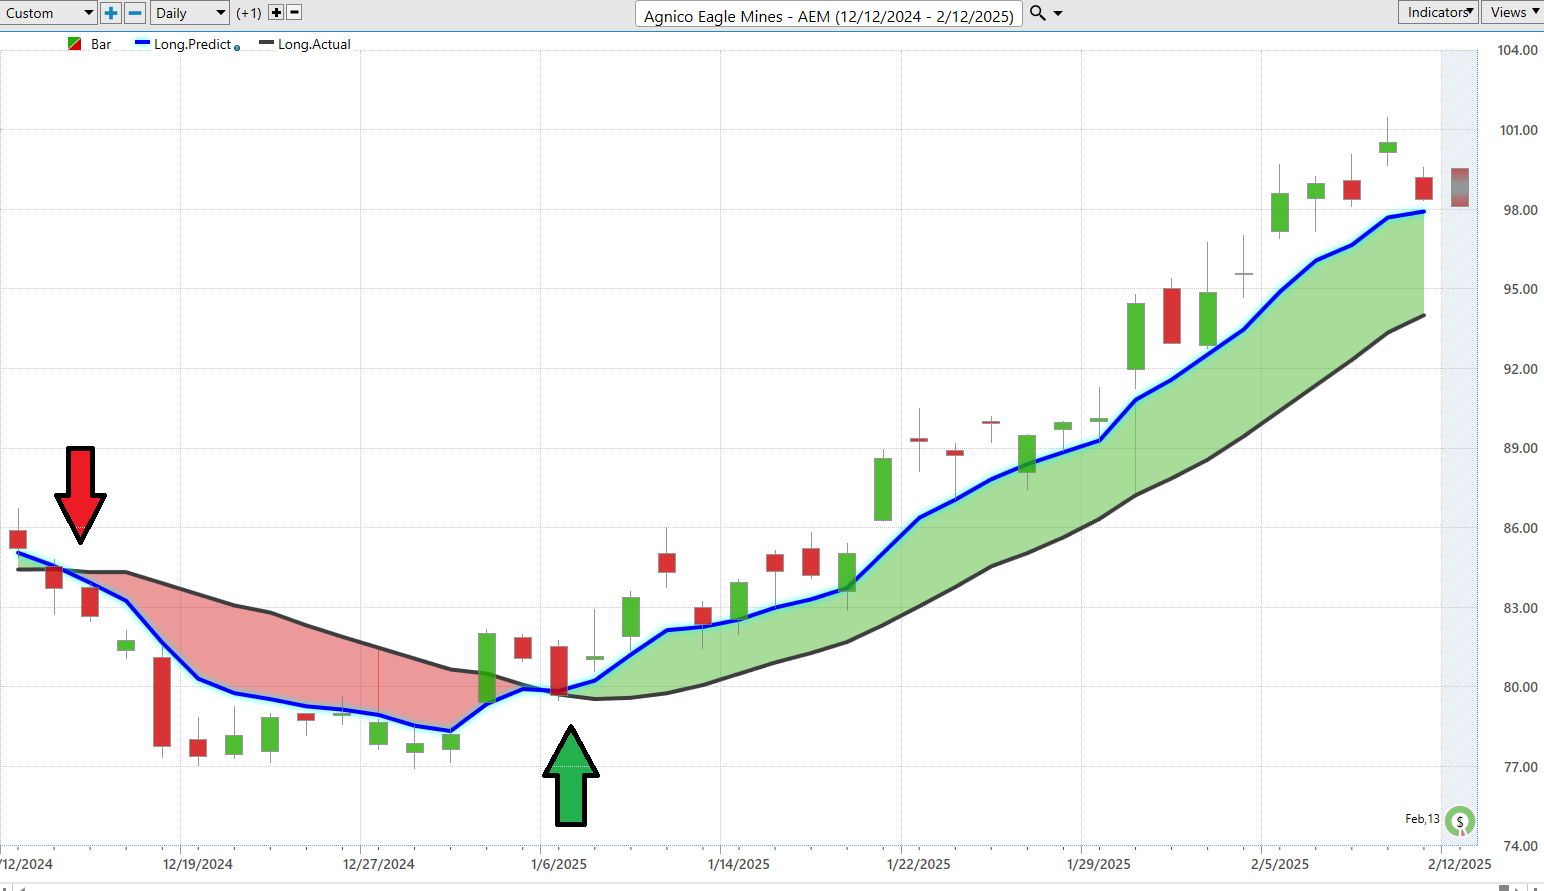
You can see the UP forecast was generated on January 6 th at a price of $79.47. The price has rallied in excess of 27% since then.
Neural Network Forecast (Machine Learning)
Imagine a tool that predicts the stock market almost like a weather forecast tells us if it’s going to rain or shine. This tool sits at the bottom of a chart and uses colors to show what’s happening: green means things are looking good and strong, and red means there’s a warning sign, something might not be right.
This tool is called a neural network, and it’s pretty amazing. It’s like having a tiny part of a human brain, but it’s made from computer parts and lives in the digital world. This network looks at tons of information about the stock market and learns from it, just like you learn from reading books or listening in class.
Neural networks are super smart because they keep learning. They get better and better at figuring out patterns in the stock market data—things that even the smartest people might not notice. This means they can predict what’s going to happen in the market before it actually happens, which is really helpful for people who are trying to decide when to buy or sell stocks.
Think of neural networks as your secret tool in a video game. They help you see things that are hidden and make smart moves based on what they learn. They’re always learning from new data, so they keep getting better, helping traders make really informed decisions.
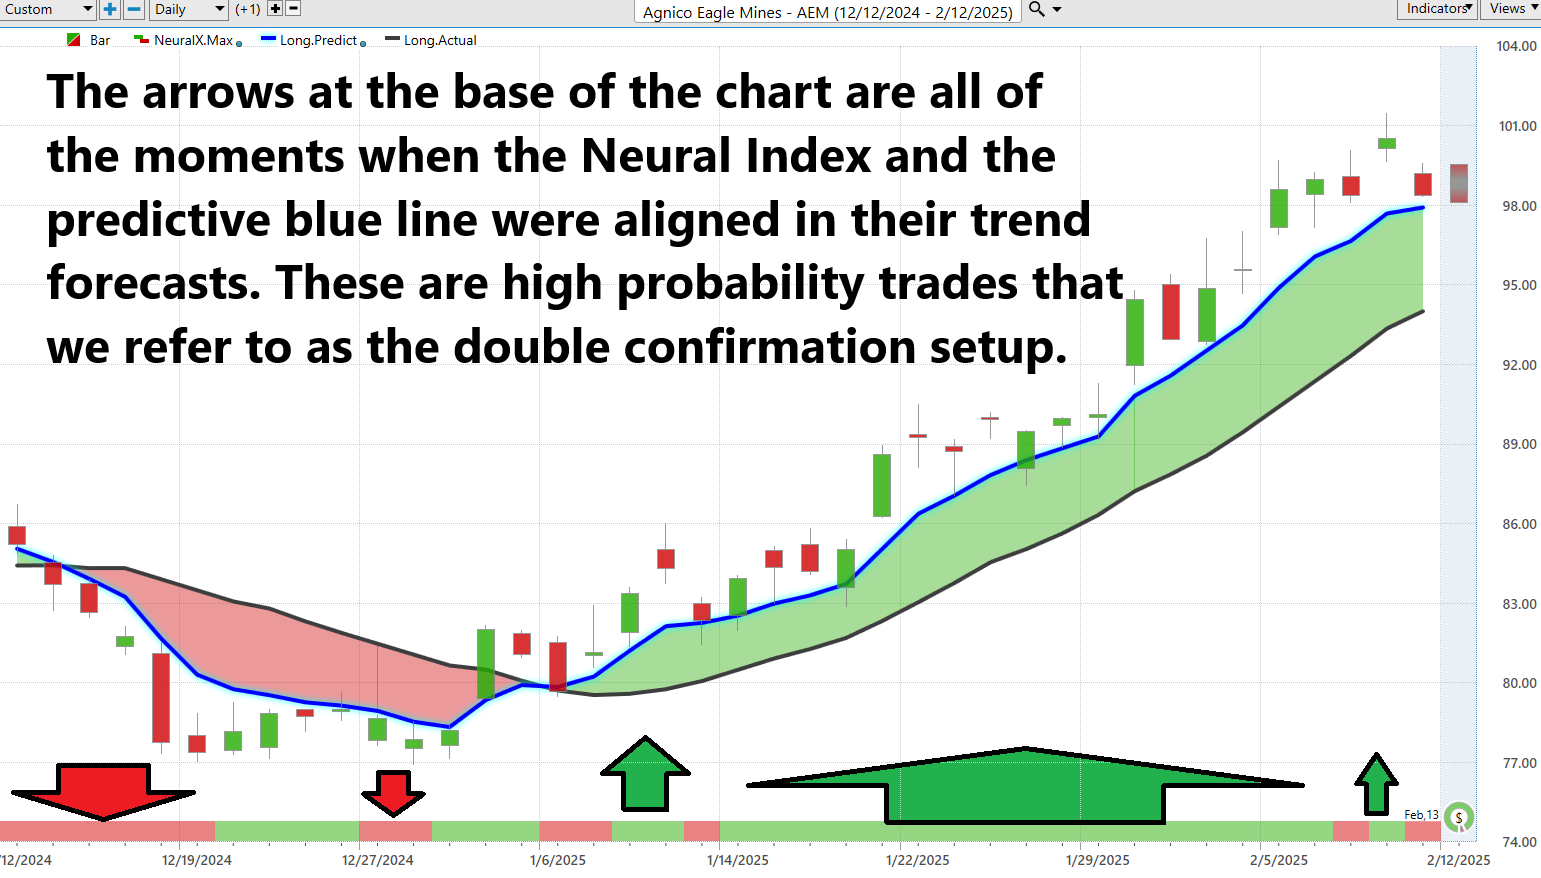
In today’s digital frontier, the neural index chart of $AEM transcends traditional analysis; it tells a story of how technology masterfully reduces uncertainty in the financial markets. The Neural Network Indicator, in concert with the predictive blue line, offers a strategic advantage to our Power Traders. It delineates those critical moments of ‘double confirmation,’ where precision and opportunity intersect amid the fluid dynamics of market movements.
This isn’t merely about following trends; it’s about leveraging cutting-edge A.I. to forge a path through the complex terrain of stock trading. Each signal, each line drawn on this chart, is a calculated step towards making informed, confident trading decisions in a landscape where accuracy is paramount.
For those ready to harness the full potential of this technological prowess, the neural index and predictive blue line are indispensable tools. They don’t just guide; they empower traders to seize opportunities with clarity that only this level of sophisticated analysis can provide. Let’s dive deep and decode the market’s signals together, turning insights into action with unmatched precision.
VantagePoint A.I. Daily Range Forecast
In the high-stakes arena of trading, where every second can mean the difference between raking in profits or suffering losses, traders are arming themselves with some of the most powerful tools in the digital domain: Artificial Intelligence (A.I.), machine learning, and neural networks. Imagine this: these tools aren’t just additions to the trader’s toolkit; they are the secret weapons, slicing through vast amounts of historical market data to uncover the patterns, trends, and the elusive connections that dictate market movements.
With the sharp pattern-recognition capabilities of machine learning and the forward-looking insights provided by neural networks, traders can now look beyond the immediate horizon. They’re predicting future market shifts with a level of precision that was once thought to be the stuff of fantasy. This is not just trading; this is trading transformed by technology, where clarity, foresight, and acumen converge to create unparalleled opportunities.
First let’s look at the average trading ranges for $AEM on the daily, weekly and monthly time frames over the past year.
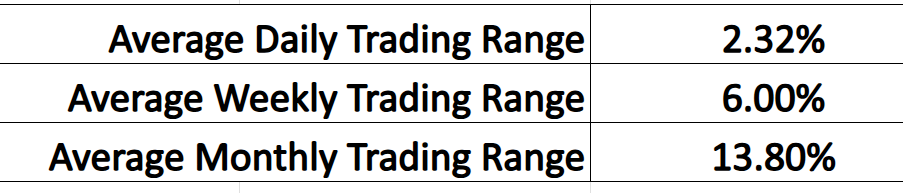
These ranges give you an idea of how volatile the stock is on a daily, weekly and monthly basis. However, what all traders need is how to implement this information.
The VantagePoint A.I. Software Daily Range Forecast solves this issue with exciting precision. Every day it provides a trading forecast so that traders can anticipate these market moves before they happen.
Observe how clearly these forecasts are delineated.
In the high-octane world of trading, AI-driven tools aren’t just changing the game; they’re completely rewriting the rules, giving traders the edge they need to succeed in the ever-shifting mosaic of the financial markets. This is about having the foresight to peer beyond the here and now, to unearth opportunities hidden in the torrents of data, and to execute decisions with pinpoint accuracy and unwavering confidence. These tools don’t just assist; they empower traders to navigate the market with a visionary’s eye, transforming raw data into strategic gold.
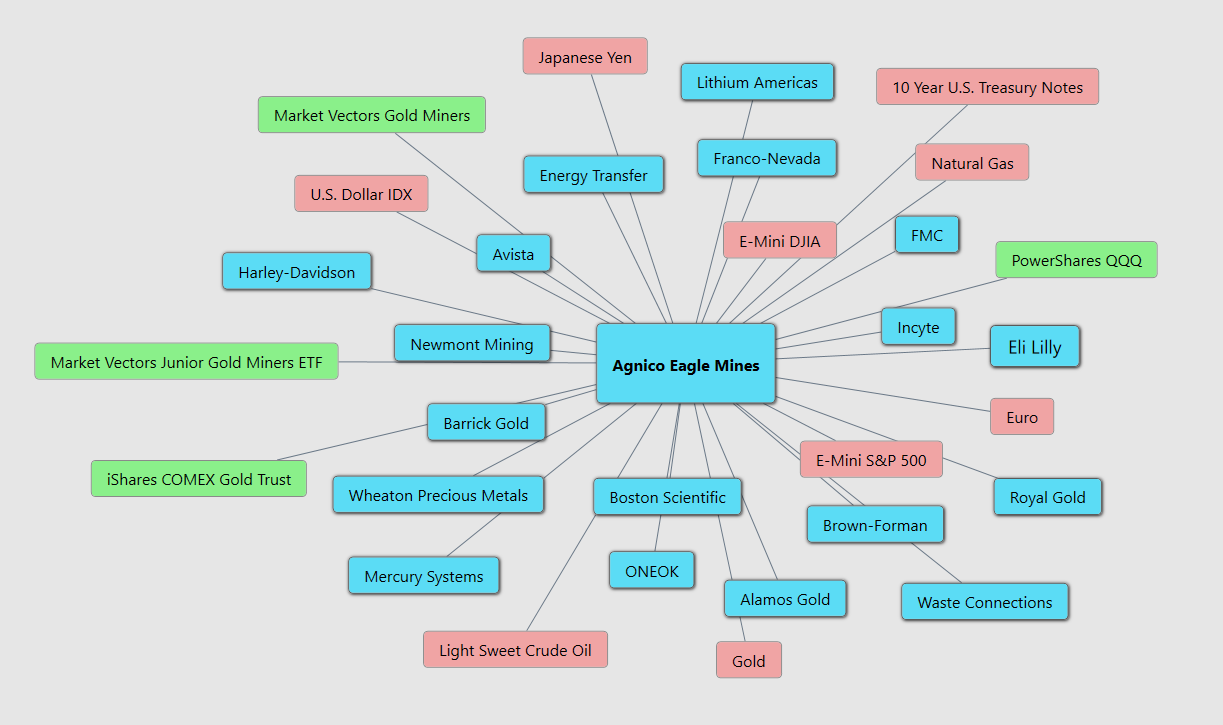
Intermarket Analysis
Intermarket analysis is like being a detective who looks at how different clues are connected. Imagine you have a puzzle with four main pieces: stocks (like pieces of a company you can buy), bonds (money you lend to get back with interest), commodities (stuff like oil, gold, or food), and currencies (money from different countries). By looking at how each piece moves or changes, you can guess what might happen to the other pieces. For example, if the price of oil goes up, it might affect stocks of companies that use a lot of oil, or the value of money in countries that sell a lot of oil.
Now, let’s talk about $AEM. They mostly dig up gold. Using intermarket analysis, we can think about what might change the price of gold and then guess how $AEM’s stock price might move:
- Commodity Prices : Since $AEM mines gold, the price of gold is a big deal. If gold prices go up, people might think $AEM will make more money, and its stock price could go up.
- Currency Values : Gold is priced in U.S. dollars, so if the dollar gets stronger, it might make gold cheaper for people with other currencies, which could lower gold prices. This would affect $AEM because their gold would sell for less.
- Interest Rates and Bonds : When interest rates are low, bonds don’t pay much, so people might buy gold instead, which can drive up gold prices and help $AEM.
- Economic Indicators : If the economy looks strong, people might feel safer investing in stocks, but if there are worries about the economy, they might buy gold to feel safer. This can also make gold prices go up, helping $AEM.
So, by using intermarket analysis, we can see how different things like the economy, the value of money, and interest rates can help us guess what might happen with the price of $AEM’s stock.
Here are the 32 key drivers of price for $AEM using VantagePoint A.I. Intermarket Analysis. Studying these relationsips and other assets will qalso assist in finding other true gems.
Our Suggestion
The next earnings call for Agnico Eagle Mines Limited ($AEM) is scheduled for February 13, 2025. The expectations are set for a robust performance. Analysts are projecting earnings per share (EPS) of $1.17, indicating a strong quarter ahead. This estimate reflects a significant year-over-year increase, underpinned by favorable gold price trends and efficient operational management which are expected to continue driving Agnico Eagle’s financial success. These projections suggest that the company will maintain its trajectory of delivering solid financial results, capitalizing on both the favorable market conditions and its strategic initiatives.
In their Q3 2024 earnings call, Agnico Eagle strutted out some impressive numbers. They reported record-breaking financial results for the fourth straight quarter. This isn’t just good; it’s historic. They chalked up an adjusted net income that made earlier figures look like chump change, boosted majorly by soaring gold prices and sales volumes. The cash was flowing, with operating activities pulling in over a billion dollars! And guess what? They’re sharing the wealth, returning about $700 million to shareholders through dividends and buybacks, all while slashing their net debt like they’re wielding a financial machete. On top of that, they’re keeping production costs snugly below their forecasted midpoints — talk about efficiency!
Now, flipping back to Q2 2024, the story was just as shiny. They were crushing it with production targets and keeping those costs under wraps. The best part? They were already doling out cash to the tune of hundreds of millions to their shareholders and knocking down their debt like a pro demolition crew. All this while the cash register kept ringing louder with each passing quarter.
So, if you’re hitching your wagon to $AEM’s star, these earnings calls are like finding the map to the treasure. The company’s not just surviving; they’re thriving, navigating the market with the precision of a seasoned captain in gold-laden waters. Keep your eyes peeled on this one; it’s showing no signs of slowing down!
With Gold and $AEM both hitting all-time highs we see no reason why this trend will be slowing down. Use the daily range forecast for positioning opportunities. Practice good money management on all your trades.
Let’s Be Careful Out There.
It’s Not Magic.
It’s Machine Learning.
Disclaimer: THERE IS A HIGH DEGREE OF RISK INVOLVED IN TRADING. IT IS NOT PRUDENT OR ADVISABLE TO MAKE TRADING DECISIONS THAT ARE BEYOND YOUR FINANCIAL MEANS OR INVOLVE TRADING CAPITAL THAT YOU ARE NOT WILLING AND CAPABLE OF LOSING.
VANTAGEPOINT’S MARKETING CAMPAIGNS, OF ANY KIND, DO NOT CONSTITUTE TRADING ADVICE OR AN ENDORSEMENT OR RECOMMENDATION BY VANTAGEPOINT AI OR ANY ASSOCIATED AFFILIATES OF ANY TRADING METHODS, PROGRAMS, SYSTEMS OR ROUTINES. VANTAGEPOINT’S PERSONNEL ARE NOT LICENSED BROKERS OR ADVISORS AND DO NOT OFFER TRADING ADVICE.