- US Core PCE y/y unchanged at 2.6%, missing estimates of 2.5%.
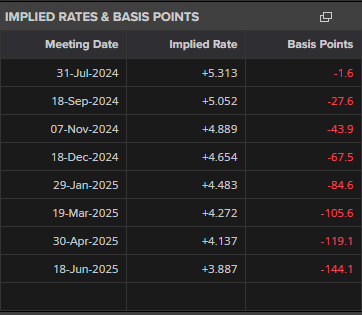
- Interest rate probabilities are unmoved with a September cut fully priced in.
The US Core PCE inflation gauge y/y was unchanged at 2.6% in June but missed market expectations of 2.5%. The PCE price index fell to 2.5% from 2.6% in May, while personal income m/m fell by more than expected to 0.2%.

Today’s release gives traders little new to work with and leaves the US dollar apathetic going into the weekend. Financial markets continue to fully price in a 25 basis point interest rate cut at the September 18 FOMC meeting, with a second cut seen in November. A third-quarter point cut at the December 18 meeting remains a strong possibility.

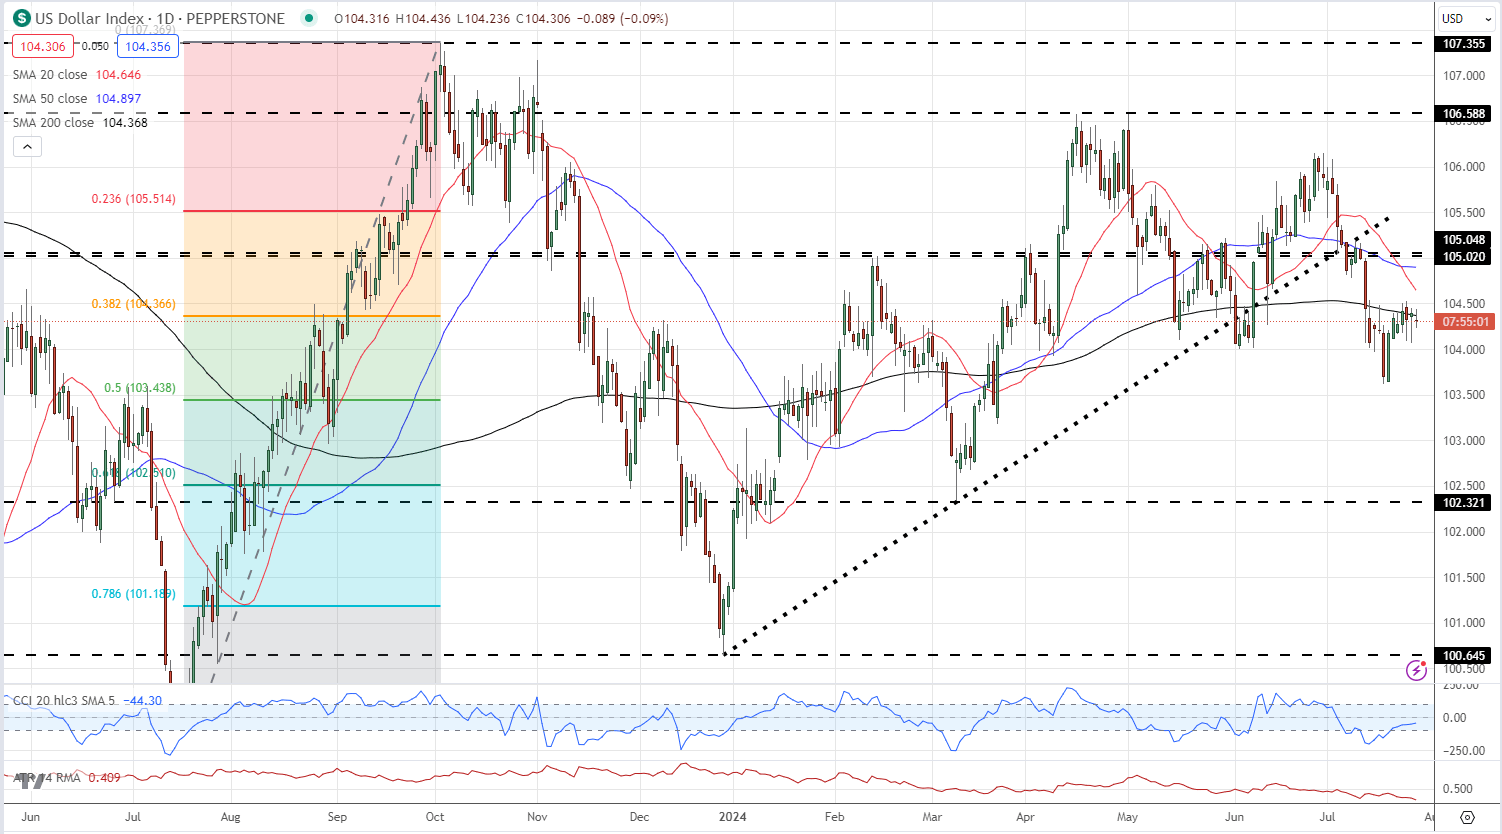
US dollar traders will now look ahead to next week’s FOMC meeting to see if chair Powell gives any further guidance about upcoming rate cuts. The US dollar index (DXY) is trading on either side of the 38.2% Fibonacci retracement level at 104.37, and the 200-day simple moving average, and will need a new driver to force a move ahead of next Wednesday’s Fed meeting.
US Dollar Index Daily Chart

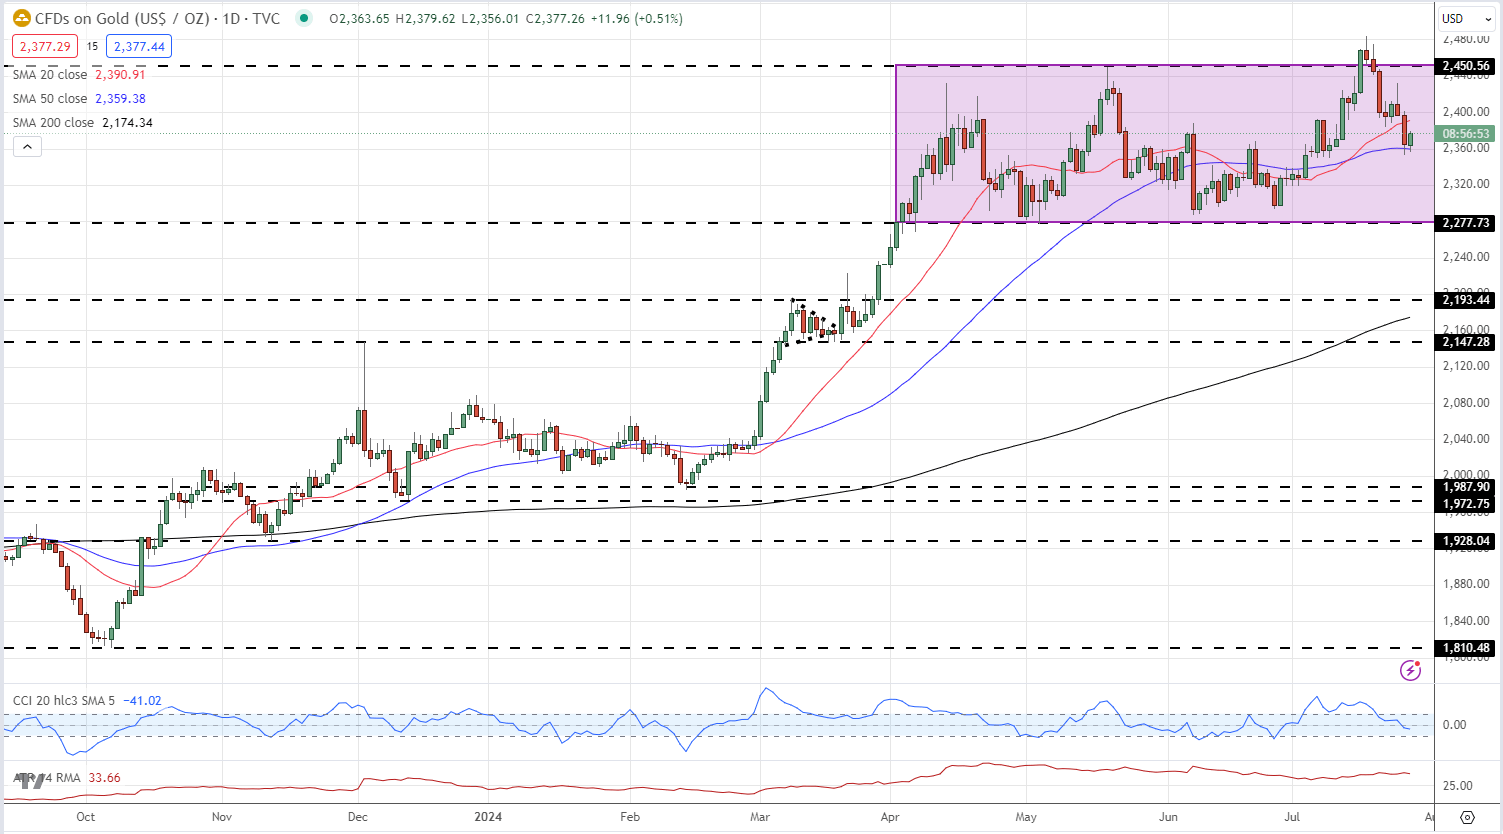
The price of gold nudged around $5/oz. higher after the inflation report and remains stuck in a multi-month range. The precious metal briefly broke resistance two weeks ago but quickly slipped back into a range that started in early April.
Gold Price Daily Chart

Retail trader data shows 61.36% of traders are net-long with the ratio of traders long to short at 1.59 to 1.The number of traders net-long is 11.61% higher than yesterday and 16.13% higher than last week, while the number of traders net-short is 8.68% lower than yesterday and 20.13% lower than last week.
We typically take a contrarian view to crowd sentiment, and the fact traders are net-long suggests Gold prices may continue to fall. Traders are further net-long than yesterday and last week, and the combination of current sentiment and recent changes gives us a stronger Gold-bearish contrarian trading bias.

