GBP/USD Q3 Technical Outlook: Bullish Headwinds Accumulate for Cable in the Third Quarter
GBP/USD has exhibited significant volatility in the second quarter, yet it is concluding June near its April 1st opening level. Sterling experienced appreciation against various currencies in late April, but this momentum has subsided as the UK election approaches. Over the past month, the US dollar has been a key driver of GBP / USD movement, with the Federal Reserve maintaining interest rates due to persistent inflation . Given the expectation that the UK will implement interest rate cuts before the US, coupled with uncertainty surrounding the upcoming UK election, GBP/USD is likely to face challenges in moving higher over the next three months.
The second quarter’s trading range of 1.2300-1.2863 is set to hold in the third quarter with the pair likely testing the lower half of the range. Looking at the weekly chart, the 200-dsma and the 23.6% Fibonacci retracement are guarding 1.2863, while the 38.2% Fibonacci retracement level and the 20-dsma are currently being tested by sellers. GBP/USD looks likely to test lower levels in the coming weeks but should still respecting support at 1.2300.
GBP/USD Weekly Price Chart

Source: TradingView
After acquiring a thorough understanding of the technicals impacting GBP in Q3, why not see what the fundamental outlook suggests by downloading the full Pound Sterling forecast for the third quarter?
EUR/GBP Q3 Technical Outlook: Euro to Outpace GBP in the Race to the Bottom
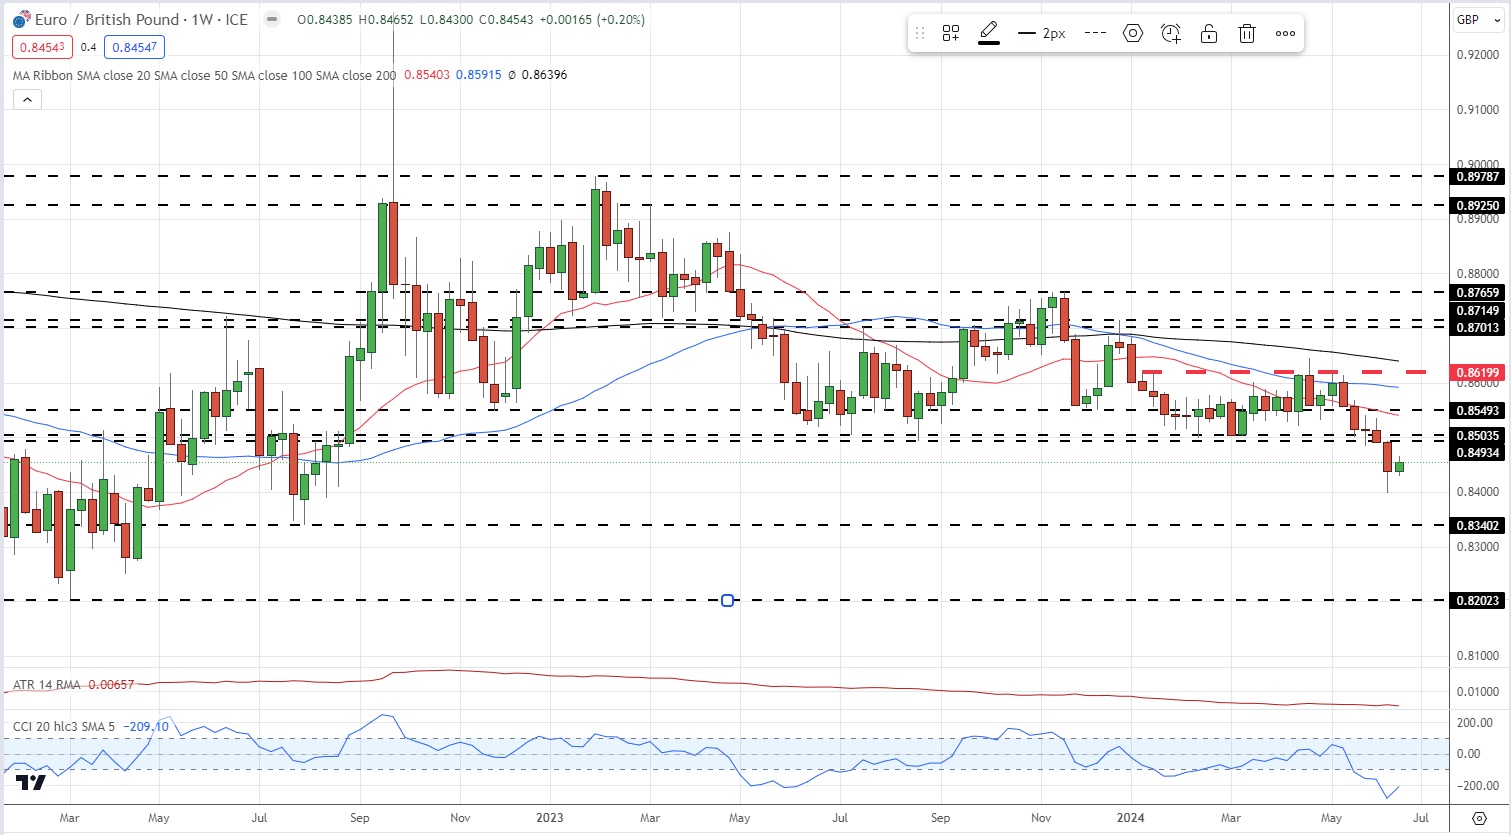
EUR/GBP is projected to depreciate over the quarter, primarily due to ongoing Euro weakness. The European Central Bank (ECB) has already initiated interest rate reductions and is expected to implement one or two additional cuts this year. Furthermore, the impending French election could potentially result in a significant shift in the country's political landscape. Given that financial markets typically respond negatively to uncertainty, these factors are likely to exert downward pressure on the Euro in the coming quarter.
EUR/GBP recently mad a near two-year low around 0.8400 and this is likely to be tested again. The late-July/early-August 2022 double low around 0.8340 is the next level of support and again this looks likely to be tested in the third quarter. Below here the March 2022 low at 0.8203 comes into play. The CCI indicator shows the pair heavily oversold, so a period of consolidation is likely. EUR/GBP is likely to establish a new trading range with 0.8340 acting as initial support, while it is unlikely that the pair will trade above 0.8650 in the third quarter.
EUR/GBP Weekly Price Chart

Source: TradingView
Discover the power of crowd mentality. Download our free sentiment guide to decipher how shifts in EUR/GBPs positioning can act as key indicators for upcoming price movements.
| Change in | Longs | Shorts | OI |
| Daily | -4% | 6% | -1% |
| Weekly | -11% | 25% | -1% |

