Japanese Yen (USD/JPY) Analysis
- BoJ discussed the weaker yen and timely hike but the committee strikes slightly hawkish tone
- USD/JPY comes perilously close to the significant 160 mark
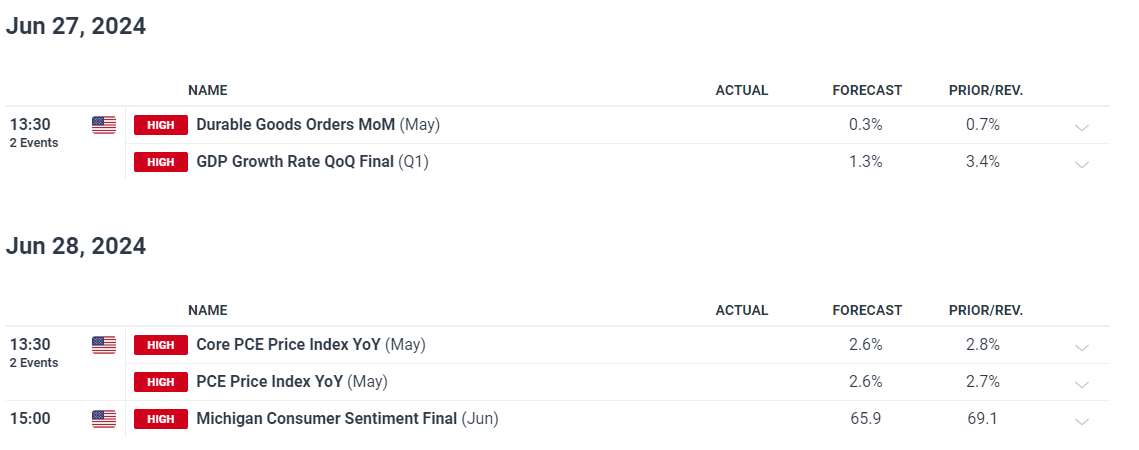
- Major risk events for the week: US PCE
- The analysis in this article makes use of chart patterns and key support and resistance levels. For more information visit our comprehensive education library
BoJ Discussed the Weaker Yen and Timely Hike but the Committee Strikes a Slightly Hawkish Tone
In the early hours of Monday morning the minutes of the June BoJ meeting were released. Two members appeared in favour of a rate hike in a timely manner with one member mentioning, ‘must raise interest rate in timely fashion without delay in accordance to heightening chance of achieving price target’. The other pointed to the continued yen weakness stating, ‘weak yen could lead to overshoot in inflation, which means appropriate level of policy rate would be pushed up’.
However, there was a balance with other members weighing in to highlight sub-optimal consumption levels and the need to wait for incoming data before jumping to the conclusion that inflation is on a definite uptrend.
A simple index of Japanese yen performance points to a continued decline as the currency approaches a very dangerous level seen in USD /JPY.
Japanese Yen Index (equal weighting of USD/JPY, GBP/JPY , AUD/JPY , EUR/JPY )

Source: TradingView, prepared by Richard Snow
USD/JPY Comes Perilously Close to the Significant 160 Mark
USD/JPY rose in the early hours of Monday morning, falling just shy of the 160 market which is largely seen as a tripwire for FX intervention. At the end of April, Japanese officials spent $62 billion in a massive effort to strengthen the yen and reduce the level of undesirable volatility.
Moves above 160.00 may be short-lived. The pair is fraught with risk given how FX intervention typically results in excessive volatility as the pair has previously moved about 500 pips in a day. A natural level of support appears at 155.00 with dynamic support at the 50 day simple moving average appearing before it, around 156.20.
USD/JPY Daily Chart

Source: TradingView, prepared by Richard Snow
Learn the ins and outs of trading USD/JPY - a pair crucial to international trade and a well-known facilitator of the carry trade
Major Risk Events for the Week Ahead
This week sees notably fewer high impact economic data. There will be final Q1 GDP estimates for the UK and the US with the main event being US PCE inflation data.

Dreamboot Wealth Institute

