USD/JPY Analysis and Charts
Japanese Yen Prices , Charts, and Analysis
- The Bank of Japan may announce that it is cutting back its bond purchases.
- USD/JPY traders will also need to follow US data and Wednesday’s FOMC meeting.
With the USD /JPY exchange rate approaching levels that could cause concern for Japanese authorities, there is speculation over whether the Bank of Japan (BoJ) will signal its intention to reduce its asset holdings during the upcoming monetary policy meeting on Friday. Market expectations have been building that the Japanese central bank will begin trimming its monthly bond purchases. While the BoJ has no specific target, the central bank roughly purchases around Yen 6 trillion a month of Japanese Government Bonds (JGBs), in an effort to keep rates low. If the BoJ announces that it will pare back these purchases, a pivot towards quantitative tightening, the Japanese Yen should appreciate across the FX market.
For all market-moving global economic data releases and events, see the Dreamboot Wealth Institute
Japanese interest rate hike expectations have been growing over the past few weeks with the first 10 basis point move now fully priced in at the September meeting, although the end-of-July meeting remains a strong possibility. Markets are forecasting just over 24 basis points of rate hikes this year.

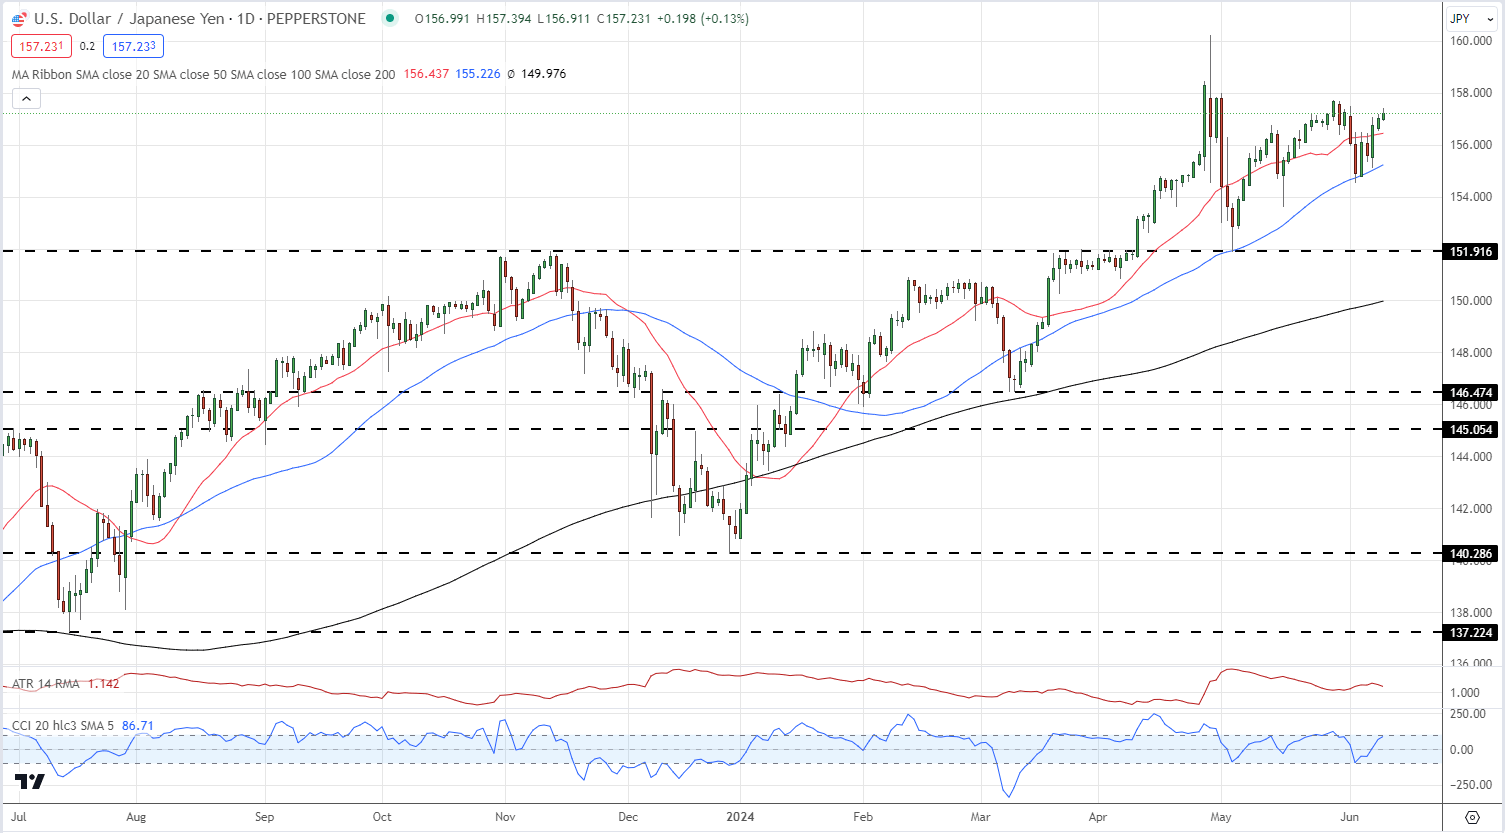
USD/JPY is currently within half a point of trading at highs last seen at the start of May. The pair have been moving higher on a combination of longer-term Yen weakness and recent US dollar strength. Wednesday sees the release of US consumer price inflation data and the latest Federal Reserve monetary policy decision, both events that can move the value of the US dollar. The FOMC decision will also be accompanied by the latest Summary of Economic Projections, including the closely followed dot plot – a visualization of Fed official's projections for US interest rates at the end of each calendar year. The current dot plot shows that two officials expect rates to be unchanged during this year, two looking for one 25 basis point cut, five looking for two cuts, while nine members see three cuts in 2024. The new makeup of this dot plot is likely to see rate-cut expectations for 2024 pared back.

USD/JPY is back within half a point of highs last seen at the start of May, driven by ongoing Yen weakness and a recent bout of US dollar strength. The chart remains bullish with the pair trading above all three simple moving averages while an unbroken series of higher lows remains in place. While the chart remains technically bullish, as has been the case for the past few months, fundamentals will hold the key to the next move.
USD/JPY Daily Price Chart

Retail trader data show 24.88% of traders are net-long with the ratio of traders short to long at 3.02 to 1.The number of traders net-long is 0.15% higher than yesterday and 16.82% lower than last week, while the number of traders net-short is 4.62% higher than yesterday and 5.17% higher than last week.
We typically take a contrarian view to crowd sentiment, and the fact traders are net-short suggests USD/JPY prices may continue to rise.
Harness the power of collective market psychology. Gain access to our free sentiment guide, which reveals how shifts in USD/JPY positioning may act as leading indicators for upcoming price action.
| Change in | Longs | Shorts | OI |
| Daily | -4% | -5% | -5% |
| Weekly | -13% | 4% | -1% |

