Most Read: British Pound Weekly Forecast: Ranges Likely To Hold As Focus Moves To ECB
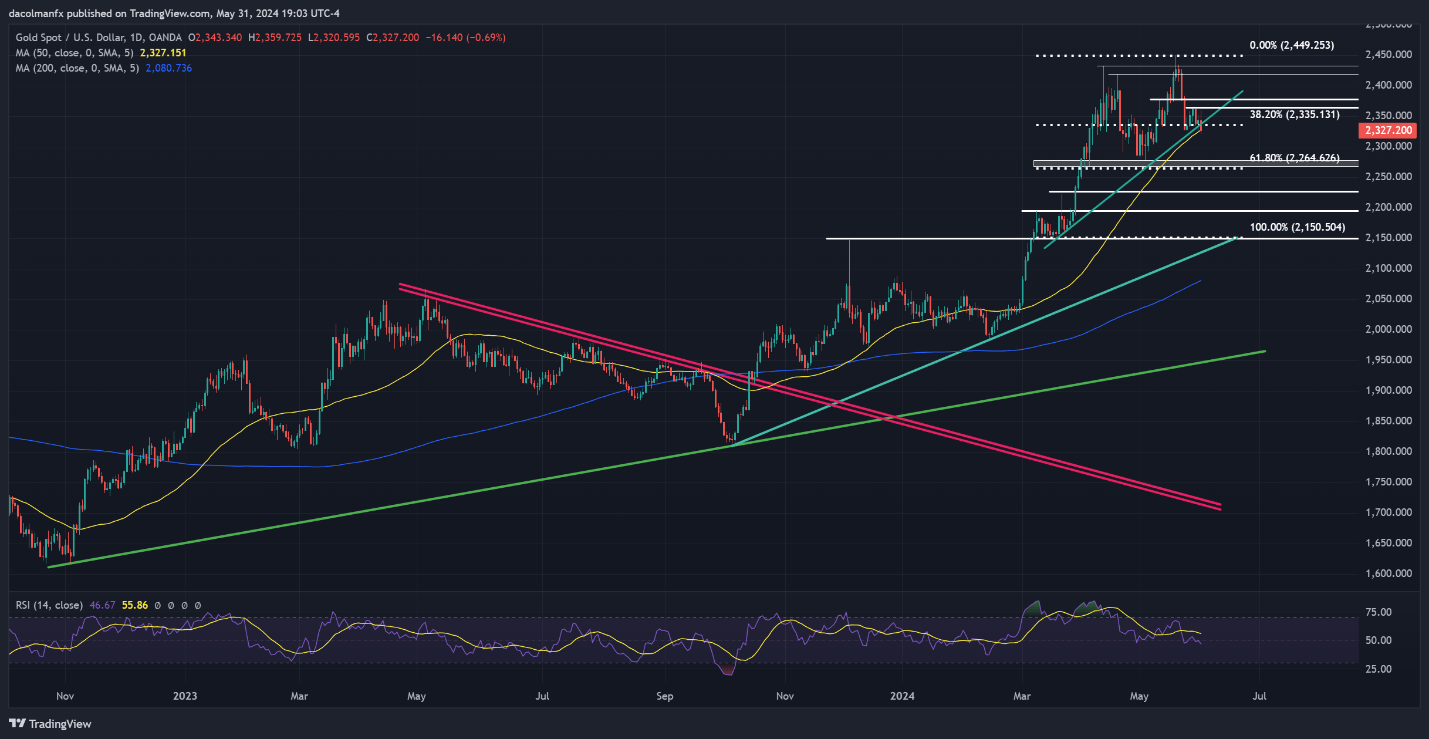
In a recent article , I explored a compelling trading idea, discussing the possibility of gold 's recent softness persisting in the near term. I pointed out that a breach of support located around $2,335 could serve as a technical signal for a bearish continuation. On Friday, bullion not only slipped below this region but also fell under its 50-day simple moving average at $2,327.
Despite this breakdown, the subsequent drop lacked vigor and wasn’t decisive, with sellers failing to pounce on the move, indicating some indecision in the camp. However, the situation could change in the coming week if prices do not reverse upwards soon. In this scenario, we could start seeing an increased appetite for short positions.
Looking at potential directional outcomes, if XAU/ USD follows through to the downside in the days ahead, bearish sentiment could become more dominant, creating the right conditions for a deeper pullback moving into June. In this case, bears may initially target the $2,265 level, which represents the 61.8% Fibonacci retracement of the March-May rally. On further weakness, attention will shift to $2,225.
On the other hand, a resurgence of buyers lifting the yellow metal past the 50-day SMA and above $2,340 could rekindle buying interest in the market, setting the stage for a rally toward $2,365. Upside progress beyond this key ceiling would likely invalidate the near-term bearish outlook, possibly propelling prices toward $2,377 and even $2,420.
For an extensive analysis of gold’s fundamental and technical outlook, download our complimentary quarterly trading forecast now!
GOLD PRICE TECHNICAL CHART

Gold Price Chart Created Using TradingView

