Aussie Price Setups (AUD/USD, AUD/NZD, AUD/JPY)
- AUD/USD strengthens, building on prior gains
- AUD/NZD bull flag propels upside continuation
- AUD/JPY pulls back massively after suspected FX intervention
- Get your hands on the Aussie dollar Q2 outlook today for exclusive insights into key market catalysts that should be on every trader's radar:
Markets Erase RBA Cuts, Pricing in Rate Hike Odds Instead
In the aftermath of the hotter-than-expected Australian inflation in Q1, markets have removed prior bets in favour of rate cuts and now price in the potential for another rate hike later this year.
In addition, global risk sentiment has improved after the risk of a broader Israel-Iran conflict has now subsided. AUD is therefore, well placed to take advantage of improving conditions.
Implied Basis Point Hikes now Expected by the Market (Official Cash Rate)

AUD/USD Strengthens, Building on Prior Gains
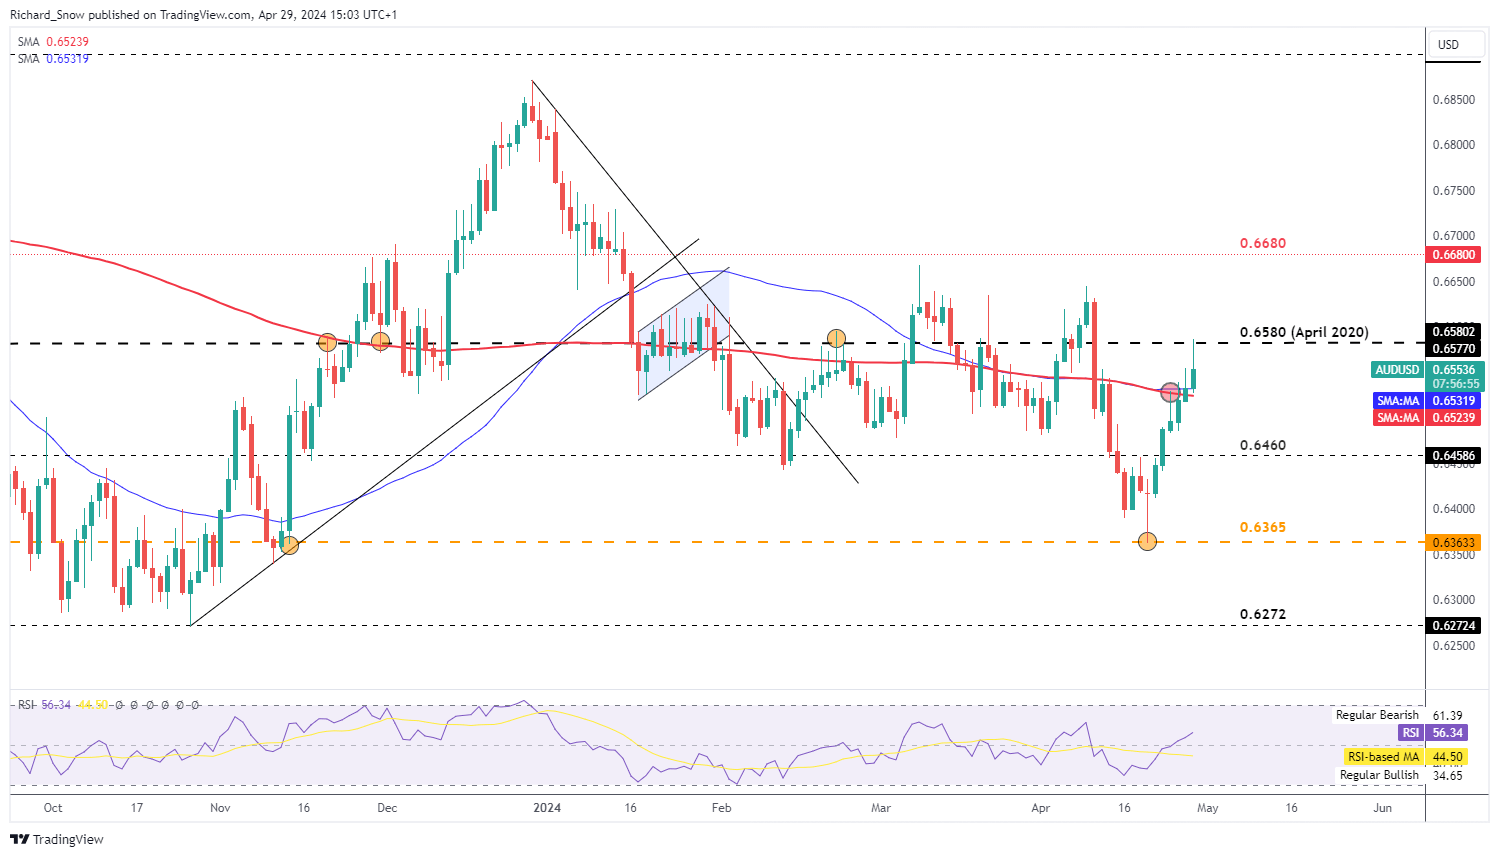
AUD/ USD made a sharp pivot at the 0.6365 level, advancing through 0.6460 in the process. At the end of last week, the 200-day simple moving average (SMA) appears as an immediate level of resistance at the start of this week. AUD/USD bulls pushed through the barrier on Monday, tagging 0.6580 before pulling back intra-day. The RSI is still some distance from overbought territory, suggesting the market may still have more upside left before a correction is due. The 200 SMA re-emerges as the nearest level of support, where a hold above it, extends the bullish continuation bias. FOMC is due on Wednesday along with ISM manufacturing PMI figures and NFP rounds up the week. Therefore, there is plenty of dollar-centered data to sway the pair. A bullish continuation brings the 0.6580 level and 0.6680 market into focus.
AUD/USD Daily Chart

AUD/NZD Bull Flag Propels Upside Continuation
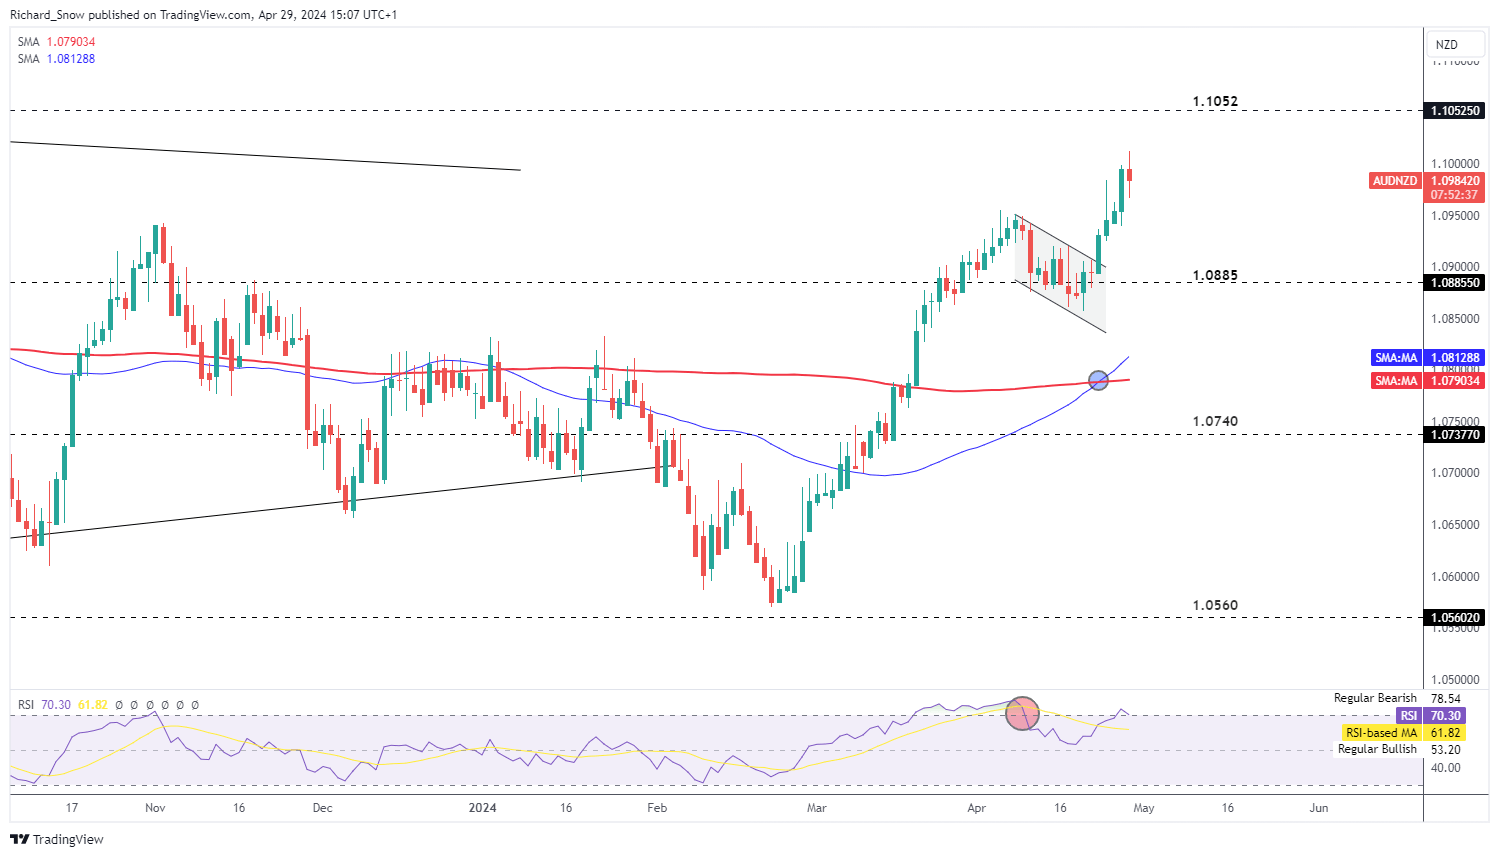
AUD/ NZD was highlighted over the last couple of weeks for it’s potential for a bullish continuation. The bull flag pattern has validated the recoiling of prices which sprung higher early last week and only now appears at risk of a slowdown in momentum.
AUD/NZD trades lower on the day as the RSI pierced overbought territory and appears to be making its way back down already.
1.0885 appears at the nearest level of support but remains around 100 pips away for now. In the event bulls aren’t ready to give up, 1.1052 is the next level of resistance.
AUD/NZD Daily Chart

Looking for actionable trading ideas? Download our top trading opportunities guide packed with insightful tips for the second quarter!
AUD/JPY Pulls Back Massively after Suspected Japanese Intervention
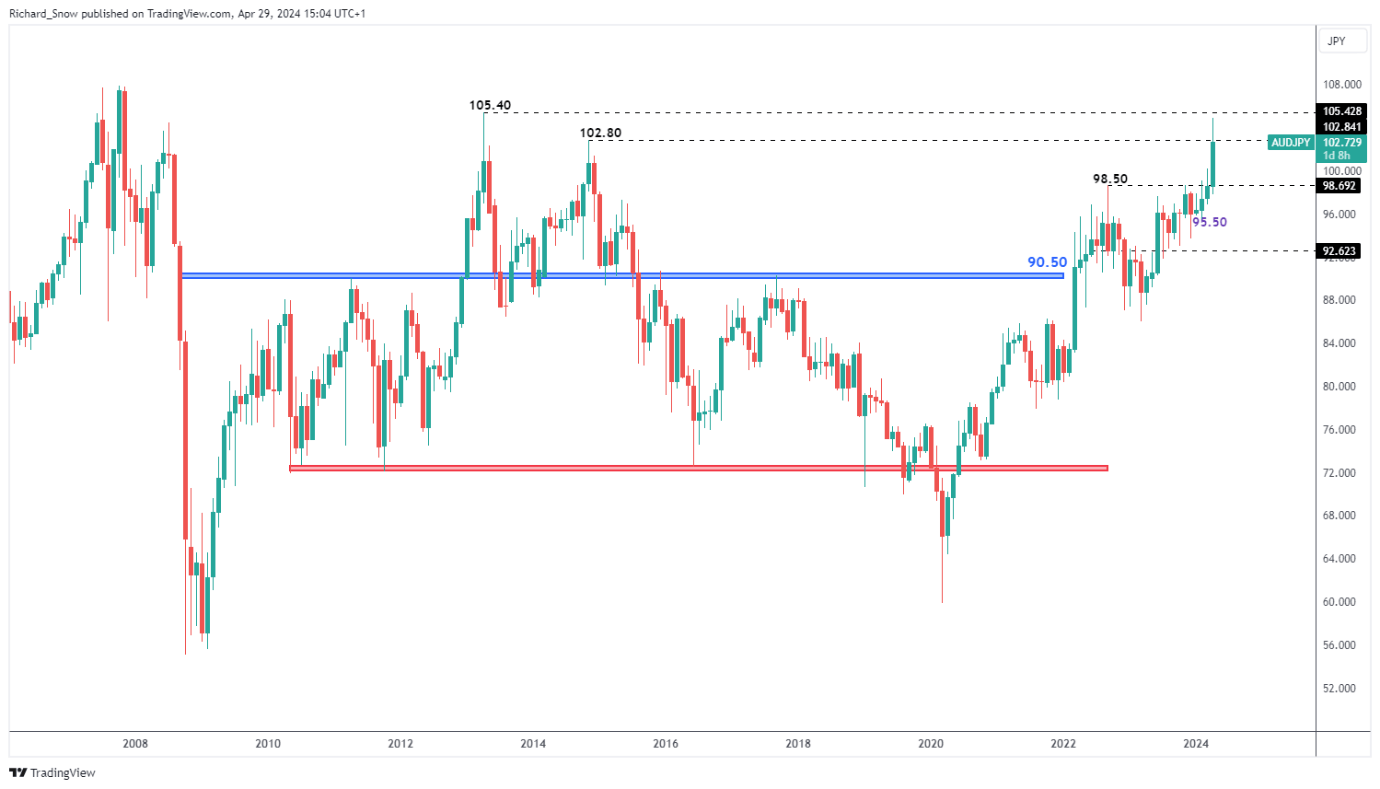
The Japanese yen began the week in a volatile fashion, rising massively in what is suspected to be the result of remedial action from Japanese authorities in a bid to strengthen the yen. The weekly chart revealed a massive spike higher at first, potentially drawing the attention of currency officials, before the massive move lower in AUD/JPY.
105.40 remains the level of resistance dating back to April 2013, with prices appearing to settle on Monday around 102.80 the November 2014 spike high.
Weekly AUD/JPY Chart

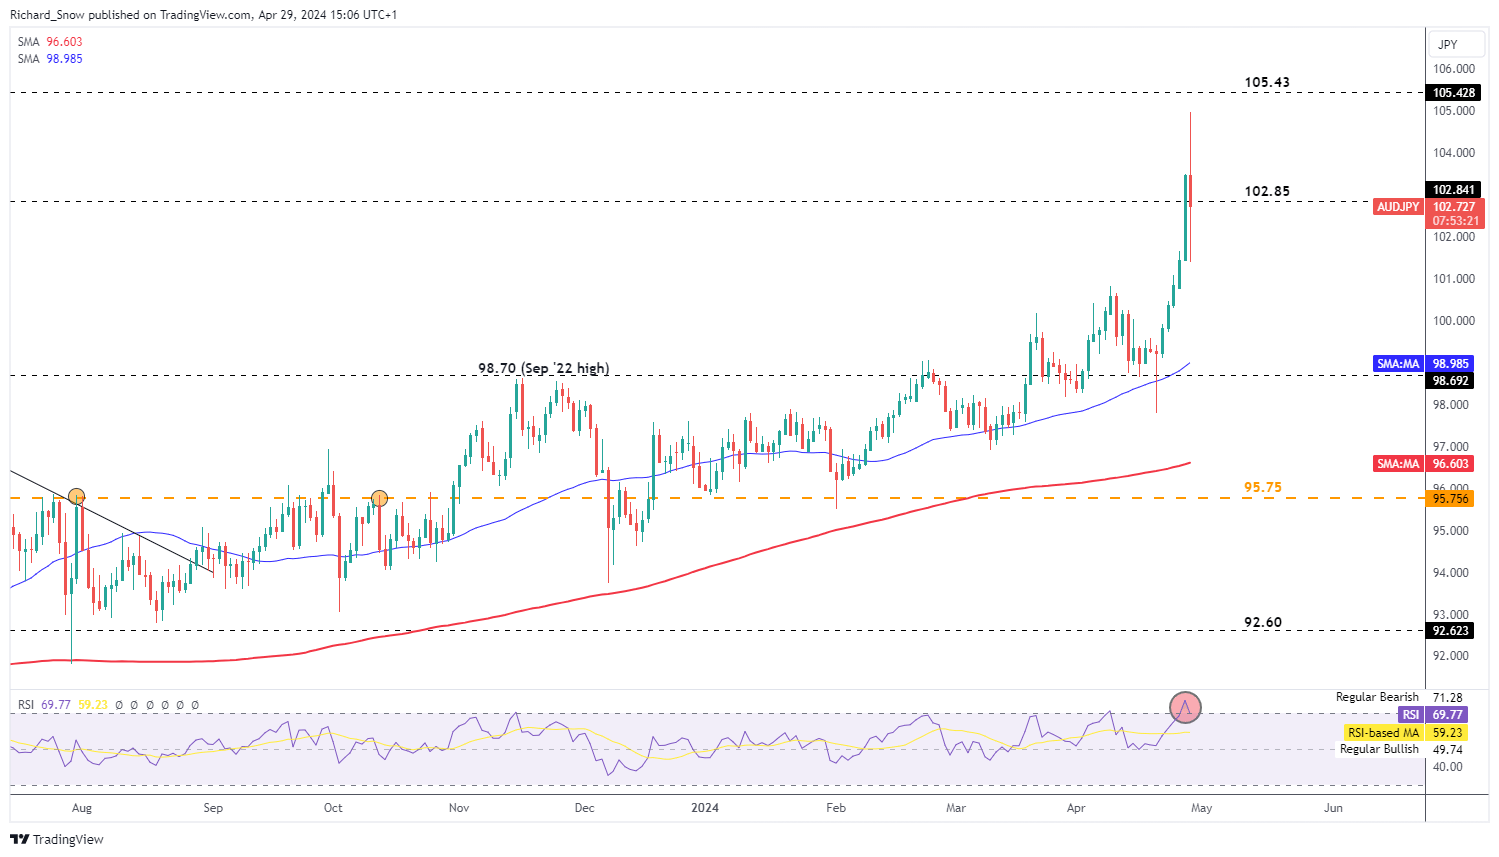
The daily chart hones in on the recent ascent as markets powered ahead despite numerous warnings from currency officials. If the events of today were the result of FX intervention, the Japanese Finance ministry may be in for a difficult time seeing that prices have risen a fair amount off the daily low as markets already look to trade in favour of the carry trade. Support appears at the daily low 101.40 before the prior swing high of 100.80 comes into play.
AUD/JPY Daily Chart


