Japanese Yen Prices , Charts, and Analysis
- Tokyo inflation fell sharply in April, adding to the BoJ’s problems.
- Japanese Yen weakness is seen across the board, when will the BoJ step in?
The Japanese Yen has touched new multi-decade lows against a basket of currencies following the Bank of Japan's expected decision to keep its monetary policy unchanged. The latest catalyst for the Yen's decline was weaker-than-expected inflation data from Tokyo, which has further solidified the central bank's accommodative stance. Tokyo CPI is seen as an important leading indicator for national inflation. As the BoJ diverges from other major central banks in policy tightening, the Yen remains vulnerable to further volatility and depreciation.

For all market-moving global economic data releases and events, see the Economic Calendar
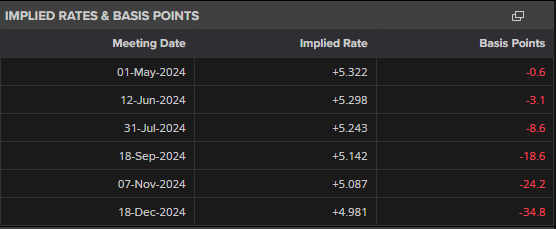
The next data release for traders to follow is US Core PCE at 13:30. Yesterday’s BEA inflation readings showed inflation remaining elevated and at levels that will prevent the Federal Reserve from cutting rates in Q3. Market probabilities now show one 25 basis point rate cut, most likely at the November 7th FOMC meeting, with a total of 34 basis points of cuts now predicted in 2024. On the back of reduced rate cut expectations, the dollar's ongoing strength is also acting as a tailwind for USD/JPY .

USD /JPY is now above 155.00, seen by the market as the level at which the BoJ will start seriously considering FX intervention to prop up the Yen. This line in the sand has now been breached and brings into question if coordinated FX intervention is being talked about by the BoJ with other major central banks. The weakness of the Yen makes Japanese exports more competitive globally, and may soon spark calls from other central bankers and finance ministers for this advantage to be reined in.
The charts below show the relentless weakening of the Yen and bring official intervention ever closer. The longer the BoJ remains on the sidelines, the more markets will force them into action. The longer the BoJ waits, the more violent the subsequent Yen appreciation will be. The Japanese Yen used to be seen as a safe currency to trade, aided by the carry trade. That is no longer the case and strict risk management is a must when trading any Japanese Yen crosses.
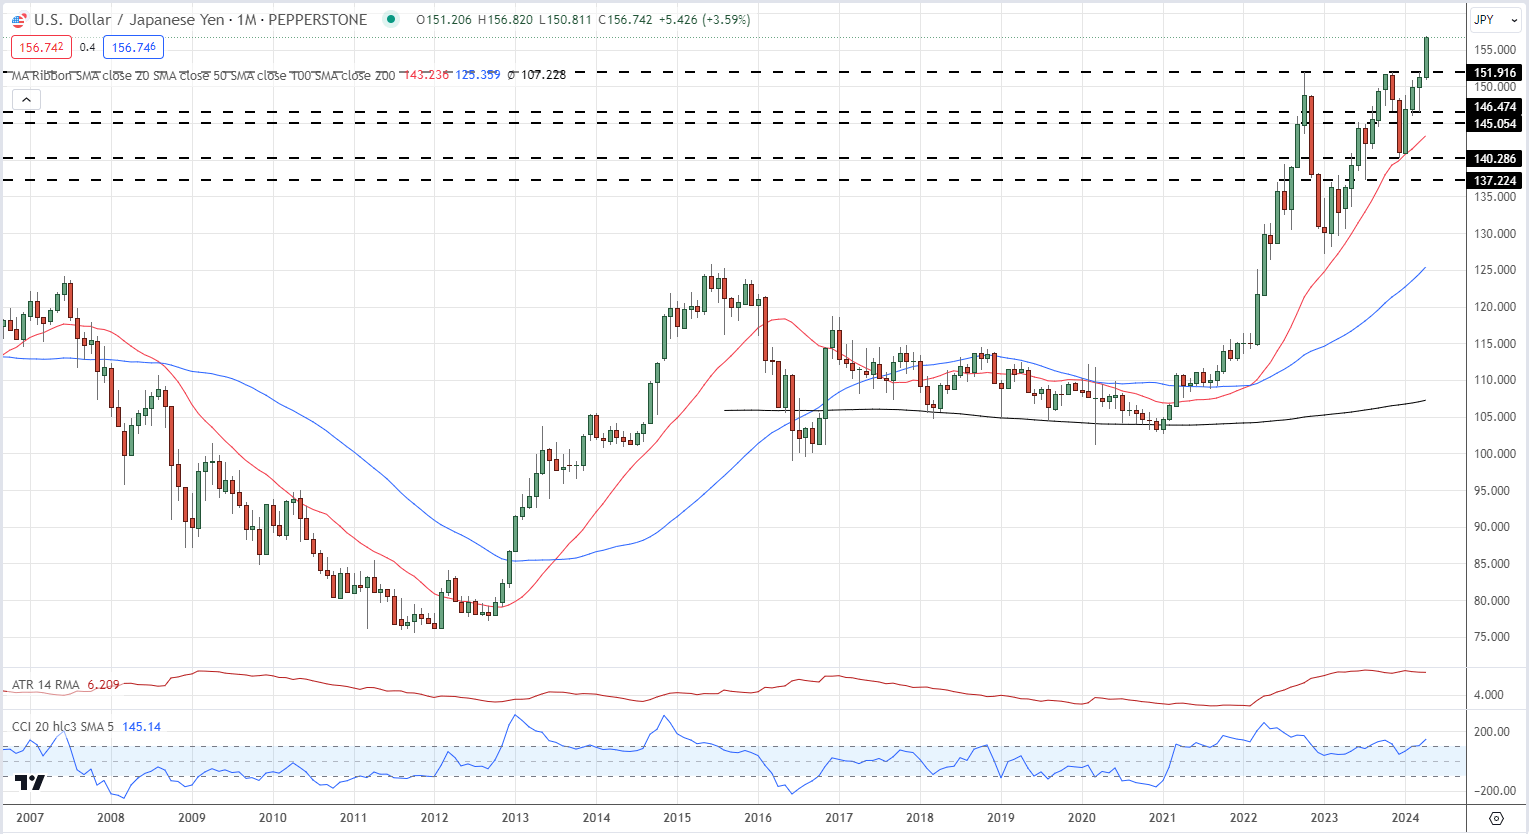
Looking at three monthly Yen charts highlights the weakness in the Japanese currency. USD/JPY now trades around 156.75, a 34-year high….
USD/JPY Monthly Price Chart

Retail trader data shows 15.39% of traders are net-long with the ratio of traders short to long at 5.50 to 1.The number of traders net-long is 2.82% higher than yesterday and 8.10% higher than last week, while the number of traders net-short is 2.56% higher than yesterday and 7.20% higher than last week.
We typically take a contrarian view to crowd sentiment , and the fact traders are net-short suggests USD/JPY prices may continue to rise.
Download the Latest IG Sentiment Report and discover how daily and weekly shifts in market sentiment can impact the price outlook:
| Change in | Longs | Shorts | OI |
| Daily | 4% | -1% | 0% |
| Weekly | 6% | 2% | 3% |
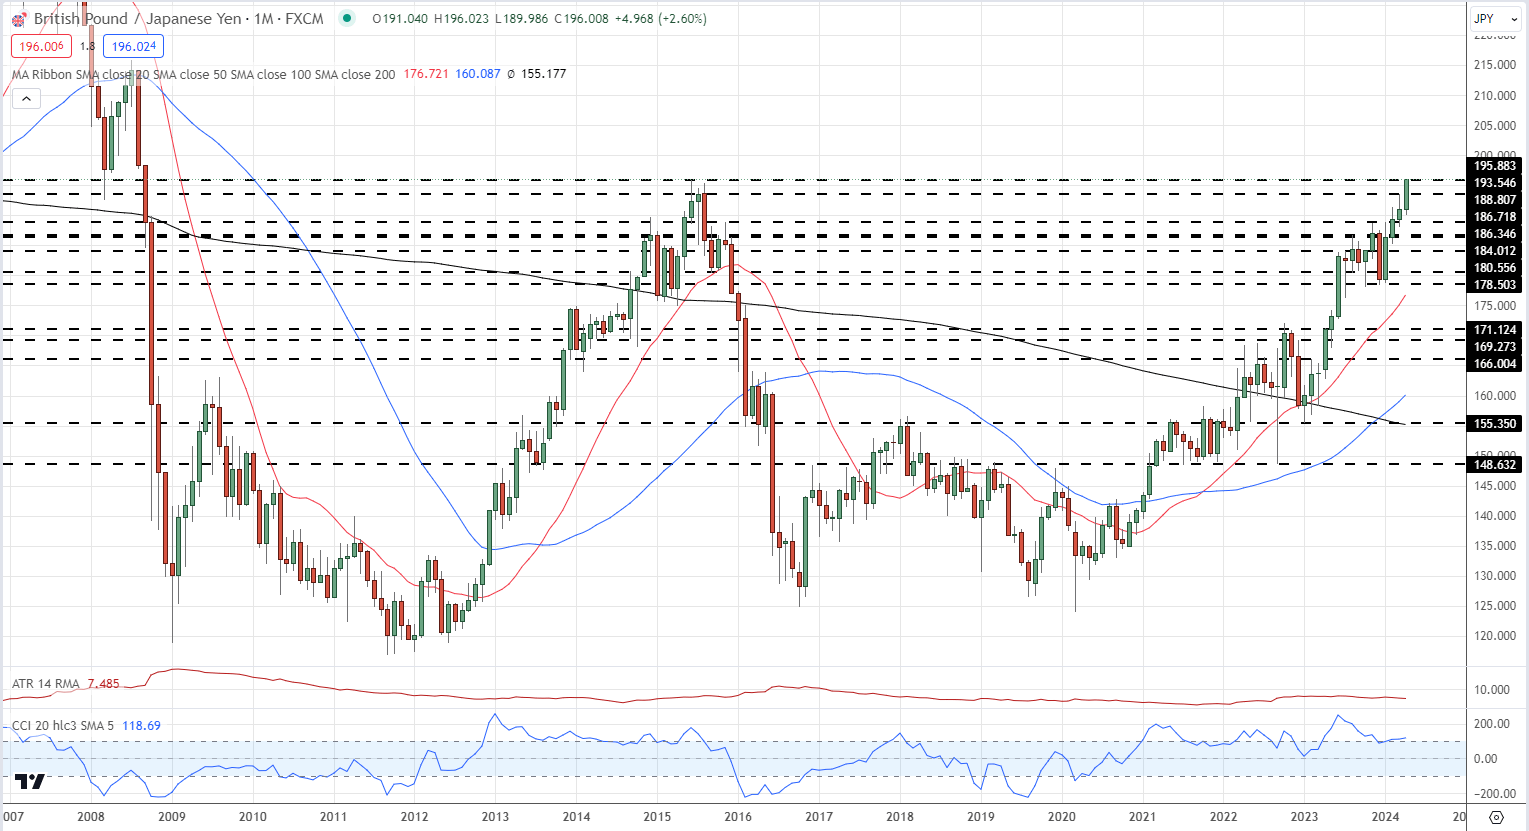
GBP/JPY is at levels last seen in September 2008 and is within touching distance of 200…
GBP/JPY Monthly Price Chart

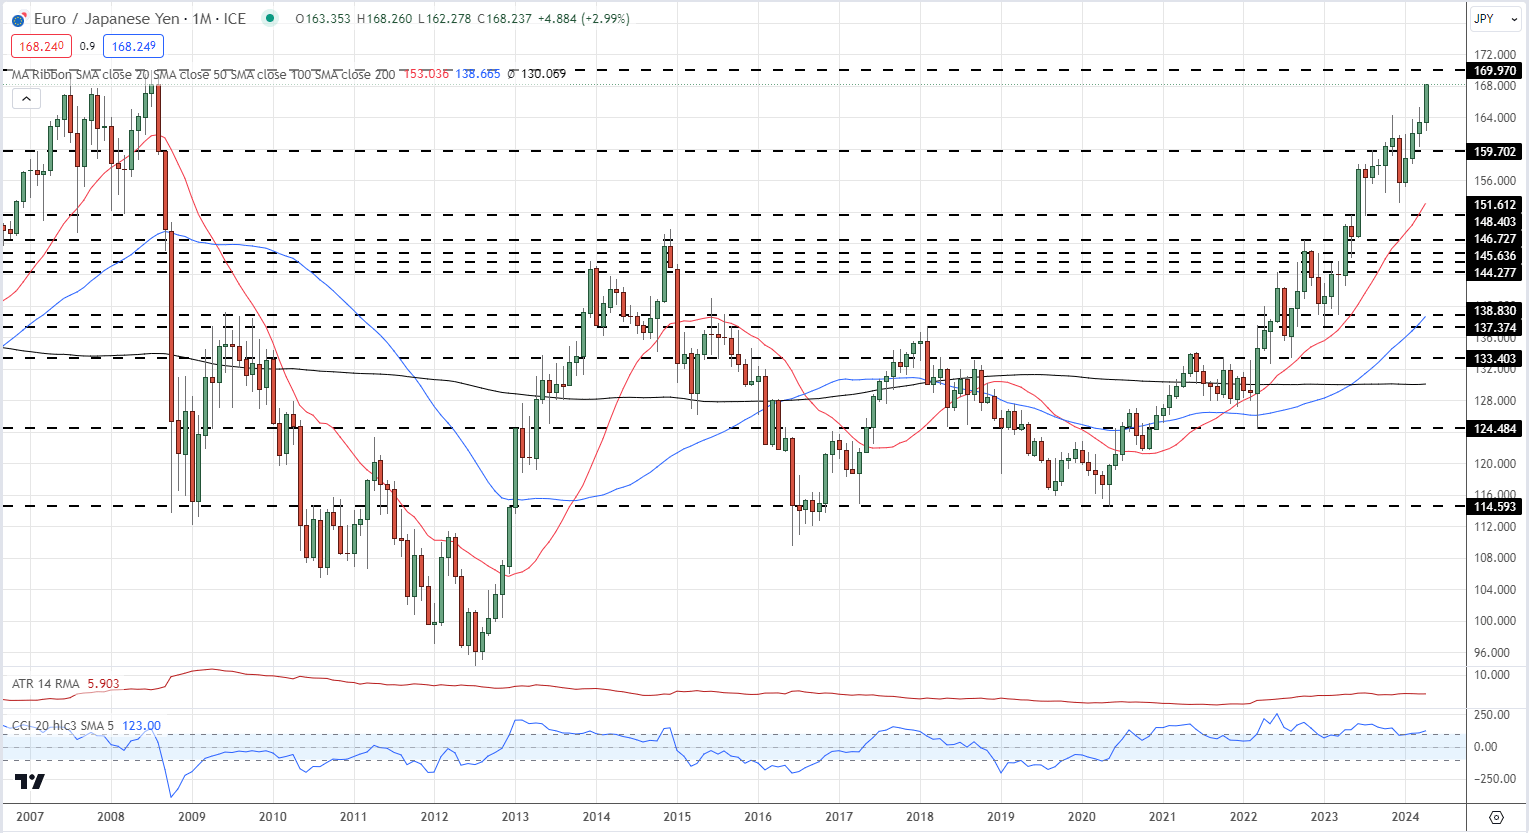
…while EUR/JPY is at levels last seen in August 2008.
EUR/JPY Monthly Price Chart


