Crude Oil Prices and Analysis
- Crude Oil prices are edging cautiously back up
- Demand worries are balanced out by potential supply threats
- US inflation numbers will be the next major news point, as they are for all markets
Download our Free Q2 Oil Technical and Fundamental Analysis Reports Below:
Crude oil prices were up but still very close to their opening levels in a rather torpid European Thursday.
The previous day saw the release of the United States’ Purchasing Managers Index report for April. It found overall business activity at a four-month low, sending oil prices back below $83/barrel, where they remain, just.
The market is caught between signs that energy demand out of the United States could be faltering and continuing conflicts in Ukraine and the Middle East. Both tragic clashes have the potential to disrupt supply from key producing areas at any moment.
The latest numbers from the US Energy Information Administration painted a rather mixed picture. Crude inventories fell by much more than expected, but it seems that much of this was accounted for by oil exports rather than increased domestic demand. There the outlook was murkier with gasoline stocks falling rather less than forecast.
The world’s largest economy is dealing with the prospect that interest rates will have to stay higher for longer. This prospect will defer economic activity and, thereby, likely reduce energy demand. According to the Chicago Mercantile Exchange’s ‘Fedwatch’ tool, a quarter-point rate reduction is now not fully priced until September.
The oil market is like all others fixed on Friday’s inflation numbers from the Personal Consumption and Expenditure series. Known to be a firm favorite at the Federal Reserve, the data will assuredly be taken as a steer on monetary policy prospects. Closer to the oil market, the US oil rig count from Baker-Hughes is also coming up on Friday.
US Crude Oil Technical Analysis

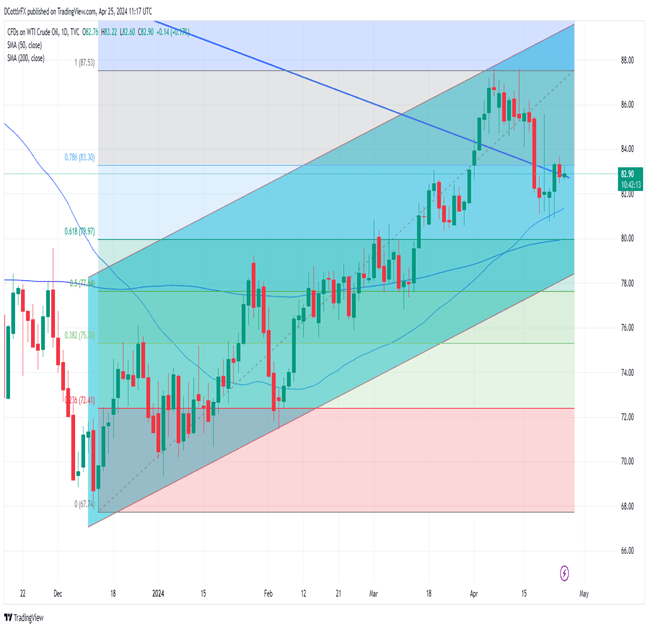
US Crude Oil Daily Chart Compiled Using TradingView
Learn How to Trade Oil Like an Expert with Our Popular Guide
The West Texas Intermediate benchmark is hovering around an admittedly rather sparsely tested downtrend line from mid-2022 which now offers support very close to the market at $82.77.
In recent days the market has shown some tendency to bounce on approaches to the 50-day simple moving average, now a little further below current prices at $81.16. Below that comes key retracement support at $79.97 and the market hasn’t been below that point since mid-March. To the upside, bulls have their work cut out to retrace the sharp fall seen on April 17. The top of that decline now offers resistance at $85.33. Given current, modest daily ranges, it is hard to see a test of that in the near term. Psychological resistance at $84.00 is closer to hand and the bulls will probably try to consolidate above that point before attempting to push on.
IG’s own sentiment indicator finds traders quite bullish at current levels, and the market remains well within a longer-term broad uptrend from the lows of December, which looks most unlikely to be challenged anytime soon.

