US Dollar and Gold Analysis and Charts
You can now download our brand new Q2 US Dollar Technical and Fundamental Forecasts for free:
For all major central bank meeting dates, see the Central Bank Calendar
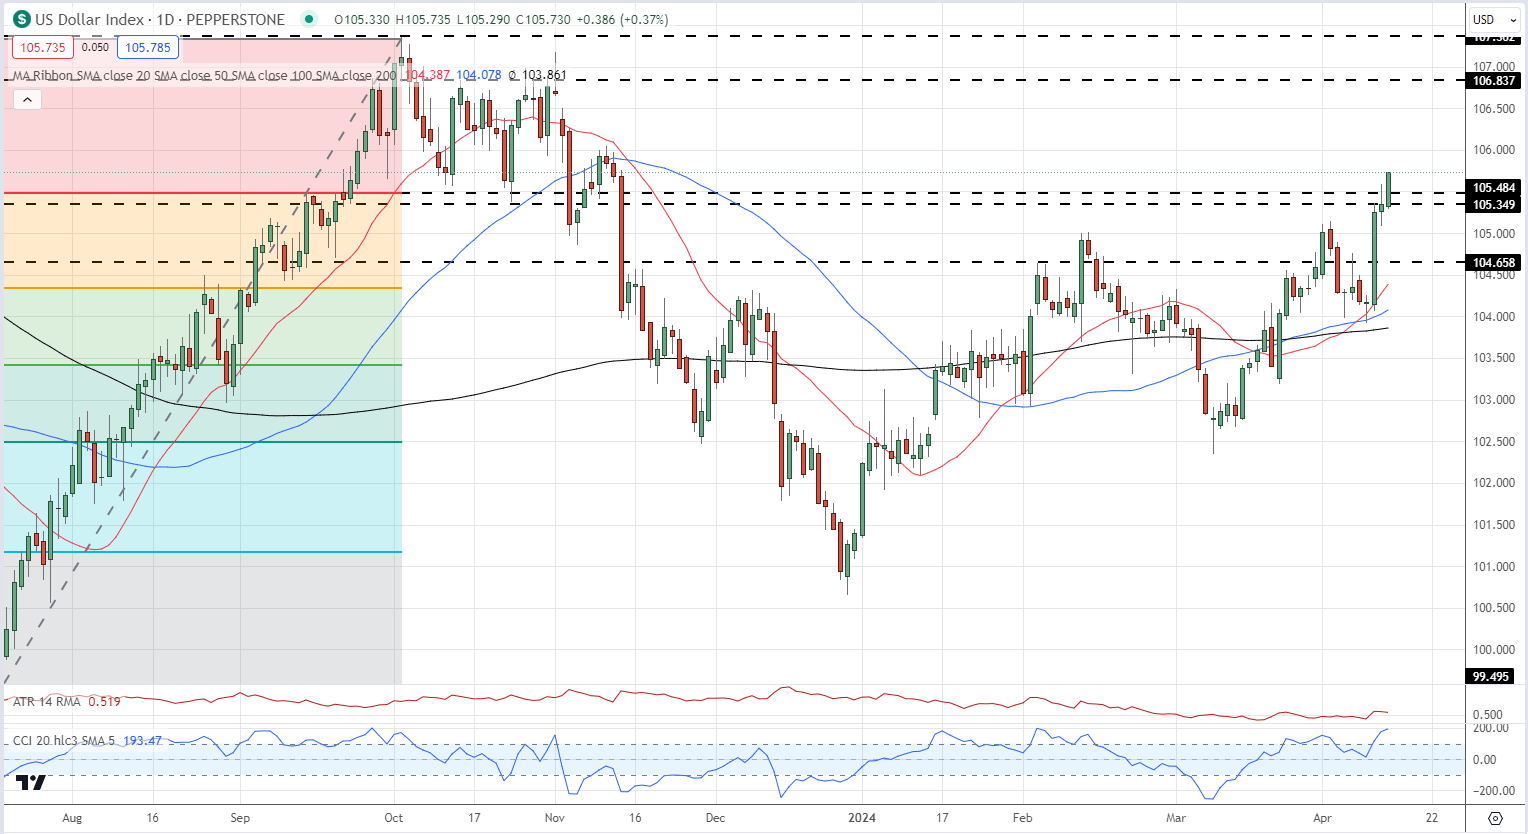
US dollar strength is seen across a range of FX pairs in early European trade as the US dollar index breaks through old resistance levels with ease. This move is being helped by renewed Euro weakness after yesterday’s ECB meeting ramped up expectations for a June interest rate cut . With the US seemingly pushing a rate cut back towards later this year, the yield differential between the two currencies will narrow, forcing EUR/USD lower.
For all economic data releases and events see the Economic Calendar
The US dollar index is a measure of the value of the United States dollar relative to a basket of foreign currencies. The index is designed to provide a reference point for the strength or weakness of the US dollar. It is calculated by comparing the dollar's value to six major world currencies: the euro (57.6%), Japanese yen (13.6%), British pound (11.9%), Canadian dollar (9.1%), Swedish krona (4.2%), and Swiss franc (3.6%). The index has a base value of 100, with values above 100 indicating a stronger dollar and values below 100 signalling a weaker dollar compared to the basket of currencies.
US Dollar Index Daily Chart

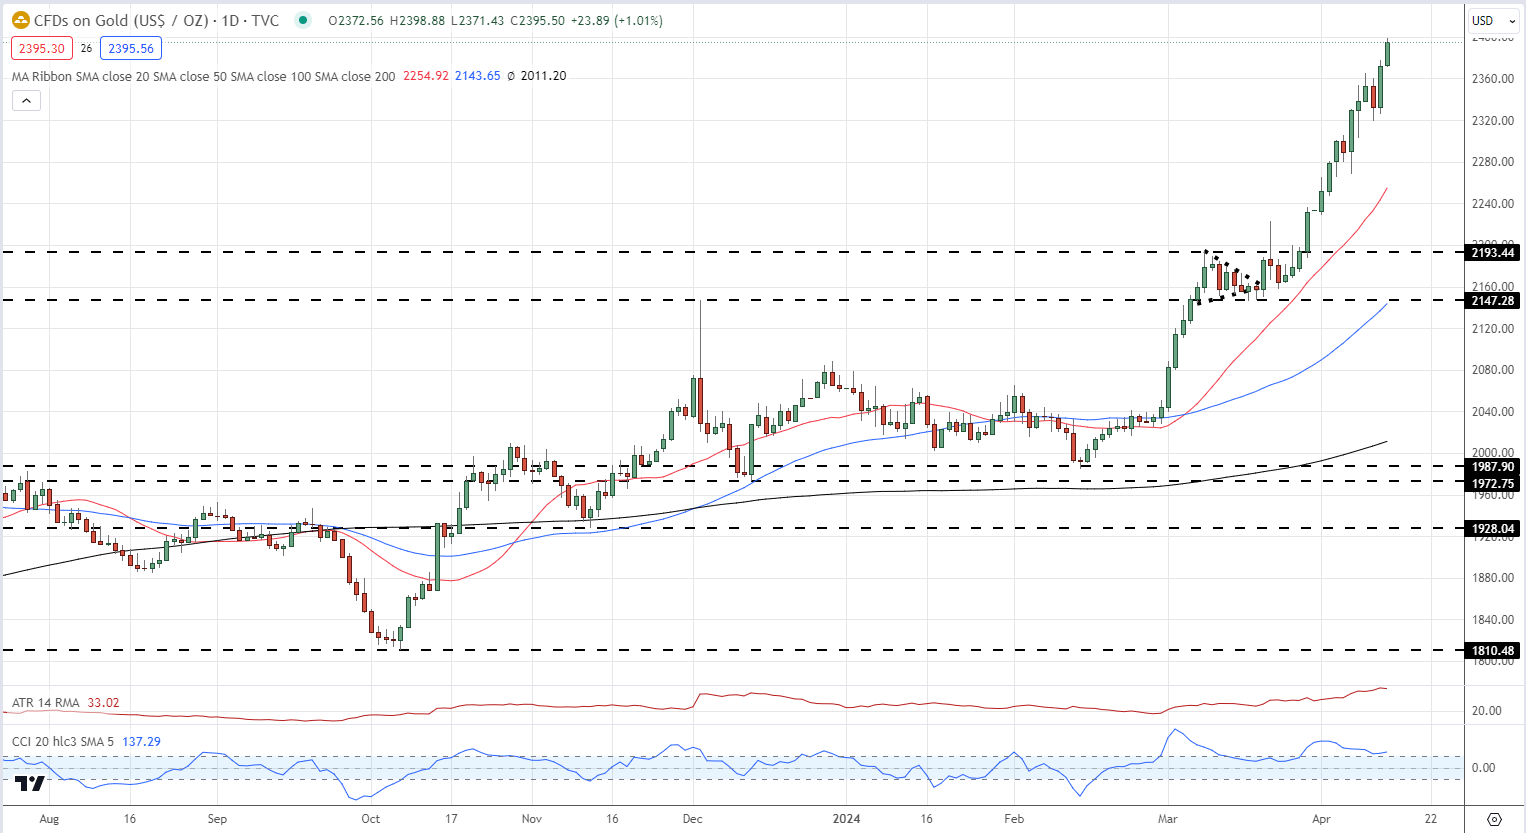
Gold carries on moving higher despite the US dollar’s ongoing rally. Gold normally weakens in times of US dollar strength, but this correlation has broken over the past weeks as a strong safety bid, driven by increasing tensions in the Middle East, has pushed gold into record-high territory. Gold is testing $2,400/oz. and a confirmed break higher would see $2,500/oz. as the next level of resistance.
Gold Daily Price Chart

All Charts via TradingView
Retail Sentiment data shows 46.76% of traders are net-long with the ratio of traders short to long at 1.14 to 1.The number of traders net-long is 2.56% higher than yesterday and 2.60% higher than last week, while the number of traders net-short is 5.47% higher than yesterday and 0.55% higher than last week.
We typically take a contrarian view to crowd sentiment, and the fact traders are net-short suggests Gold prices may continue to rise.
| Change in | Longs | Shorts | OI |
| Daily | 7% | -7% | 0% |
| Weekly | 16% | -17% | -3% |

