EUR/USD Prices, Charts and Analysis
- ECB edges further towards a June rate cut .
- Will President Lagarde begin signaling further rate cuts?
For a comprehensive assessment of the euro 's medium-term outlook, download our complimentary second-quarter forecast
The ECB left all policy levers untouched as expected, but mentioned in the press statement that, ‘If the Governing Council’s updated assessment of the inflation outlook, the dynamics of underlying inflation and the strength of monetary policy transmission were to further increase its confidence that inflation is converging to the target in a sustained manner, it would be appropriate to reduce the current level of monetary policy restriction.’ Last meeting the ECB mentioned June as a potential meeting for a policy decision, and today’s meeting adds to the view that the ECB will cut on June 6th.
For all market-moving economic data and events, see the real-time Economic Calendar
Financial markets continue to price in a 25 basis point at the June meeting and have recently increased the probability of an additional cut at the July 18th meeting. It may well be that the ECB cuts twice before the Fed makes its first move.
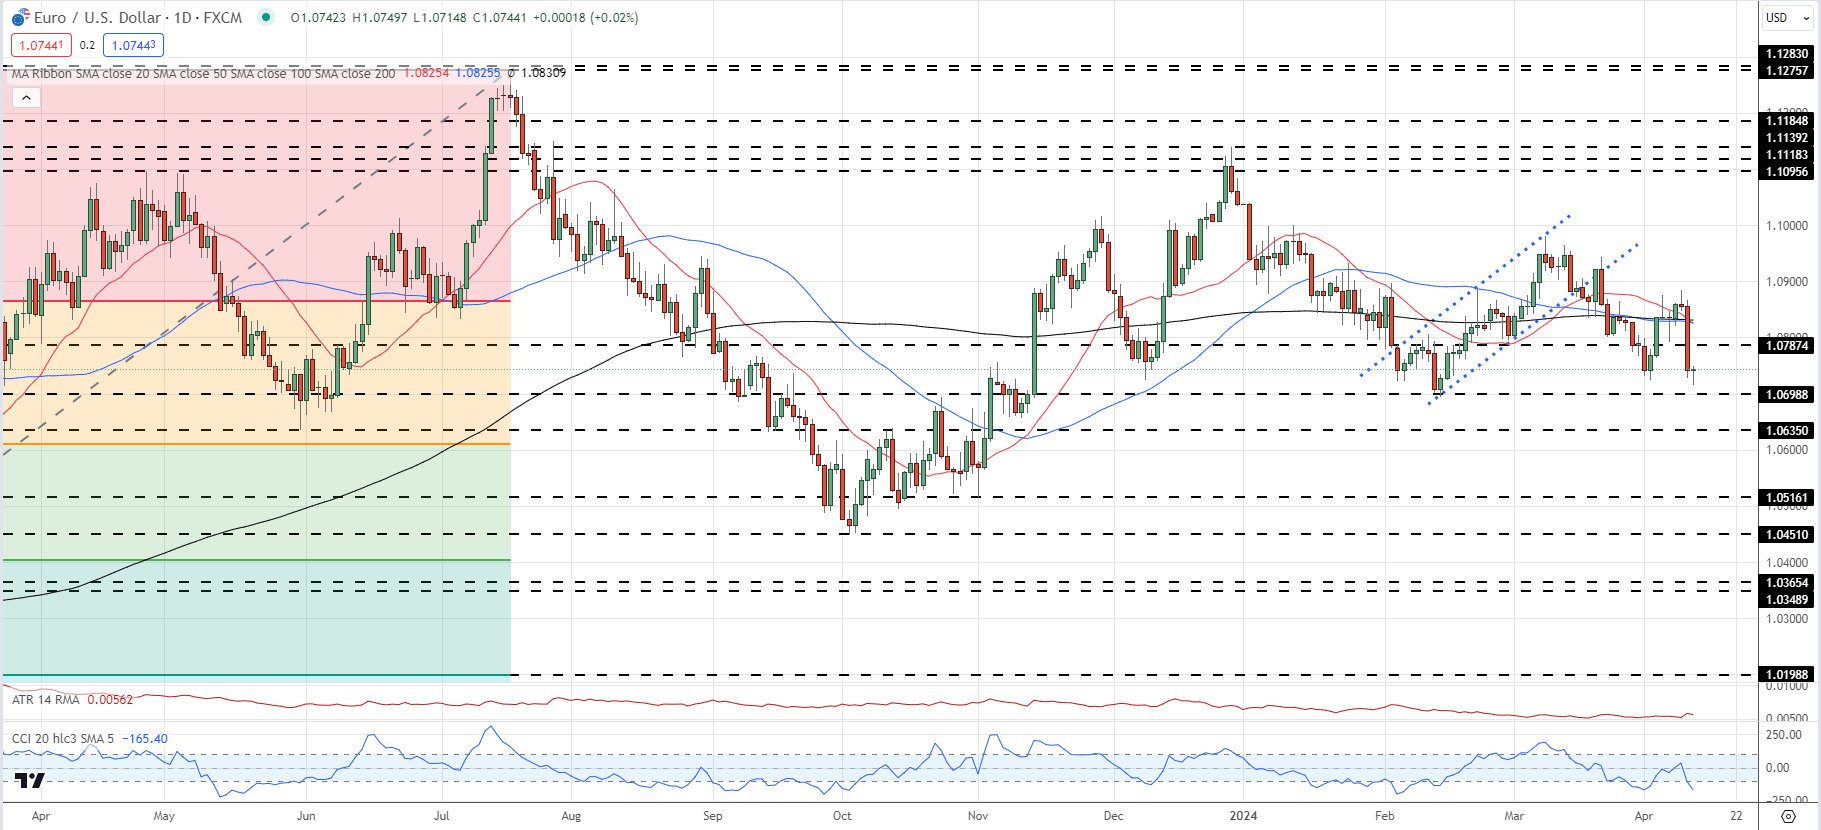
EUR/USD fell sharply yesterday, due to post-CPI US dollar strength, leaving the Euro as the next driver of any move. Initial support is seen around 1.0698, a double-low made in early February, before the 1.0635 – May 31st swing-low – and 1.0610 – Fibonacci retracement – come into play.
EUR/USD Daily Price Chart

Charts using TradingView
Retail trader data shows 68.14% of traders are net-long with the ratio of traders long to short at 2.14 to 1.The number of traders net-long is 51.05% higher than yesterday and 56.59% higher than last week, while the number of traders net-short is 42.48% lower than yesterday and 43.78% lower than last week.
We typically take a contrarian view to crowd sentiment, and the fact traders are net-long suggests EUR/ USD prices may continue to fall.
Want to gain an edge in the FX market? Learn how to harness IG client sentiment data to inform your trading decisions. Download our complimentary guide now!
| Change in | Longs | Shorts | OI |
| Daily | 2% | -12% | -3% |
| Weekly | -2% | 11% | 2% |

