Navigating Volatile Markets
Financial market traders often embrace volatility because it presents opportunities for significant profits, albeit with higher risks. Volatility refers to the degree of variation in the price of a financial instrument over time. When markets are volatile, prices fluctuate rapidly, creating potential for traders to capitalize on short-term price movements. Here's a closer look at why traders like volatility and how they follow and trade it:
Profit potential: Volatile markets may offer traders the chance to make profits in a short time. Rapid price swings allow traders to buy low and sell high within a compressed timeframe, amplifying potential returns. The larger the price movements, the greater the potential for traders who can accurately predict market direction.
Increased trading opportunities: Volatility creates more trading opportunities as prices move more frequently and with greater magnitude. Traders can take advantage of these price swings by employing various strategies, such as scalping, day trading, or swing trading. More volatility means more chances to enter and exit positions, potentially increasing the number of profitable trades.
Master the Three Most Important Market Conditions with our Complimentary Guides
Enhanced liquidity: Volatile markets often attract more market participants, including traders and investors. Increased participation leads to higher volumes and improved liquidity. With more buyers and sellers in the market, traders can execute their trades more easily and with tighter spreads, reducing transaction costs.
To follow and trade volatility, traders can use several tools and techniques:
Volatility indicators: Traders employ technical indicators specifically designed to measure and track volatility. Popular indicators include the Average True Range (ATR), Bollinger Bands, and the Volatility Index ( VIX ). These indicators help traders gauge the level of volatility in the market and make informed trading decisions.
What is the VIX? A Guide to the S&P 500 Volatility Index
Using Average True Range (ATR) to Measure Volatility in Financial Markets
Chart patterns: Traders analyze price charts to identify patterns that indicate potential volatility. Certain chart patterns, such as breakouts, trend lines, and support/resistance levels, can signal impending volatility. By recognizing these patterns, traders can prepare for potential price movements and adjust their strategies accordingly.
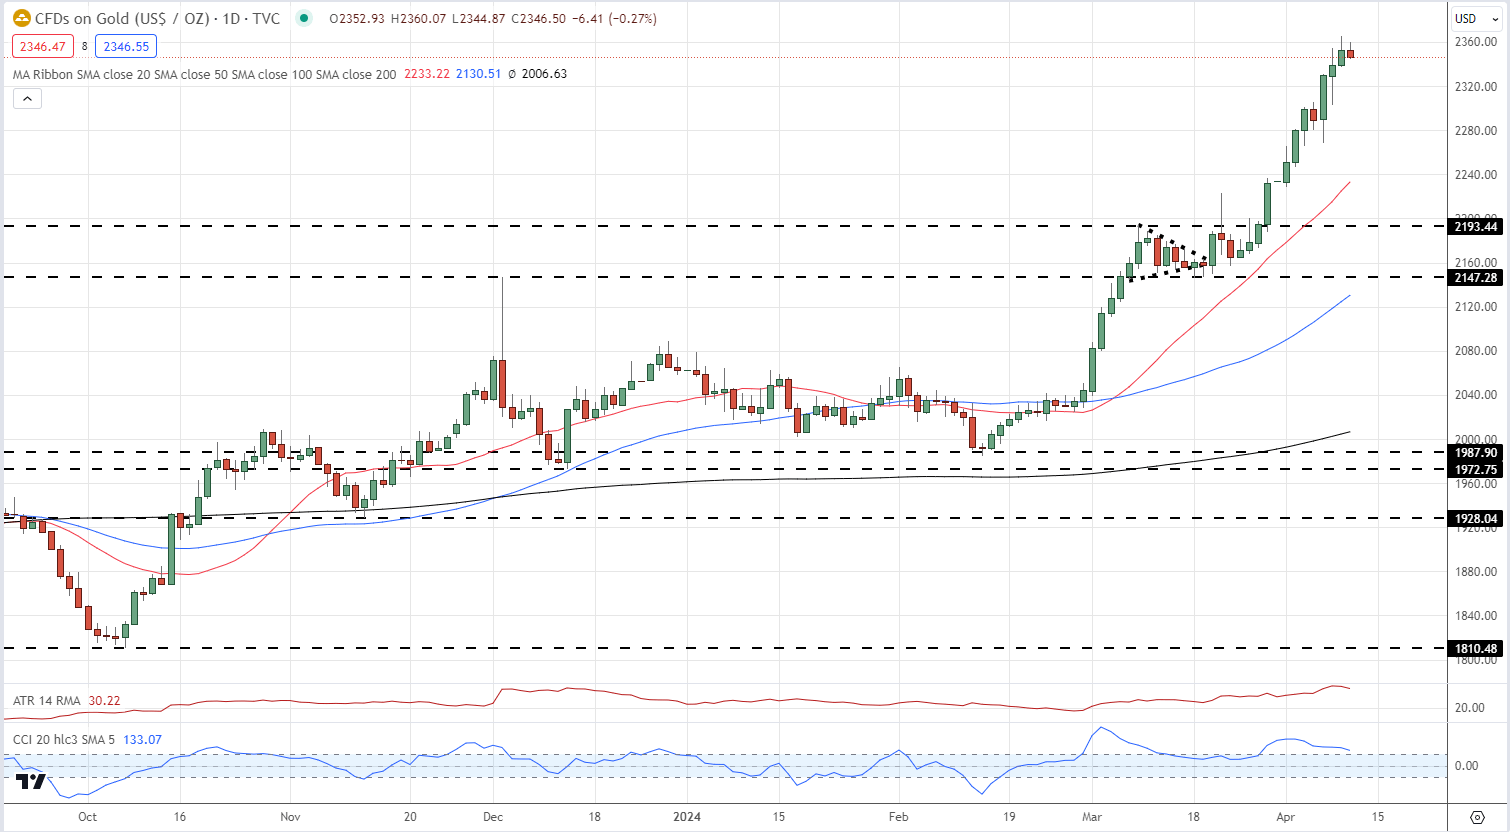
Gold Chart with Simple Moving Averages, Support and Resistance Levels, and ATR

Economic calendar: Traders closely monitor the economic calendar for high-impact events that can trigger volatility. Events, such as central bank meetings, interest rate decisions , GDP releases, and geopolitical developments can significantly impact financial markets. Traders often position themselves ahead of these events or react quickly to the resulting market moves.
For all market-moving economic data and events, use the Economic Calendar
Risk management: While volatility presents opportunities, it also carries increased risk. Traders must employ robust risk management techniques to navigate volatile markets effectively. This includes setting appropriate stop-loss orders, managing position sizes, and diversifying their trading portfolio. Proper risk management helps traders protect their capital during periods of heightened volatility.
Risk Management Techniques for Trading
Adaptive strategies: Successful traders adapt their strategies to changing market conditions. They may employ different trading approaches depending on the level of volatility. For example, during high volatility, traders might focus on shorter-term trades and use wider stop-loss levels. Conversely, during low volatility, they may pursue longer-term positions and employ tighter risk controls.
In conclusion, by utilizing volatility indicators, analyzing chart patterns, monitoring economic events, and employing adaptive strategies, traders can navigate the challenges and opportunities presented by volatile markets.

