Most Read: Euro Forecast and Sentiment Analysis - EUR/USD, EUR/CHF, EUR/GBP, EUR/JPY
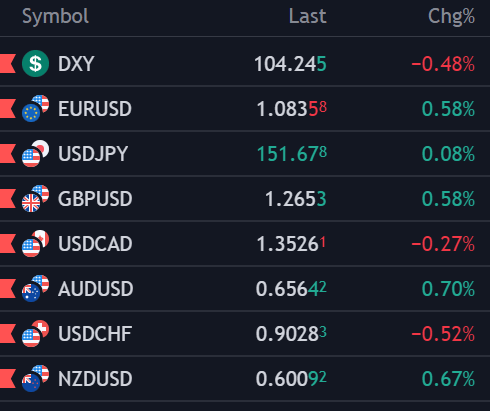
The U.S. dollar moved lower on Wednesday, pressured by a combination of weaker-than-expected economic figures and dovish signals from Federal Reserve Chair Jerome Powell. After a volatile day, the DXY index slumped 0.48%, retreating further from the multi-month highs set on Tuesday during the European session.

Source: TradingView
Focusing first on data, the March ISM Services PMI disappointed expectations, slowing to 51.4 from 52.6 previously and falling below the 52.7 forecast. This deceleration in the services sector, a major driver of U.S. GDP , raises concerns about the economic outlook. While one report doesn't establish a trend, a continuation of this pattern could signal trouble ahead, potentially reigniting fears of recession.

Source: Economic Calendar
For a complete overview of the U.S. dollar’s technical and fundamental outlook, request your complimentary Q2 trading forecast now!
Also contributing to the greenback's poor performance were Powell's comments in a speech at the Stanford Business, Government, and Society Forum. At the event, the FOMC chief downplayed recent high inflation readings, indicating that nothing has really changed for policymakers, a sign that the central bank is still on track deliver 75 basis points of easing in 2024.
Looking ahead, market attention will center on Thursday's US jobless claims data ahead of Friday’s crucial nonfarm payrolls numbers . In terms of estimates, initial filings for unemployment for the week ended on March 30 are seen inching higher to 214,000 from 210,000 previously - a very modest uptick that may not necessarily foreshadow significant challenges brewing on the horizon.

If you are discouraged by trading losses, why not take a proactive step to improve your strategy? Download our guide, "Traits of Successful Traders," and access invaluable insights to assist you in avoiding common trading errors.
UNEMPLOYMENT CLAIMS
US unemployment claims, released weekly, offer valuable clues about the health of the American labor market and its potential impact on the US dollar. Understanding the relationship between this data and the greenback can empower traders to develop more informed trading strategies.
Decoding the Signals
Low Unemployment Claims: When the number of people filing new unemployment claims is low, it suggests a robust labor market. This economic strength can bolster the US dollar for several reasons. Firstly, it reduces the likelihood of the Federal Reserve implementing accommodative monetary policies, like lowering interest rates, which tend to weaken the currency. Secondly, a healthy job market often bolsters consumer spending and economic growth, attracting foreign investment and driving demand for the dollar.
High Unemployment Claims: Conversely, a spike in unemployment claims signals a potential weakening in the labor market. This raises concerns about overall economic health, which can negatively impact the US dollar. A struggling labor market increases the likelihood of the Federal Reserve cutting interest rates to stimulate the economy. Lower rates make the dollar less attractive to foreign investors, leading to potential sell-offs.
Integrating Claims Data into Your Strategy
While unemployment claims are a powerful indicator, they should never be used in isolation. Here's how to incorporate them into your broader trading approach:
Trend Analysis: Look beyond single data points. Analyze the trend over several weeks or months to gauge the overall direction of the labor market.
Economic Calendar: Mark unemployment claims release dates and anticipate potential market volatility, especially if figures deviate significantly from expectations.
Technical Analysis: Combine claims data with chart patterns, indicators, and support/resistance levels to confirm trends and identify entry/exit points.
Fundamental Factors: Monitor broader economic indicators like GDP growth, inflation, and Fed statements for a holistic view of factors driving the US dollar.
Important Note: Unemployment claims offer a snapshot of labor market conditions, but they aren't always a perfect predictor of Fed policy or dollar movements. Always employ a multifaceted approach for the most well-rounded trading decisions.
Discover the art of breakout trading with our exclusive Breakout Trading Guide – your key to mastering market volatility and achieving consistency.
US DOLLAR (DXY) TECHNICAL ANALYSIS
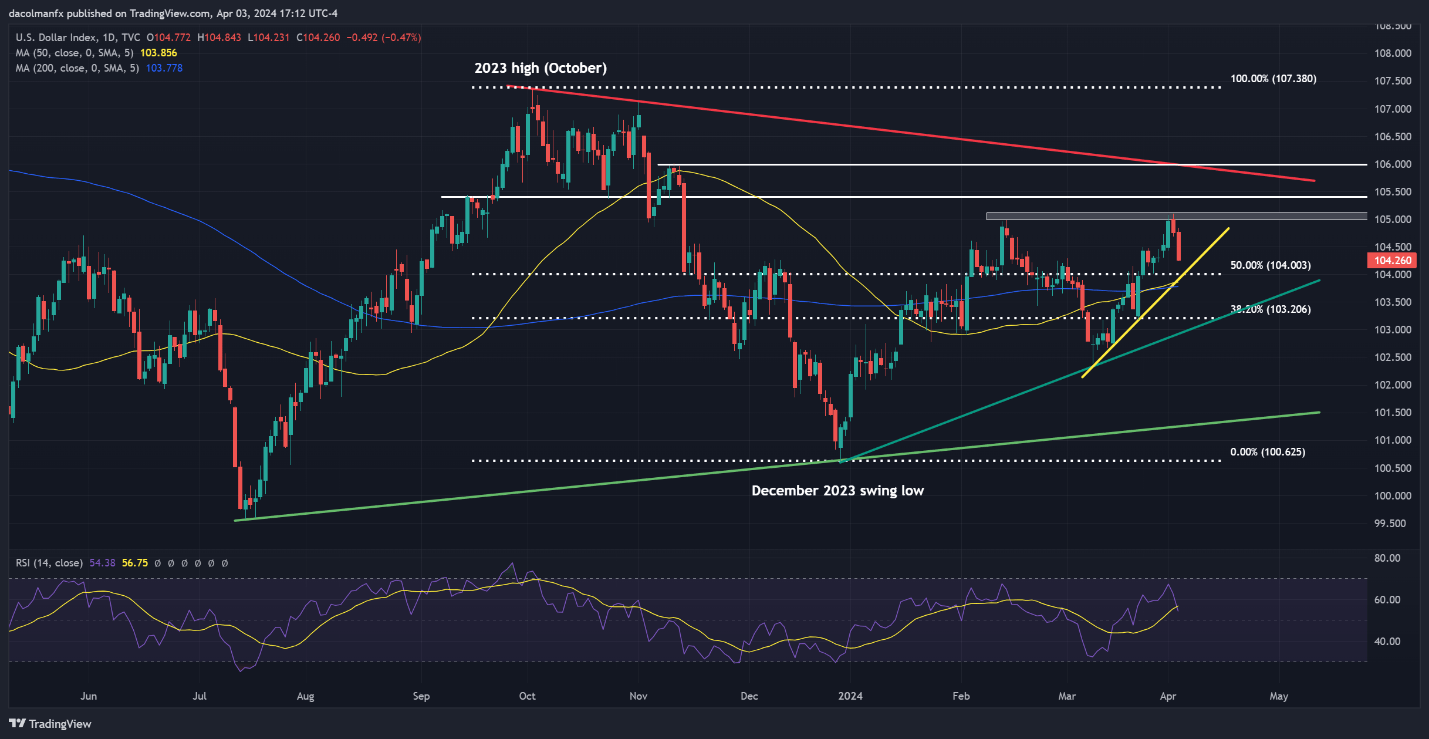
The U.S dollar index fell on Wednesday, marking its second consecutive session of losses after encountering resistance at 105.00 earlier in the week. If weakness persists in the coming days, support appears at 104.00, where a short-term ascending trendline intersects with the 50% Fibonacci retracement of the October-December 2023 selloff. Subsequent losses will draw attention to the 200-day SMA.
On the flip side, if buyers reestablish control of the market and initiate a bullish reversal, the first obstacle against subsequent advances emerges at the psychological 105.00 mark. Bears must vigorously defend this technical barrier; failure to do so could result in a rally towards 105.40. Additional gains beyond this juncture will shift the spotlight to 106.00.
US DOLLAR (DXY) TECHNICAL CHART

Source: TradingView

