Australian Dollar (AUD/USD, AUD/NZD) Analysis
- Australian inflation eases less than anticipated in March and Q1 as a whole
- AUD/USD continues to benefit from the return to risk assets
- AUD/NZD bullish continuation shows promise
- Elevate your trading skills and gain a competitive edge. Get your hands on the Australian dollar Q2 outlook today for exclusive insights into key market catalysts that should be on every trader's radar:
Australian Inflation Eases Less than Anticipated in Q1
Monthly, quarterly and yearly inflation measures showed disappointing progress towards the Reserve Bank of Australia’s (RBA) target. The monthly CPI indicator for May rose to 3.5% versus the prior 3.4% to round off a disappointing quarter where the first three months of the year revealed a rise of 1%, trumping the 0.8% estimate and prior marker of 0.6%.

Generally higher service cost pressures in the first quarter have made a notable contribution to the stubborn inflation data – something the RBA will most likely continue to warn against. The local interest rate is expected to remain higher for longer in part due to the sluggish inflation data but also due to the labour market remaining tight. A strong labour market facilitates spending and consumption, preventing prices from declining at a desired pace.
Markets now foresee no movement on the rate front this year with implied basis point moves all in positive territory for the remainder of the year. This is of course likely to evolve as data comes in but for now, the chances of a rate cut this year appear unlikely.
Implied Basis Point Changes in 2024 For Each Remaining RBA Meeting

AUD/USD Continues to Benefit from the Return to Risk Assets
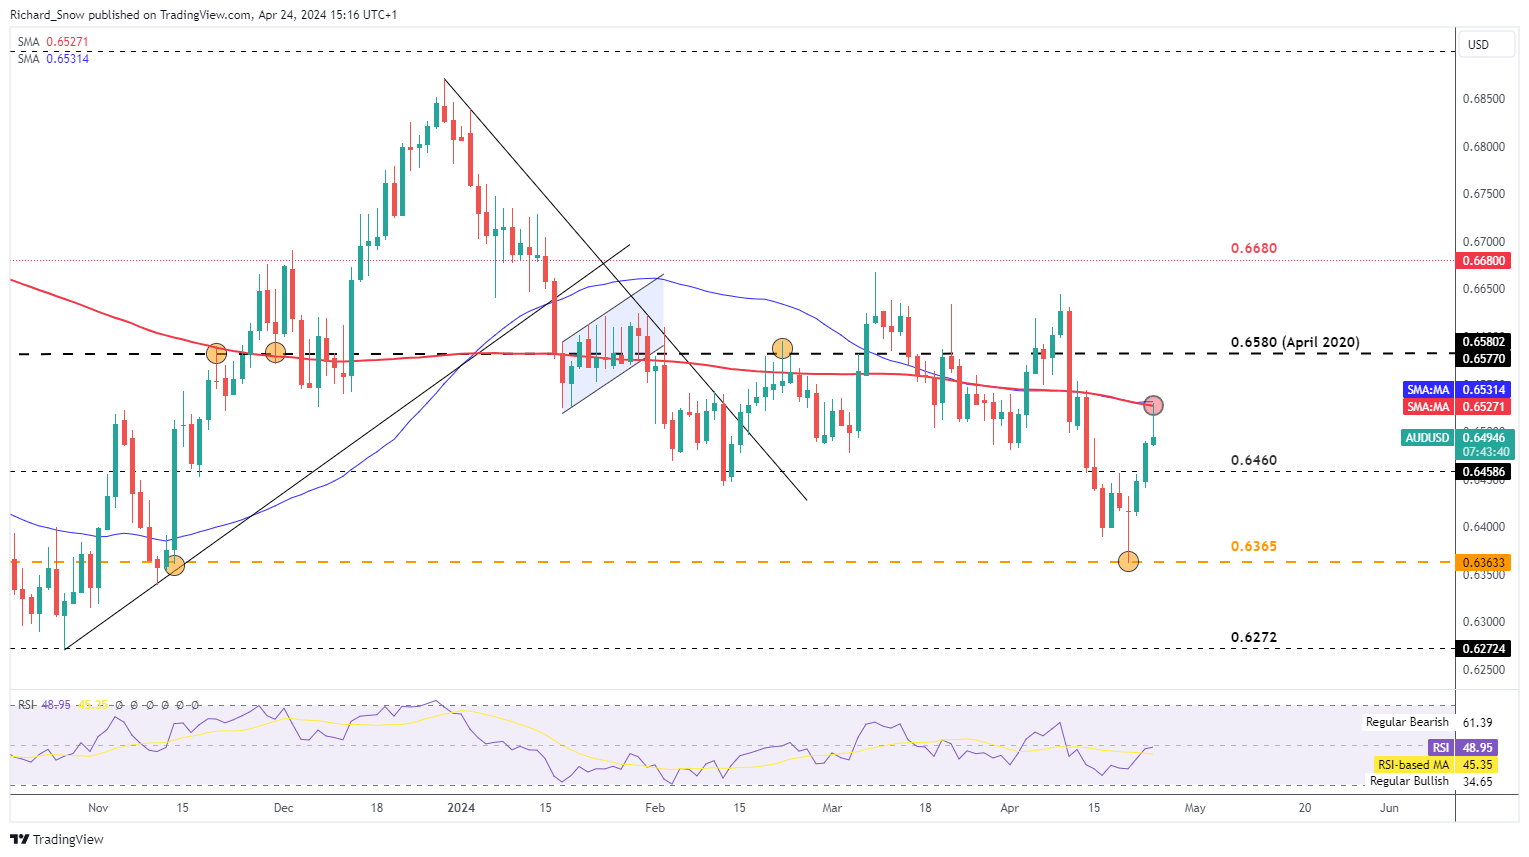
After escalation threats between Israel and Iran appeared to die down, markets returned to assets like the S&P 500 and the ‘high beta’ Aussie dollar. AUD/ USD subsequently reversed after tagging the 0.6365 level – the September 2022 spike low and surpassed 0.6460 with ease.
Upside momentum appears to have found intra-day resistance at a noteworthy area of confluence resistance – the intersection of the 50 and 200-day simple moving averages (SMAs). The move could also be inspired by reports of Israel preparing to move on Hamas targets in Rafah, which could risks deflating the recent lift in risk sentiment.
US GDP data tomorrow and PCE data on Friday still provide an opportunity for increased volatility and a potential USD comeback should both prints surprise to the upside, further reinforcing the higher for longer narrative that has reemerged. All things considered, AUD may be susceptible to a sifter end to the week.
AUD/USD Daily Chart

Learn why the Australian dollar typically trends alongside risk assets like the S&P 500 and is considered a riskier currency:
AUD/NZD Bullish Continuation Shows Promise
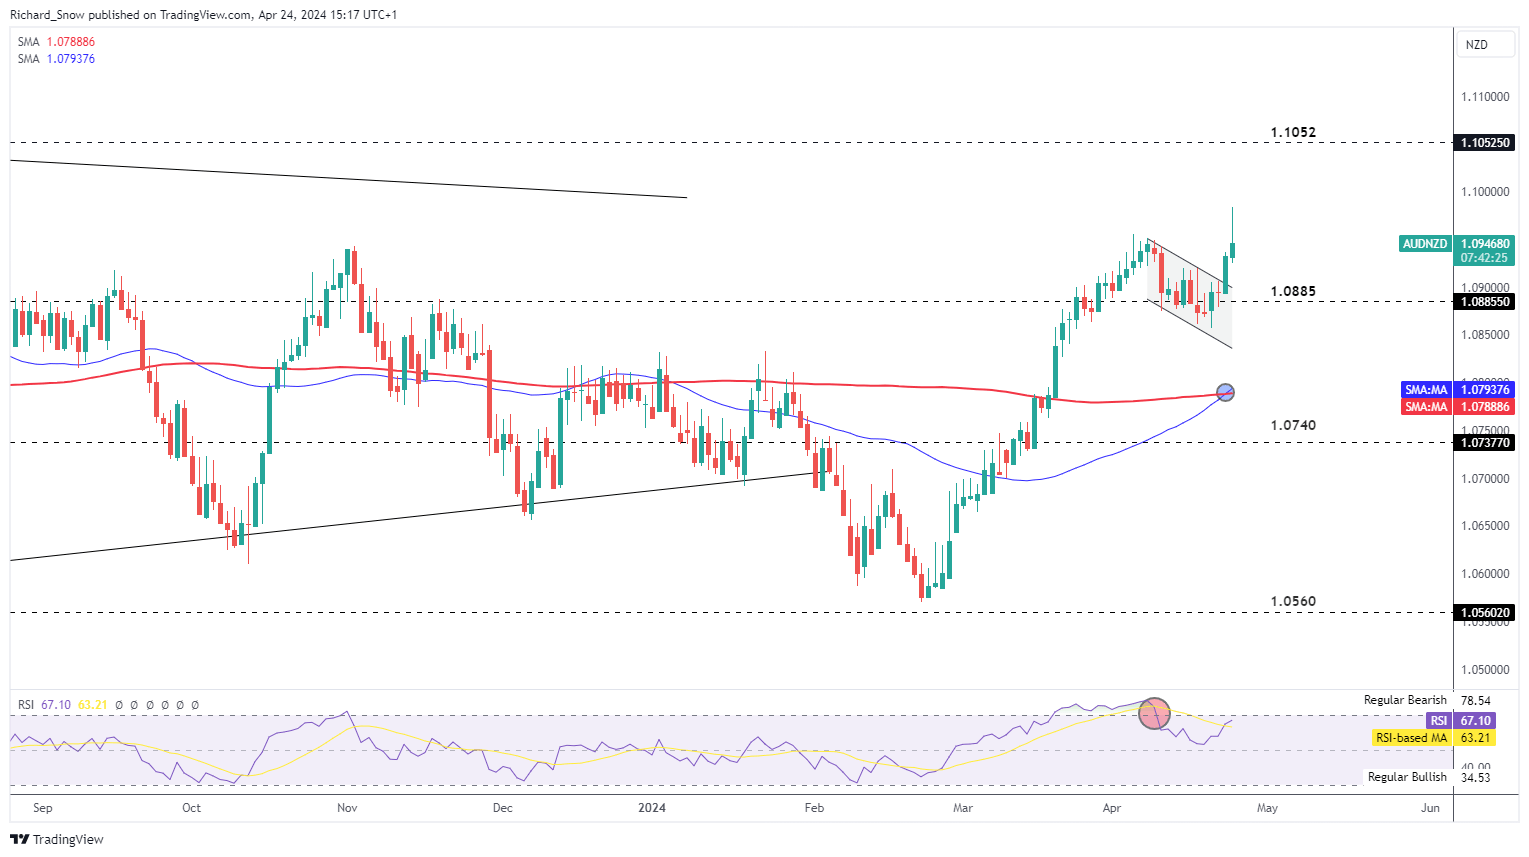
AUD/ NZD entered into a period of consolidation as prices eased in the form of a bull flag pattern. After yesterday’s close, a bullish continuation appears on the cards for the pair despite today’s intraday pullback from the daily high.
A move below 1.0885 suggests a failure of the bullish continuation but as long as prices hold above this marker, the longer-term bullish bias and the prospect of a bullish continuation remains constructive. One thing to keep in mind is the risk of a shorter-term pullback as the RSI approaches overbought once more. Upside target appears at 1.1052 (June 2023 high) and 1.0885 to the downside.
AUD/NZD Daily Chart


