S&P E-mini market analysis
E-mini daily chart
- The E-mini is continuing to form a tight bull channel on the daily chart. This increases the odds that the first reversal down will be minor.
- The problem that the bulls have is that the current rally is a possible wedge top with October 17 th and November 11 th .
- The bears are hopeful that the current rally is a wedge top with the most recent leg up to the December high, forming a parabolic wedge.
- There are probably sellers above the November 11 th high. This means that bears selling above and scaling in higher will likely make money. At a minimum, the market will probably test the November 11 th high.
- The bears need to form bear bars closing near their lows. This will cause the swing Bulls to consider selling out of longs and waiting to see what the reversal attempt looks like.
- The bulls buying over the past several days are momentum bulls, and they will be quick to exit if bears show more signs of strength.
- Overall, the bears need to increase the selling pressure and start forming bear bars, closing on their lows. Without it, the odds will favor sideways to up trading.
E-mini 5-minute chart and what to expect today
- Note: I am currently traveling in Europe and writing this report at 5:15 AM EST. Therefore, the open of the US Session can look much different compared to what has been written in this report.
- At the moment, the Globex market has not moved all that far relative to Thursday's close.
- There are potential market-moving reports at 8:30 AM EST that increase the risk of a breakout, leading to a larger gap up or down.
- Today is Friday, so weekly support and resistance are important. Traders should be prepared for a strong breakout late in the day as they decide on the close of the weekly chart.
- As I often say, most traders should consider not trading for the first 6-12 bars unless they are above to make quick decisions. Most breakouts fail on the open, and in general, there is a 50% chance that the initial breakout on the open will be in the wrong direction, leading to a reversal.
- There is an 80% chance of a trading range open and only a 20% chance of a trend from the open.
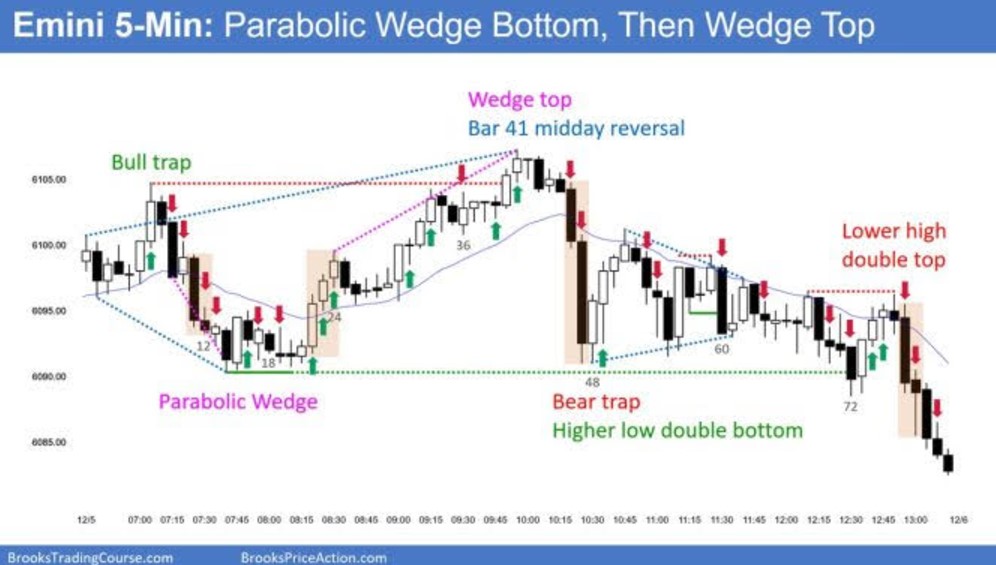
- Trading ranges always form a double top/bottom variation or a wedge top/bottom. There is often a breakout of the opening range that leads to a measured move lasting two legs and two hours.
- This means traders should look for one of the abovementioned patterns to form before placing a trade.
-
Overall, the key to trading the open is being patient and not rushing to place a trade.
Thursday's E-mini setups


