| This Week’s a.i. Stock Spotlight is Booking Holdings ($BKNG) |

Booking Holdings Inc., the powerhouse behind platforms like Booking.com, Priceline, and Kayak, continues to dominate the online travel industry. Since its inception in 1997 and public debut in 1999, the company has embraced a diverse revenue model, largely driven by commissions from accommodation and travel services. Its strategic acquisitions, including Kayak and OpenTable, reflect a robust growth trajectory, leveraging extensive market reach to fortify its standing against competitors such as Expedia and Airbnb.
The financial landscape for Booking Holdings illustrates a complicated narrative of resilience and strategic agility. The company has maintained a healthy balance sheet, marked by strong cash reserves and controlled debt levels, positioning it well for leveraging emerging market opportunities. Wall Street’s favor has remained steadfast, viewing Booking as a consistent performer adept at navigating the volatile travel sector landscape. But when you study the revenue and earnings table below you will quickly see how volatile its balance sheet has been over the last 5 years. Earnings are still 12% below 2019 levels but Revenue has grown 42% over the same time frame.
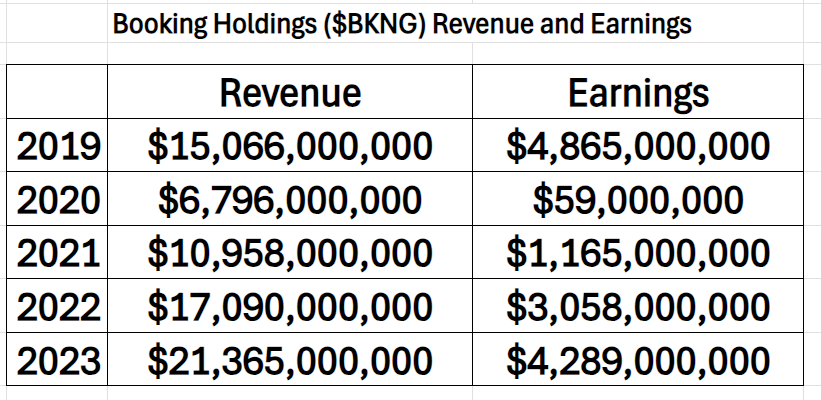
Recent trading sessions have seen Booking Holdings outperform broader market indices, a testament to investor confidence in its post-pandemic recovery strategy. However, the travel sector’s inherent volatility — susceptible to economic downturns and health crises — presents ongoing challenges. Yet, the rebound in global travel demand heralds a significant growth opportunity, with Booking poised to capitalize on the surge.
Delving into Booking Holdings, one finds a company steeped in innovation and customer-centric advancements. From pioneering online hotel bookings to investing in artificial intelligence for travel discovery, Booking has continuously evolved to meet the dynamic needs of global travelers. Its inclusion in the NASDAQ 100 underscores its financial clout and industry significance, mirroring its commitment to sustainable and expansive growth in the ever-evolving digital landscape.
Booking Holdings has shown impressive financial performance in its last two earnings calls for the second and third quarters of 2024. In the second quarter, the company reported revenues of $5.9 billion, marking a 7% increase from the previous year, while net income surged by 18% to reach $1.5 billion. Earnings per share rose significantly by 27% to $44.38. The company highlighted growth across its major brands, which include Booking.com, Priceline, and others, benefiting from increased travel demand and strategic investments in technology and marketing.
Moving into the third quarter, Booking Holdings continued its growth trajectory, with total revenues increasing by 9% year over year to $8 billion. A “connected trip” is a concept in the travel industry where multiple aspects of a journey are bundled together through a single platform, allowing travelers to plan, book, and manage various elements of their trip seamlessly. This can include accommodations, flights, car rentals, restaurant reservations, and activities, all organized through one interface. The goal is to provide a more integrated and streamlined travel experience, reducing the complexity of managing bookings from different sources and enhancing customer satisfaction by simplifying the travel process. Companies like Booking Holdings implement this strategy to increase convenience for travelers, hoping to encourage more frequent bookings and loyalty to their platforms by offering a more cohesive travel planning experience.
Booking Holdings is reaping the early rewards of its strategic expansion efforts, notably in its innovative “connected trip” concept, which melds various travel services into a unified user experience. This past quarter, the initiative celebrated a 40% surge in multi-service transactions, reflecting a keen consumer appetite for integrated travel planning. In parallel, Booking Holdings is pioneering in artificial intelligence, embedding A.I. across its platforms to refine user interactions and boost operational efficiency. Financial indicators are also robust, with significant upticks in room nights booked and overall revenue, buoyed by vigorous market activity in Europe and Asia — a testament to the company’s resilient growth trajectory and its bullish outlook on the global travel industry.
Overall, Booking Holdings’ recent earnings reflect a strong recovery trajectory in the travel sector, driven by persistent demand and strategic business adaptations. These results indicate robust financial health and a positive outlook for the company as it navigates a dynamic market environment.
In this stock study, we will look at an analysis of the following indicators and metrics which are our guidelines, and which dictate our behavior in deciding whether to buy, sell or stand aside on a particular stock.
- Wall Street Analysts Ratings and Forecasts
- 52 Week High and Low Boundaries
- Best-Case/Worst-Case Analysis
- Vantagepoint A.I. Predictive Blue Line
- Neural Network Forecast (Machine Learning)
- VantagePoint A.I. Daily Range Forecast
- Intermarket Analysis
- Our Suggestion
While we make all our decisions based upon the artificial intelligence forecasts, we do look at the fundamentals briefly, just to understand the financial landscape that $BKNG is operating in.
Wall Street Analysts Ratings and Forecasts

Based on 29 Wall Street analysts offering 12-month price targets for Booking Holdings in the last 3 months. The average price target is $4,956.29 with a high forecast of $5,550.00 and a low forecast of $3,874.00 .
We always suggest Power Traders pay very close attention to the variance between the most optimistic and most pessimistic forecasts. This variance at present time represents $1676 or 34% of the current price and is a marker for expected volatility over the next 12 months.
52 Week High and Low Boundaries

Ladies and gentlemen, let me share some seasoned wisdom with you: keeping an eagle eye on the 52-week high and low of a stock is fundamental to understanding its annual performance. This principle, that strength begets strength and weakness leads to further weakness, is not just a motto but a crucial strategy in trading.
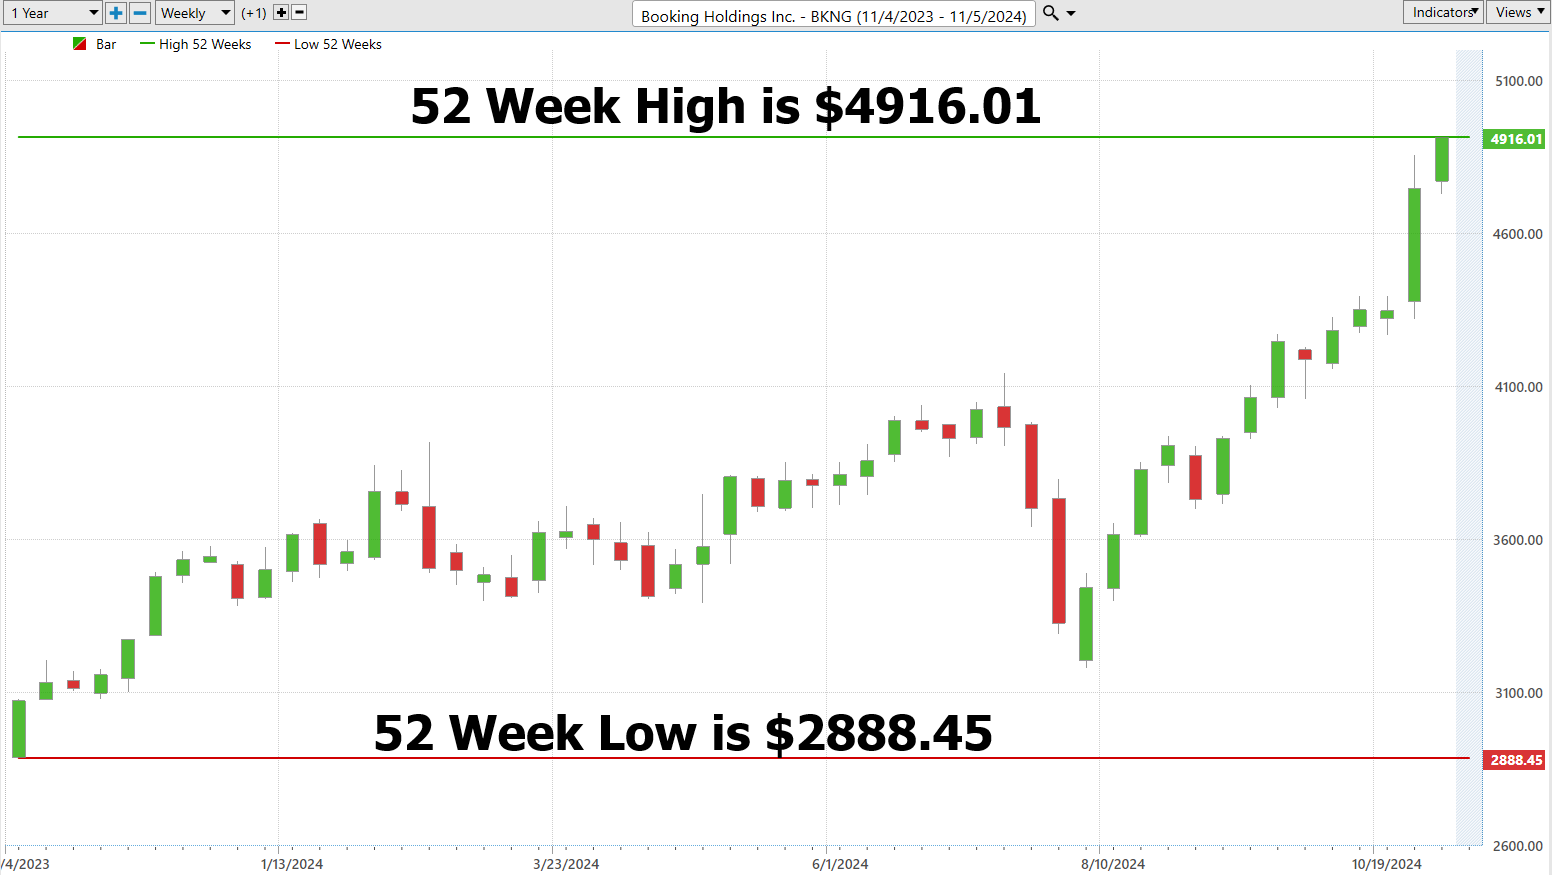
Look at Booking Holdings, symbol $BKNG. Over the past year, this stock has swung from a low of $2888.45 to a high of $4916.01 —a staggering range indicating significant volatility, with fluctuations amounting to $2027.56. That’s 41% of its recent closing price! Observing the 52-week chart of $BKNG offers us an invaluable snapshot of this tumultuous ride.
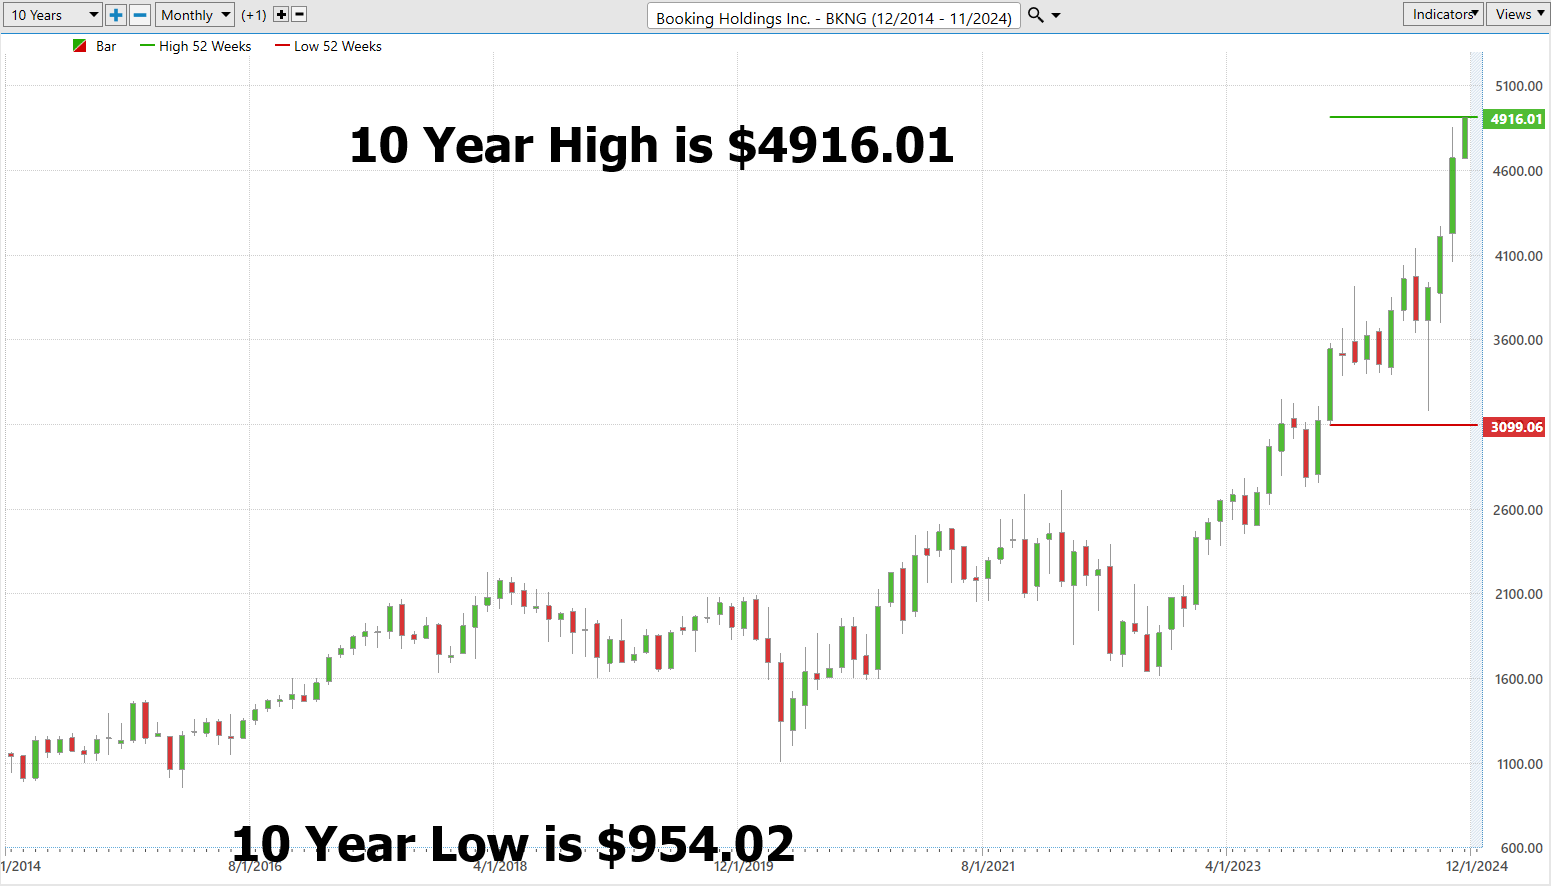
But to truly grasp the trajectory of $BKNG, one must broaden the lens to a decade of market action. Over these past ten years, $BKNG reached that same peak of $4916.01 but dipped as low as $954.02. It’s particularly telling when a stock not only hits a new 52-week high but also marks new decade-long records. Currently, $BKNG belongs to this elite category. An analysis of its 10-year chart reveals a striking detail — eight of the past twelve months have registered new decade highs, a clear testament to its breakthrough momentum.

This kind of historical perspective isn’t just academic — it’s a vital part of crafting a strategy that anticipates future movements rather than merely reacting to past performance.
Best-Case/Worst-Case Analysis
Volatility in the stock market often remains a nebulous concept for many traders, particularly those who find themselves on the losing end of trades. To truly understand the impact of volatility, one effective method is to examine the magnitude of the largest uninterrupted rallies and declines of a stock over the past year. For a stock like Booking Holdings ($BKNG), this analysis provides a clear illustration of the stock’s behavioral extremes, offering insights into the risk/reward parameters that shape potential trading strategies. By quantifying these significant movements, traders can better gauge the potential for future fluctuations and develop strategies that account for possible sharp increases or decreases in the stock’s price.
In a trading environment where many participants may rush into decisions without a comprehensive grasp of the risks and rewards involved, an in-depth look at past significant rallies and declines of a stock is crucial. This approach does more than simply measure volatility — it places it in a practical context that aids traders in visualizing how market dynamics can unfold during periods of extreme movement. For traders of $BKNG, studying these historical performance peaks and troughs is not just about preparing for similar future events; it’s about creating a robust framework that accommodates the full range of market sentiments, from optimism to pessimism. Such a strategy provides traders not only with the tools to navigate through volatile phases but also with the insights needed to exploit these phases for potential gains, all while maintaining a keen awareness of the risks involved.
First, we look at the largest uninterrupted rallies as the ‘best-case’ scenario.
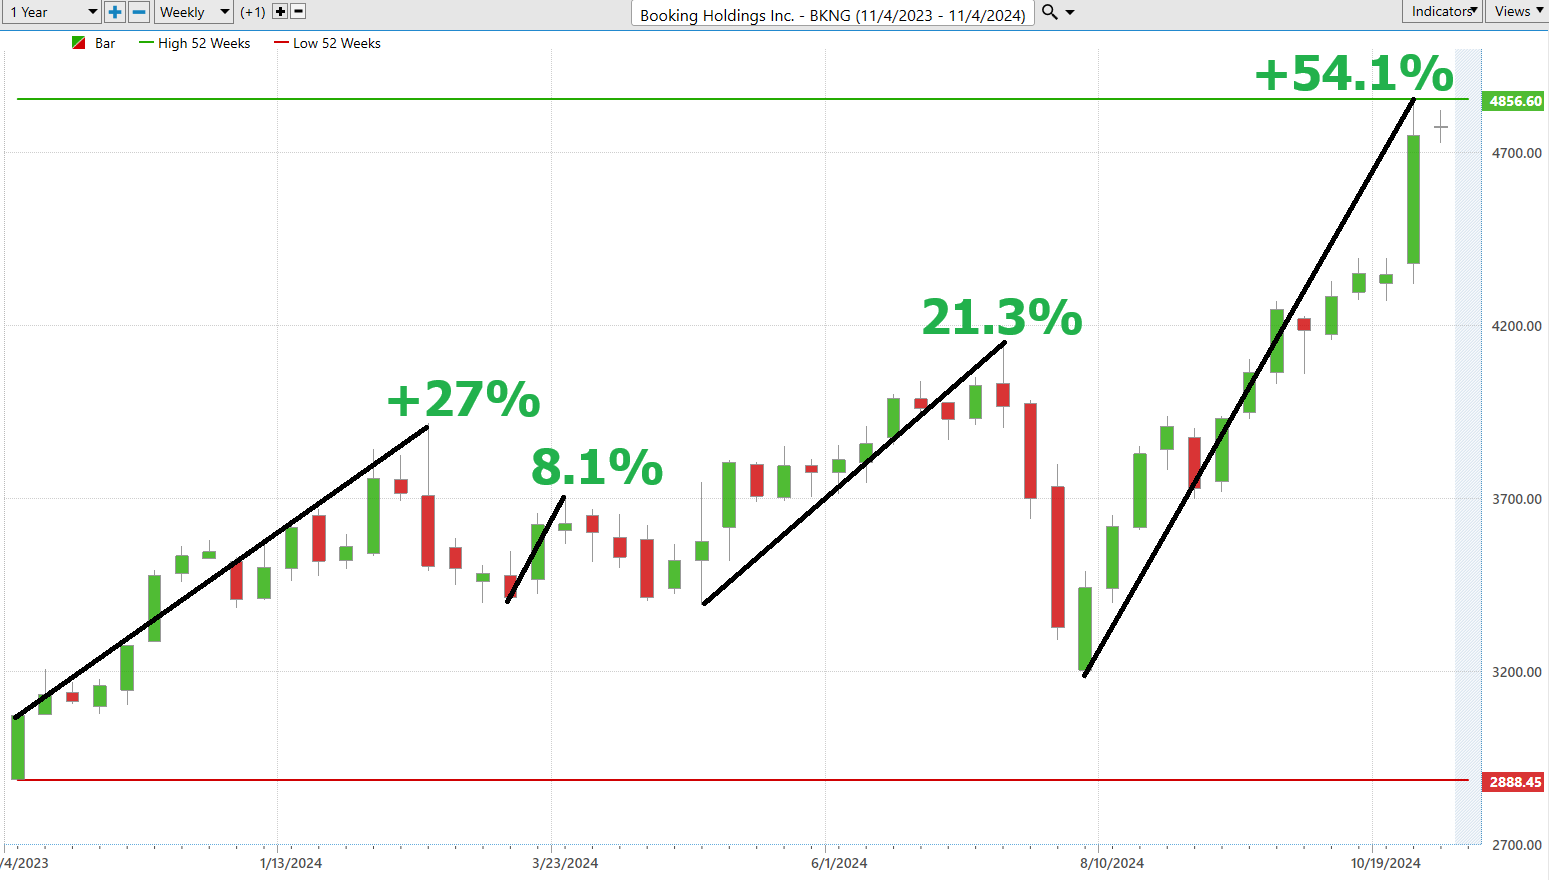
Next, we look at the largest uninterrupted declines over the past year as the ‘worst-case’ scenario.
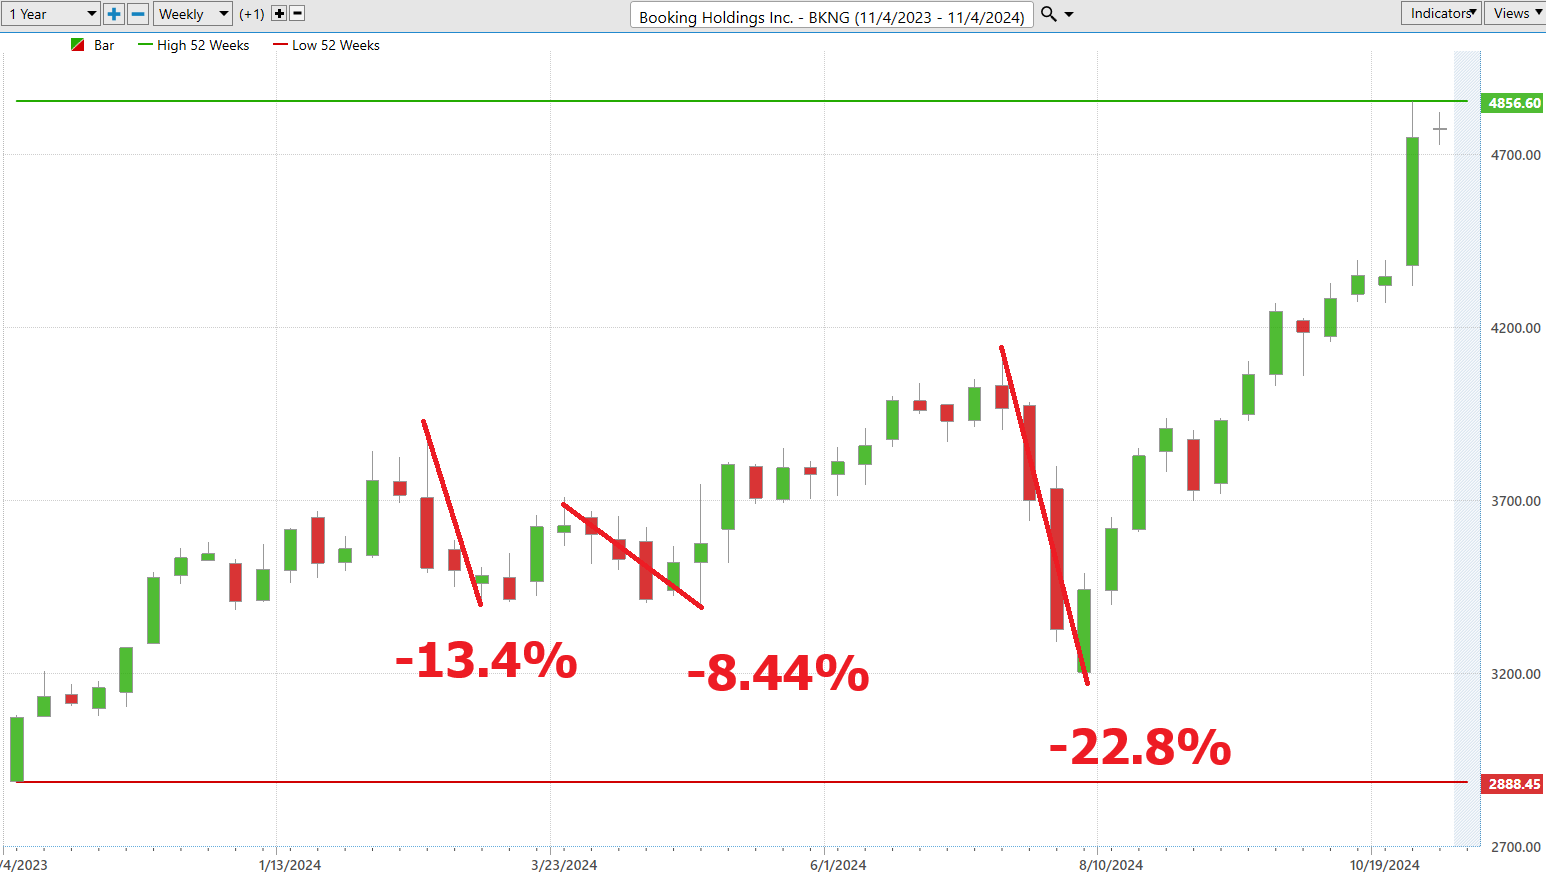
The dual charts of $BKNG not only outline the current bullish dominance but also underline the significant volatility inherent in its trading pattern — with potential declines ranging from 8.44% to 22.8% occurring within just a few weeks. This clear visualization underscores both the risks and rewards involved in trading $BKNG, providing traders with essential insights into its price dynamics.
But clearly the bulls are in control.
To further refine our understanding, we engage in a comparative analysis of $BKNG against broader market indices over various time frames. This methodical approach does more than juxtapose $BKNG against the backdrop of the general market — it sharpens our perspective on its relative strength or weakness. By examining how $BKNG aligns or deviates from overall market trends through different market conditions, we gain a deeper comprehension of its market behavior and strategic positioning. This comparative analysis is crucial for traders aiming to make informed decisions based on both micro movements within $BKNG and macro shifts within the global market landscape.
Vantagepoint A.I. Predictive Blue Line
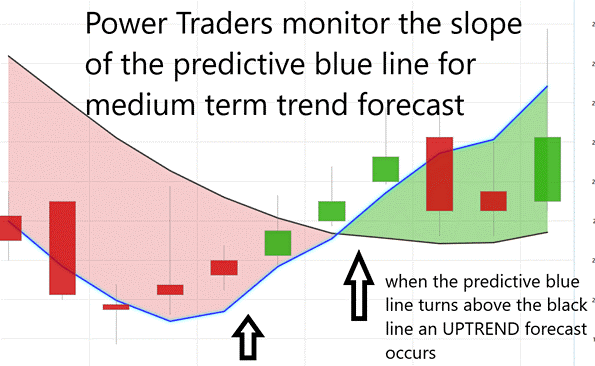
Peering into the cutting-edge realm of VantagePoint Software’s A.I.-driven forecasts for $BKNG, we find the strategic heart of the technology: the predictive blue line. This isn’t merely a line on a graph; it’s a confluence of artificial intelligence and sophisticated intermarket analysis, meticulously designed to spotlight emerging trends in $BKNG’s price action with extraordinary precision.
The blue line serves as a navigational beacon for the stock’s trajectory, offering insights that are crucial for strategic trading decisions. Here’s a breakdown of how to harness this tool effectively:
– Observing the slope of the blue line provides a directional cue, acting as a barometer for potential market movements.
– The ‘Value Zone’ emerges as a critical area. This is where the potential for buying becomes pronounced when the stock’s price nears or drops below this predictive line. Conversely, during a downtrend, a climb above this line might suggest a sell signal or an opportunity to adjust positions.
– A downward tilt of the blue line flags an alert for possible price declines, signaling that it might be prudent to hedge or scale back on exposure. This proactive approach allows traders to mitigate risk and capitalize on the market’s dynamism.
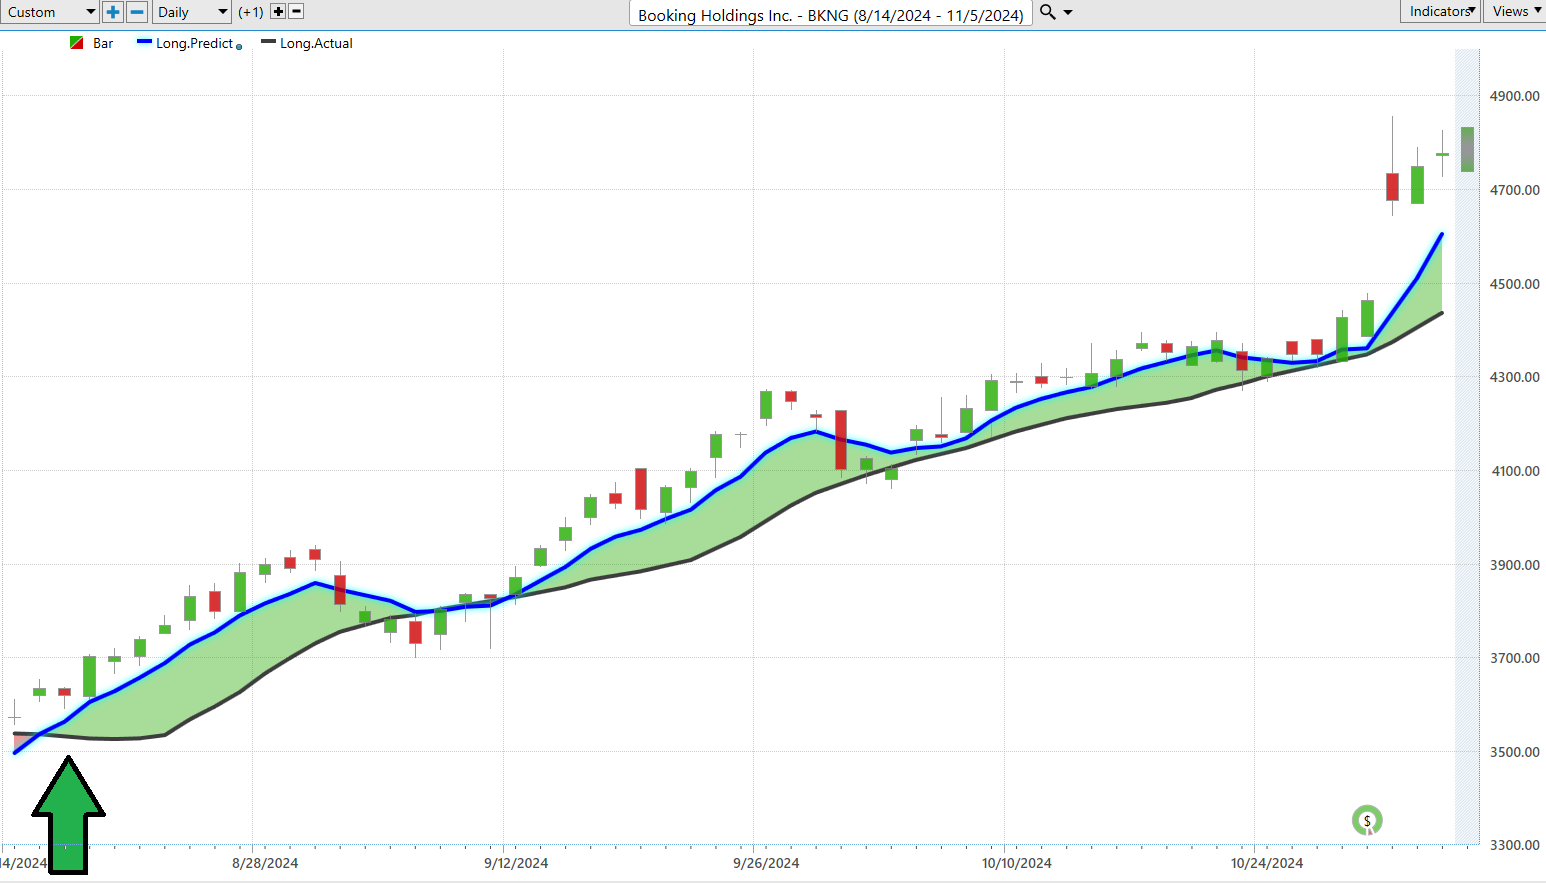
In the vanguard of trading technology, VantagePoint’s tool, powered by advanced A.I., doesn’t just predict market directions—it fine-tunes the timing of trades with a keen predictive edge. By emphasizing slope adjustments, this technology provides traders not merely with forecasts but with actionable insights, significantly enhancing their ability to make timely decisions. This isn’t merely data processing — it’s strategic foresight, transforming raw market data into a potent tool for traders looking to maximize returns. With its sophisticated algorithms, VantagePoint offers traders a sharper, more prepared approach to navigating market fluctuations, effectively turning volatility into opportunity.
Neural Network Forecast (Machine Learning)
Imagine a neural network as a supercharged brainstorming group, where each member, known as a node, collaborates in a vast network like the connections in our brains. These nodes handle and learn from huge volumes of data — ranging from stock prices to market trends — much like detectives sifting through clues to crack a case.
Why are neural networks a game changer for traders, especially the savvier ones in today’s fast-paced markets? They slice through the daily market noise to spot complex patterns that might slip past human analysis, pinpointing the best moments to buy or sell stocks. This isn’t about hunches; it’s about harnessing precise, data-driven insights that can lead to significant gains.
Neural networks revolutionize trading with their rapid processing, unmatched precision, and ability to learn continually, which reduces human errors and enhances predictive power. They equip traders with instant updates on market shifts, serving as a dynamic guide through what are often considered unpredictable financial waters.
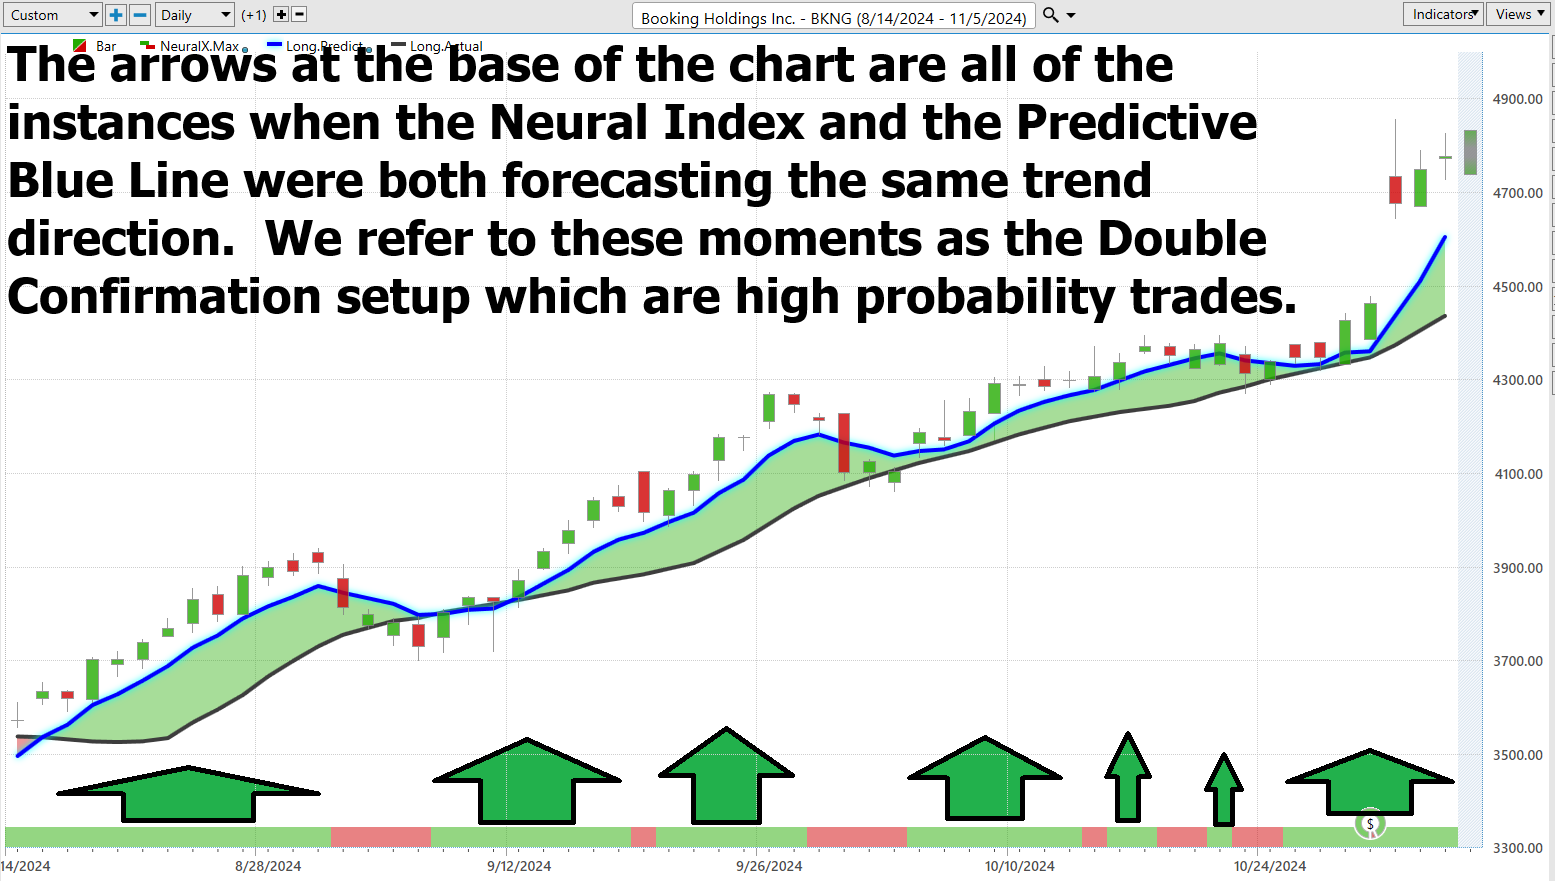
Consider the illustration below: It highlights moments when the neural index and the predictive blue line both point in the same direction, suggesting these are times with high potential for successful trades. These instances aren’t just lucky guesses; they are backed by the rigorous analysis of the neural network, making them prime opportunities for traders to capitalize on.
VantagePoint A.I. Daily Range Forecast
In the realm of trading, timing is not just a luxury — it’s the core of the game. For those in the Power Trader’s circle, the VantagePoint A.I. Daily Range Forecast stands out. This tool isn’t just another gadget in the arsenal; it’s revolutionary tech that sharpens traders’ ability to pinpoint the most lucrative moments to enter or exit trades — decisions that are pivotal to their success.
Market volatility is a given, a constant backdrop to trading. However, in today’s complex market environment, mere data is insufficient. To truly gain a competitive advantage, this data must be refined into actionable insights. This is where artificial intelligence, machine learning, and neural networks step in. Far from being just high-tech jargon, they are indispensable for slicing through the noise and delivering precise predictions.
The key challenge lies in deploying these insights effectively, adapting them dynamically to capture those crucial trading opportunities. VantagePoint’s A.I. software is designed precisely for this purpose, transforming vast amounts of market data into a digestible and actionable roadmap.
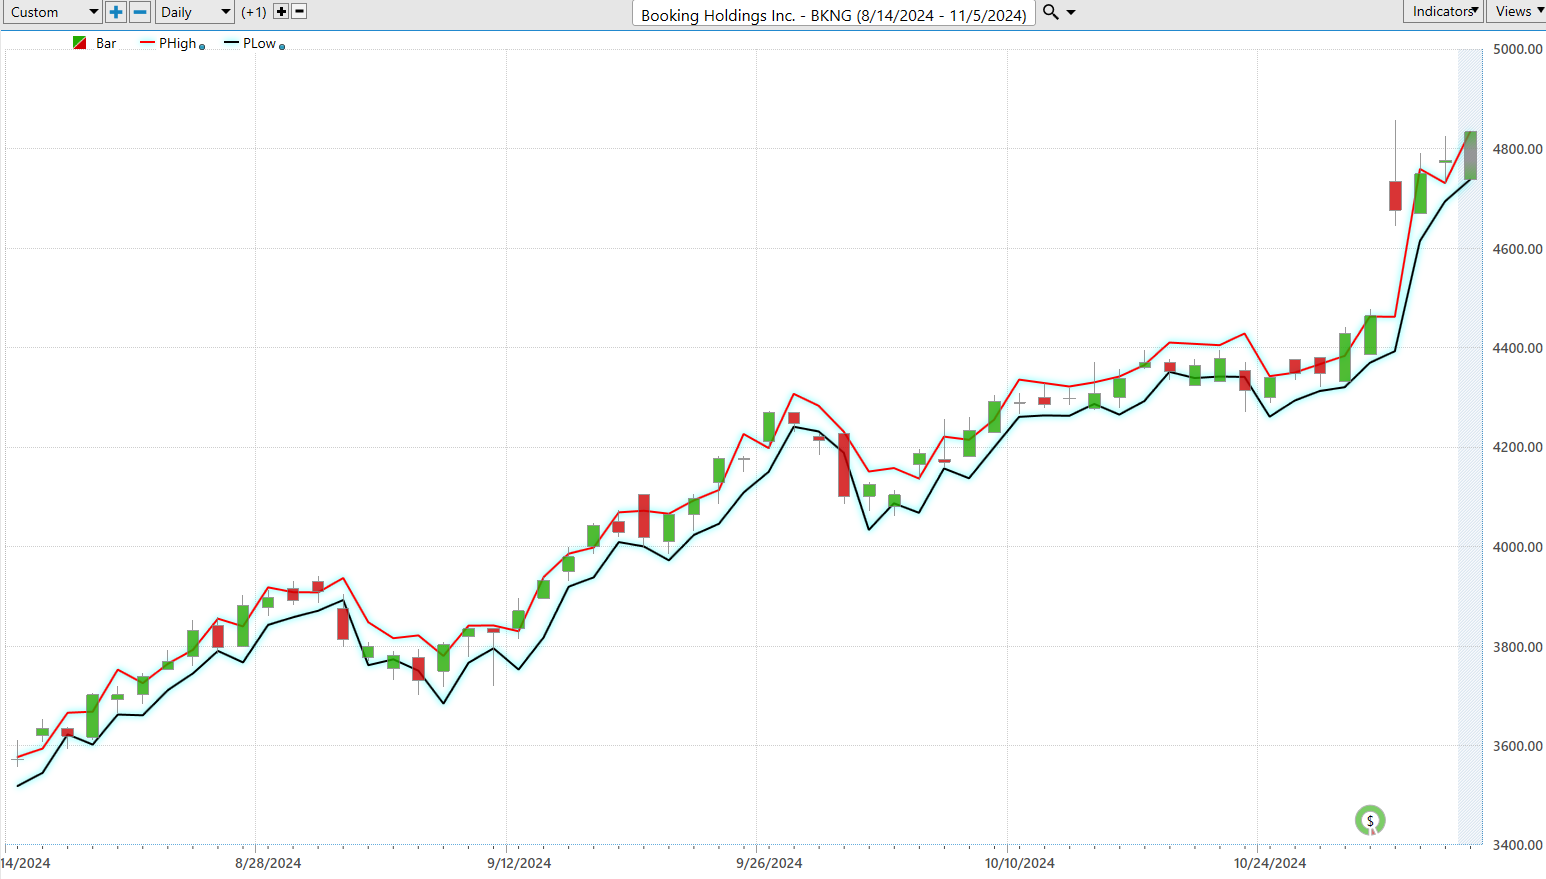
Let’s explore what this means for $BKNG, considering the daily, weekly, and monthly average trading ranges over the past year, all through the lens of VantagePoint’s predictive capabilities.

In trading, the crux of success lies in identifying the perfect moments to enter and exit the market. The Daily Range Forecast by VantagePoint A.I. transcends the typical chart; for the astute short-term swing trader, it serves as a predictive guide, delineating expected daily price movements with remarkable precision. In this high-stakes environment, accuracy is not merely a benefit—it’s imperative.
This tool, driven by the forefront of technological innovation, meticulously unravels the nuances of each trading session, directing traders through the day’s inherent volatility towards those optimal trading junctures. Take a moment to examine the chart below, where the trend lines and projections are clearly marked, offering a visual testament to the tool’s predictive prowess and its utility in strategic trading decision-making.
Intermarket Analysis
Imagine the global financial markets as a sophisticated ballet, a dynamic performance where every element influences the next. This is the essence of intermarket analysis—a methodical approach that examines the relationships between stocks, bonds, commodities, and currencies. Rather than viewing these assets in isolation, this discipline explores how they collectively interact, revealing the profound impact of one market’s movements on another. For instance, an uptick in gold prices isn’t just a concern for commodity traders; it can also herald significant shifts across equity and currency markets, offering astute traders a glimpse into impending changes.
Pioneers like John Murphy and Louis Mendelsohn have significantly advanced this field. Murphy’s work demonstrated how these different markets are not merely adjacent to each other but rather form an interconnected network, where developments in one can ripple through the others. Mendelsohn expanded on this by integrating artificial intelligence with traditional intermarket analysis through his software, VantagePoint. This innovation employs A.I. to sift through vast datasets, enhancing the predictive capabilities of market trend analyses. Their contributions have transformed intermarket analysis from a mere analytical tool into a crucial perspective that uncovers the intricate patterns underpinning global finance.
Intermarket analysis is a vital tool for traders, providing them with a comprehensive view of the global marketplace. This method allows traders to understand the complex web of interactions between various markets, empowering them to make more informed decisions.
Here are the 31 key drivers of $BKNG’s price:
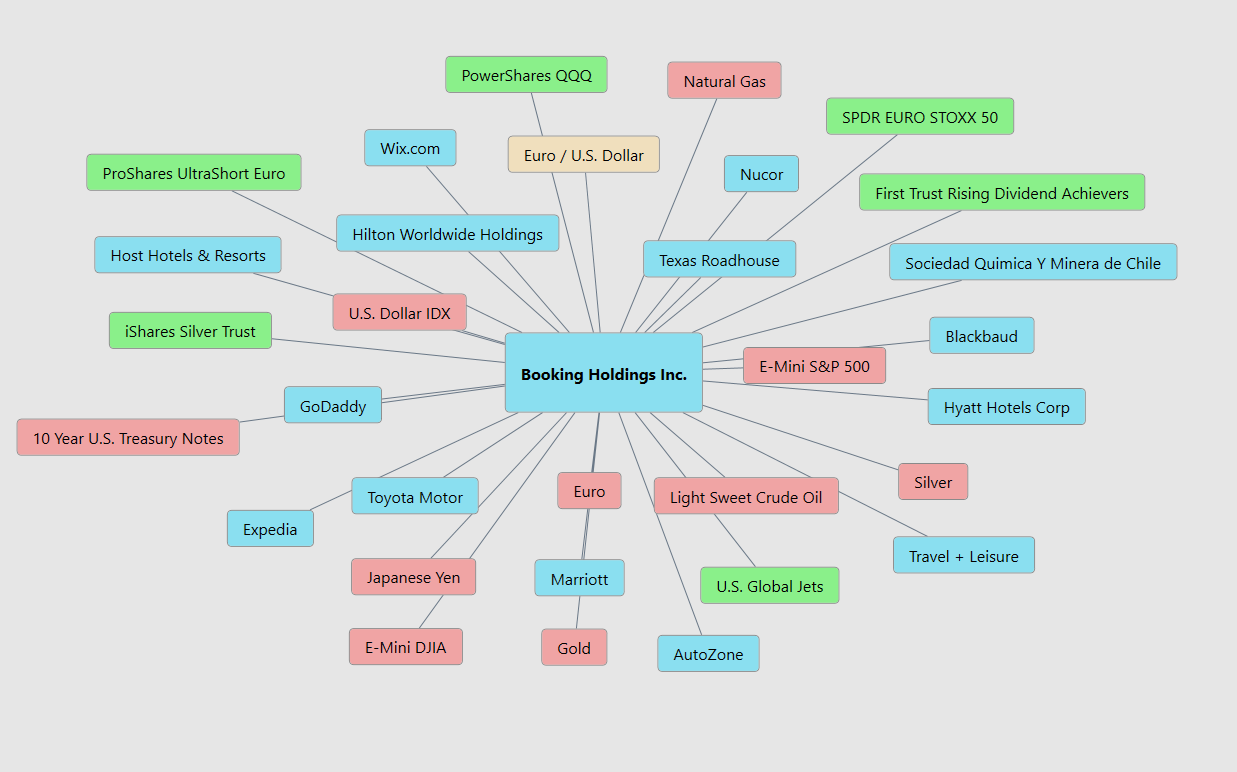
Intermarket analysis reveals how external economic factors such as crude oil prices, interest rates, and currency values directly influence the travel industry, affecting companies like Booking Holdings Inc. ($BKNG) and Marriott Hotels.
Fluctuating oil prices can alter air travel costs, thereby influencing travel decisions and impacting bookings on platforms like Booking.com. Variations in interest rates affect consumer spending power and propensity to engage in travel, while currency strength dictates the affordability of international travel for consumers, influencing their choices in booking destinations and accommodations, including hotels like Marriott. Understanding these interconnected factors allows companies in the travel sector to strategize effectively, adapting to economic shifts to maintain steady customer flow and revenue .
Our Suggestion
Booking.com is spearheading enhancements to its platform with A.I.-driven features aimed at refining the travel planning process. Through innovations like Smart Filter, Property Q&A, and the nascent Review Summaries, Booking.com leverages Generative A.I. to streamline and personalize the search and booking experience.
This suite of tools, which is already live in several English-speaking countries will become international in the coming years and promises to change how travelers book travel online. In Booking Holdings’ third quarter of 2024 earnings call, the company reported positive financial results that exceeded expectations. CEO Glenn Fogel highlighted significant top-line growth, particularly in Europe, which contributed to an 8% year-over-year increase in room nights booked and a 9% rise in revenue, reaching $8 billion.
The company’s success was attributed to the strength of the underlying business and the health of the travel industry overall.
Looking forward, Booking Holdings remains optimistic about continued growth, especially given the resilient demand for travel. The company is focused on advancing its connected trip vision and further developing its A.I. capabilities to enhance the travel booking experience. They also emphasized the importance of being a valuable partner to accommodation providers, particularly small independents, by delivering incremental demand and developing supportive features and products.
$BKNG deserves to be on your watchlist. It will offer numerous great trading opportunities in the coming year.
Practice good money management on all your trades.
Rely on artificial intelligence for shorter term trend guidance.
It’s not magic.
It’s machine learning.
Disclaimer: THERE IS A HIGH DEGREE OF RISK INVOLVED IN TRADING. IT IS NOT PRUDENT OR ADVISABLE TO MAKE TRADING DECISIONS THAT ARE BEYOND YOUR FINANCIAL MEANS OR INVOLVE TRADING CAPITAL THAT YOU ARE NOT WILLING AND CAPABLE OF LOSING.
VANTAGEPOINT’S MARKETING CAMPAIGNS, OF ANY KIND, DO NOT CONSTITUTE TRADING ADVICE OR AN ENDORSEMENT OR RECOMMENDATION BY VANTAGEPOINT AI OR ANY ASSOCIATED AFFILIATES OF ANY TRADING METHODS, PROGRAMS, SYSTEMS OR ROUTINES. VANTAGEPOINT’S PERSONNEL ARE NOT LICENSED BROKERS OR ADVISORS AND DO NOT OFFER TRADING ADVICE.

