
| This Week’s a.i. Stock Spotlight is Peloton Interactive ($PTON) |
Peloton ($PTON) Interactive, Inc., commonly known as Peloton ($PTON), was founded in 2012 and is headquartered in New York City. It provides innovative hardware, software, and content that offers immersive workout experiences at home, outdoors, or in the gym. Peloton ($PTON) has expanded its presence to several countries, including the US, UK, Canada, Germany, Australia, and Austria, boasting millions of members globally. At the heart of Peloton’s ($PTON) innovation lies a corporate culture that melds technology with design, setting the stage for a suite of interactive fitness equipment that’s not just functional but revolutionary. Peloton ($PTON) pioneered integrating social connectivity into home workout gear, allowing users to experience communal classes from the isolation of their homes — an approach bolstered by original content that rivals professional studios in quality. With several patents in interactive technology and a business model centered around a vibrant, interactive community, Peloton ($PTON) offerings transcend traditional exercise, creating a digitally connected ecosystem that’s as socially engaging as it is physically challenging.
Peloton ($PTON) generates revenue primarily through the sale of fitness equipment like stationary bicycles and treadmills, which are integrated with a subscription-based digital media service offering exercise classes. Their flagship product, the Peloton ($PTON) Bike, has been a significant revenue driver, complemented by subscription fees for access to their premium fitness content. Peloton ($PTON) Interactive has recently seen its shares rally after exceeding financial expectations and announcing pivotal changes in leadership, with the stock price climbing to a peak of $8.92 last week. This marked its highest level since July 2023 and a substantial 220% increase from its lowest point this year.
Peloton ($PTON), once celebrated as a corporate titan with a valuation nearing $50 billion, witnessed a stark 98% decline, bottoming out around $1 billion amid growth and sustainability concerns. Yet, the narrative around Peloton ($PTON) is changing. Buzz about potential acquisition interest has helped rejuvenate its stock. This resurgence is largely attributed to the release of promising financial data and the introduction of Peter Stern as the new CEO. Stern, a seasoned executive with stints at Ford, Apple, and Time Warner, brings a wealth of experience that analysts believe could drive Peloton ($PTON) towards a more profitable horizon.
Peloton ($PTON)’s latest financials reveal a mixed picture: while membership dipped slightly from 6.4 million to 6.2 million year-over-year, and paid fitness subscriptions fell by 2% to 2.9 million, the company managed to improve its gross margin from 47.9% to 51.8% — a testament to strategic pricing adjustments on its equipment offerings. The most telling figure, however, may be the dramatic reduction in net losses, down to just $0.9 million from $159 million a year ago. Moreover, Peloton ($PTON) is executing a cost reduction plan expected to save $200 million annually by cutting 400 jobs and scaling back on marketing and contractor expenses.
This pivot from growth to profitability mirrors strategies employed by other tech firms like Carvana, which have successfully rebounded by tightening operational efficiencies. Despite these positive steps, challenges remain. Peloton ($PTON)’s core revenue from connected fitness products has declined by 12% to $159 million, indicating a possible saturation in its hardware market. The outlook suggests modest revenue growth with projections slightly up at $2.49 billion for the next fiscal year, from $2.47 billion.
Analysts are now adjusting their views on Peloton ($PTON), with some upgrading their ratings based on its improved financial outlook and cash management projections for 2025, which are anticipated to top the company’s own forecasts. However, when you look at their revenue and earnings over the last five years you see a picture which very clearly shows that the company is still unprofitable. What has Wall Street excited is that the company has a new CEO and they are not losing as much money as they have in the past, so this narrative is very mesmerizing. But facts are facts, and the cold hard truth is that over the last 5 years $PTON has lost $4.9 billion cumulatively and never registered a profit.
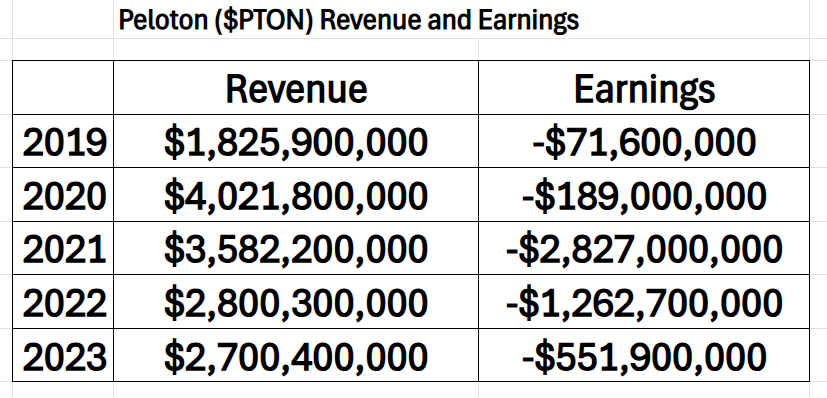
Is this a striking turnaround? Peloton ($PTON)’s recent quarterly results signal a recovery, marked by exceeded financial forecasts and a commendable surge in free cash flow. This shift is a stark contrast to the pandemic era, where misguided expansion led to operational bloat. Now, Peloton ($PTON) has recalibrated, focusing on cost efficiency and a lucrative subscription model. The strategy involves trimming production to meet actual demand and maximizing profits from high-margin services. This prudent approach has stabilized the company’s finances, ensuring a path to sustainable growth amidst a challenging economic landscape.
Peloton ($PTON) became a public company in 2019, and its path to profitability has been closely monitored by investors. Initially, the company benefited from a surge in demand during the COVID-19 pandemic but faced challenges as the global situation normalized. Recently, Peloton ($PTON) reported a smaller loss per share for the first quarter of fiscal 2025 compared to the same period last year, indicating some stabilization in its financials. Peloton ($PTON)’s business model revolves around high-quality, tech-driven home exercise equipment paired with a subscription service, positioning it uniquely in the fitness industry. The biggest opportunity lies in expanding its subscription base and enhancing digital offerings. Conversely, the primary risks include market saturation for high-end exercise equipment and the challenges of maintaining subscription growth post-pandemic.
In the last month, Peloton ($PTON) has shown a robust initiative to refine its cost structure and enhance profitability. This includes partnership strategies like the recent collaboration with Costco to offer its Bike+ at select locations, aimed at boosting sales during the holiday season. Furthermore, Peloton ($PTON) is actively managing its debt, as evidenced by a recent refinancing effort where it announced a comprehensive $1.35 billion refinancing plan to improve its financial flexibility.
Peloton ($PTON) faces stiff competition from other fitness equipment manufacturers like NordicTrack and Nautilus, as well as from emerging digital fitness platforms such as Mirror by Lululemon. While it has been a leader in connected fitness, maintaining this position requires constant innovation and effective marketing.
Wall Street’s perception of Peloton ($PTON) has been cautious, with recent analyst ratings reflecting a hold position due to the company’s ongoing transformations and market conditions. However, with strategic hires from prominent companies and efforts to penetrate new markets and demographics, Peloton ($PTON) is actively working to solidify its leadership in the connected fitness industry.
In this weekly stock study, we will look at an analysis of the following indicators and metrics which are our guidelines which dictate our behavior in deciding whether to buy, sell or stand aside on a particular stock.
- Wall Street Analysts Ratings and Forecasts
- 52 Week High and Low Boundaries
- Best-Case/Worst-Case Analysis
- Vantagepoint A.I. Triple Cross Indicator
- Neural Network Forecast (Machine Learning)
- VantagePoint A.I. Daily Range Forecast
- Intermarket Analysis
- VantagePoint A.I. Seasonal Analysis
- Our Suggestion
While we make all our decisions based upon the artificial intelligence forecasts, we do look at the fundamentals briefly, just to understand the financial landscape that $$PTON is operating in. The majority of our trade forecasts will last from a few days to a few months.
Wall Street Analysts Ratings and Forecasts

Over the past three months, 18 Wall Street analysts have set a range of 12-month price targets for Peloton Interactive. The consensus points to an average target of $8.28, with the most optimistic analyst projecting a high of $20.00 and the most cautious predicting a low of $4.00. This spread underscores the diverse perspectives on Peloton’s market trajectory amid evolving industry dynamics.
We always advise traders to pay very close attention to the variance between the most bullish and most bearish forecasts. This value is the expected volatility moving forward. You can see in the graphic above that this variance of $16 represents 193% of the current price. Top analysts are telling us that the expected volatility is extremely high.
52 Week High and Low Boundaries

We advise traders to pay careful consideration to the trading range of the previous 52 weeks. This value is the historical volatility, and it tells us that should the future be like the past we can expect prices to be 75% higher and or lower from where we currently stand. This expectation is also considered to be extremely high.
We always suggest traders analyze the 52-week chart to understand the trajectory the stock has had over the past year.
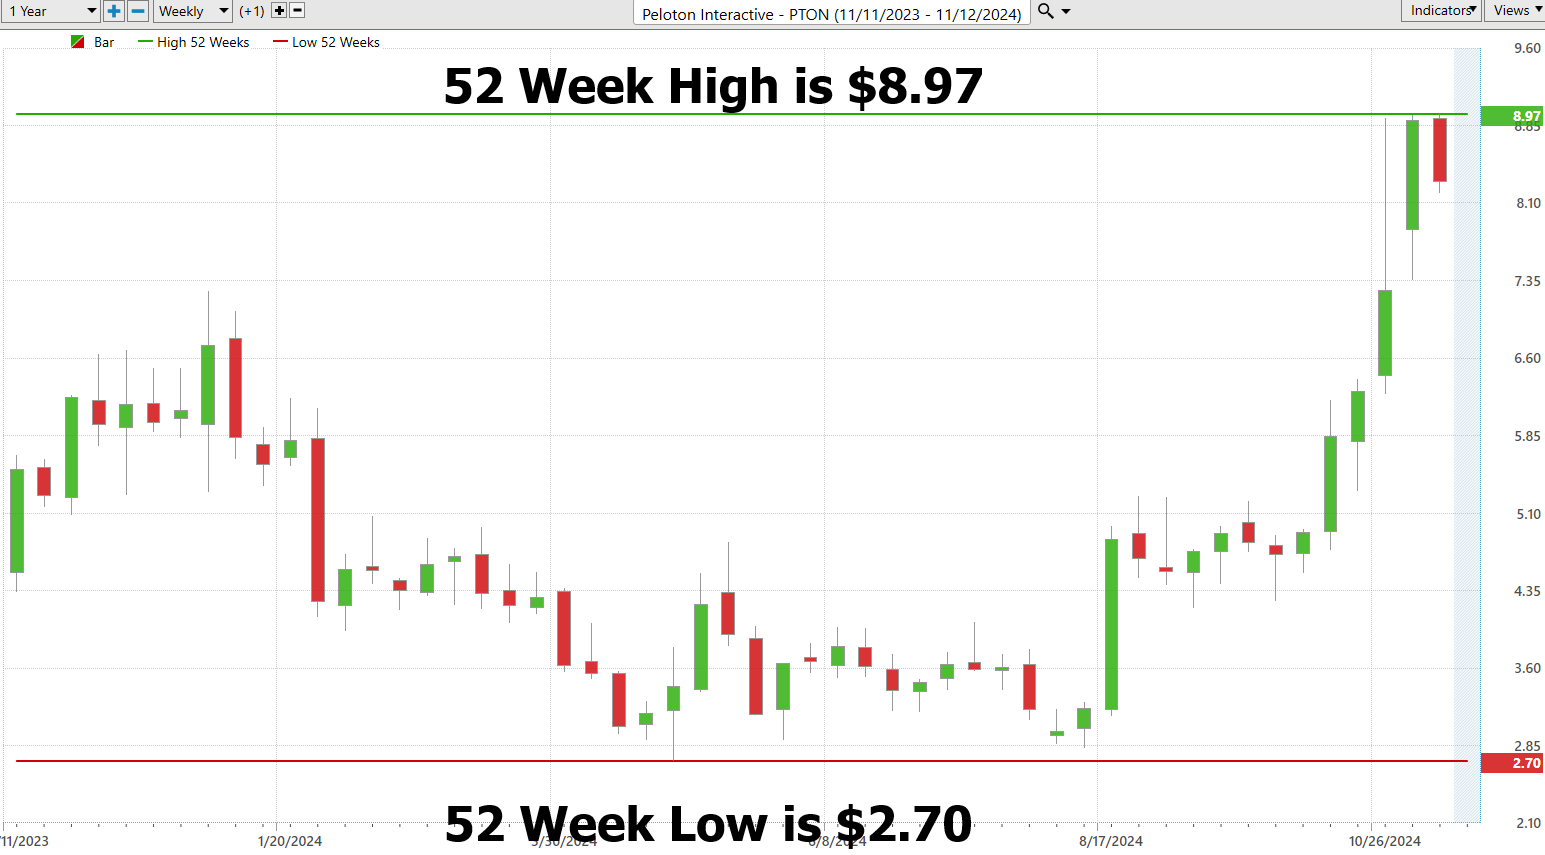
Traders often focus on the 52-week high and low boundaries of stocks because these levels can serve as indicators of underlying strength or weakness. A stock persistently pushing against its 52-week high suggests a momentum that could continue to drive its price upward as strength begets strength. Conversely, a stock frequently testing its 52-week low may signal sustained selling pressure. Peloton Interactive exemplifies this dynamic, having rebounded impressively from its 52-week lows 14 weeks ago, surging over 232% on robust volume, showcasing the resilience and potential for continued upward momentum.
But to truly understand the most recent rally we also advise that traders always zoom out and look at the longer-term trend of $PTON since it went public in 2019. You will observe two details. The recent rally while impressive on the shorter term charts is completely inconsequential on the long term trajectory. $PTON lost 98% of its value in 2021 post pandemic when the economy began to re-open. The stock is still down 95% from its all-time highs.
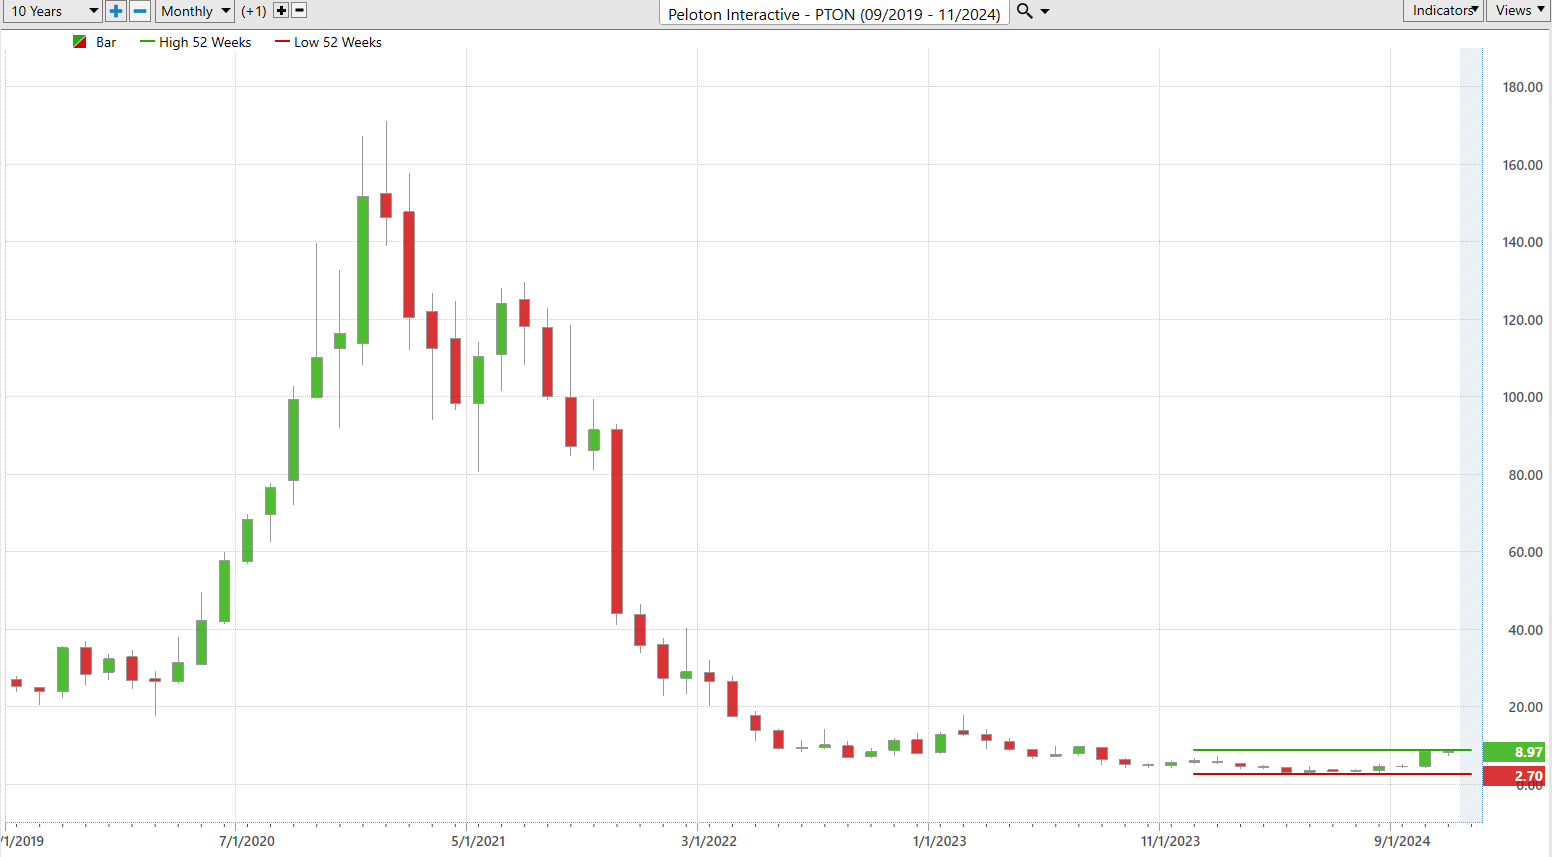
What this tells us is that regardless of the Wall Street narrative of being excited about a new CEO and a turnaround, $PTON is a short term, hit and run, swing trading stock for us.
Best-Case/Worst-Case Analysis
The most effective method to gauge the risk and potential reward of an asset is by analyzing its performance history over the last year. By assessing the extent of the largest unbroken rallies and declines during this period, investors can obtain a clear picture of what the asset has endured and achieved. This historical perspective helps in setting realistic expectations for both risk and reward, providing a balanced view of the asset’s volatility and growth potential.
Should the asset’s future movements mimic its recent historical performance, investors can establish well-informed expectations. For instance, if the trends of significant rises and falls persist, this understanding can offer predictive insights, enabling investors to strategize accordingly. This approach not only helps in anticipating future trends but also in making decisions that align with one’s risk tolerance and investment goals, ultimately crafting a more resilient investment strategy.
First, we look at the largest uninterrupted rallies as the ‘best-case’ scenario.
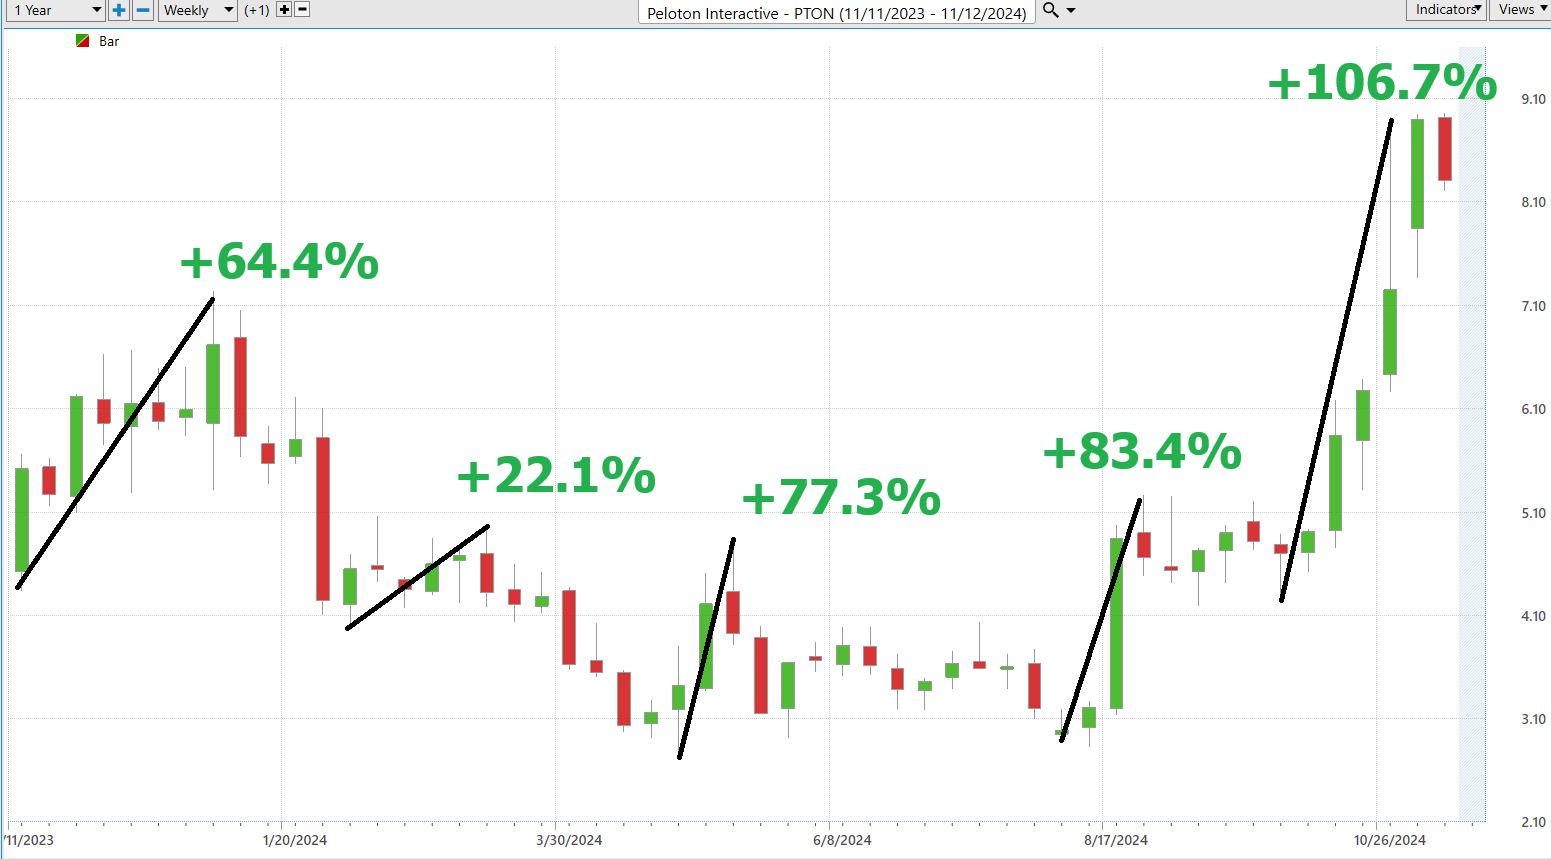
Followed by the worst-case analysis where we measure the magnitude of the largest uninterrupted declines:
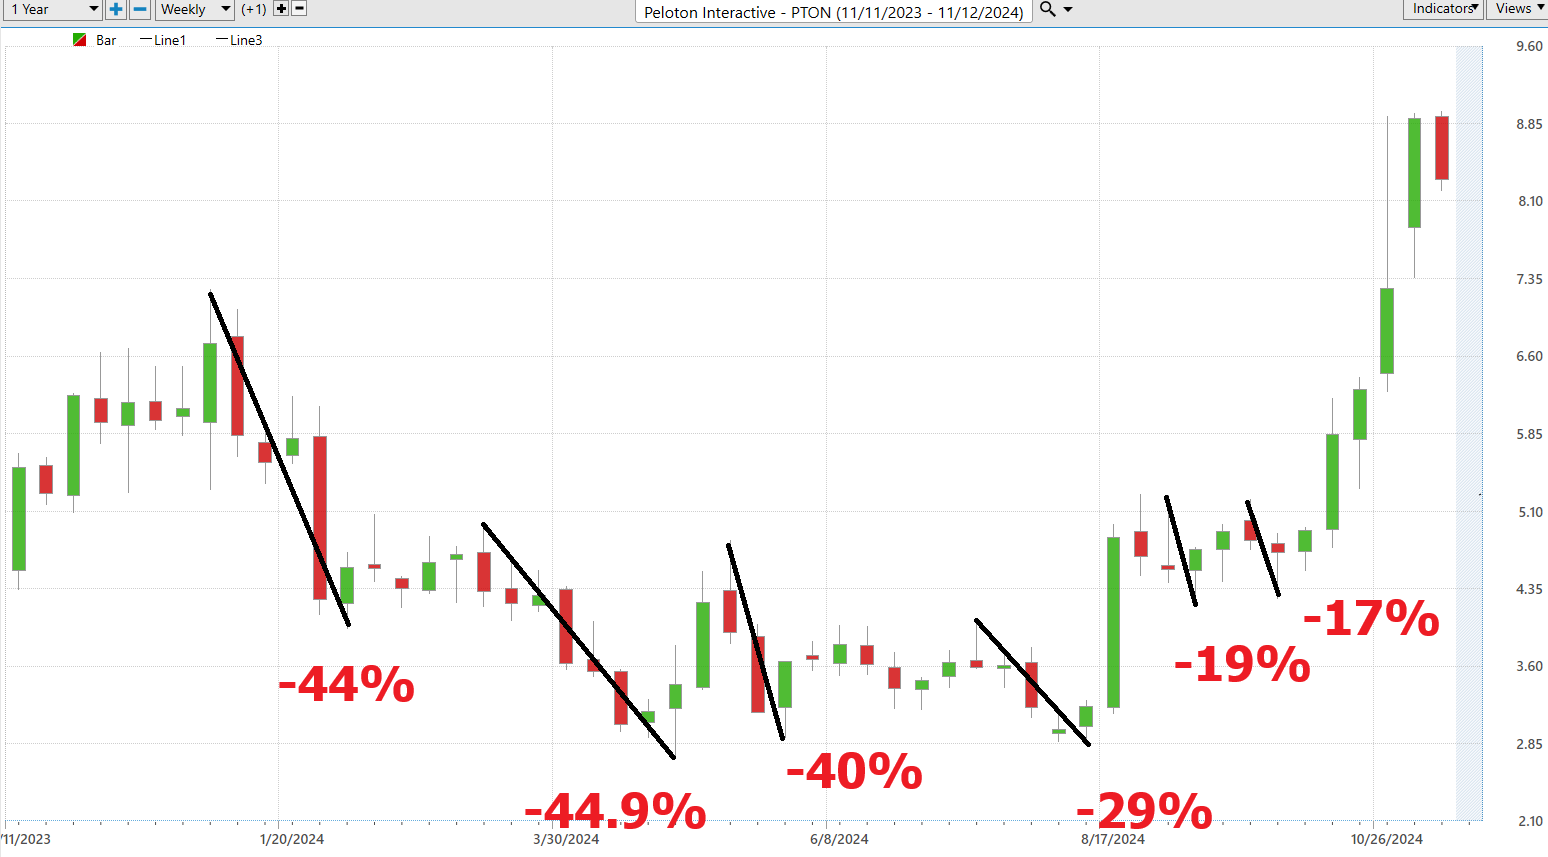
The dual charts of Peloton ($PTON) not only outline the current bullish dominance but also underline the significant volatility inherent in its trading pattern — with potential declines as high as 44.9% occurring within just a few weeks. This clear visualization underscores both the risks and rewards involved in trading Peloton ($PTON), providing traders with essential insights into its price dynamics.
The evidence is undeniable: the bulls have seized the reins.
To deepen our comprehension, we perform a comparative analysis of Peloton ($PTON) against broader market indices across various timelines. This disciplined examination does more than simply compare Peloton to the wider market — it refines our insight into its relative strength or weakness. By scrutinizing Peloton’s alignment or divergence from the broader market trends under diverse conditions, we unlock a more profound understanding of its market behavior and strategic placement. This kind of comparative analysis is indispensable for traders committed to making well-informed decisions that account for both Peloton’s specific movements and broader global market shifts.

$PTON has outperformed the broader market indexes across all time frames. A large reason for this is that several top analysts have upgraded their forecasts and feel very positive about the new CEO who will be taking the reins of the company.
The 5-year beta of Peloton Interactive ($PTON) is 1.93 . This value indicates that Peloton’s stock is 93% more volatile than the market average. A beta value higher than 1 means that the stock’s price tends to move more than the market does: if the market goes up or down, Peloton’s stock is likely to go up or down more sharply. This can mean higher risk, but also the potential for higher rewards if the stock moves favorably relative to the market. Think of beta like a sensitivity meter; the higher the beta, the more sensitive the stock is to market changes. If the market feels a bump, a stock like Peloton with a high beta feels more of a shake.
Vantagepoint A.I. Triple Cross Indicator
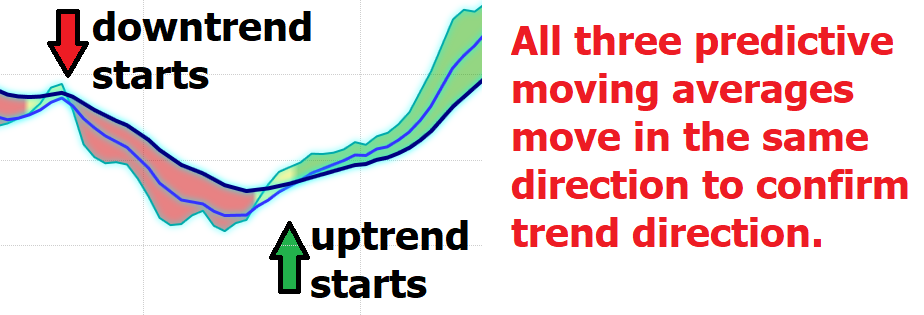
In the fast-paced realm of stock trading, the capacity to discern emerging trends is paramount, particularly for volatile stocks like Peloton ($PTON). Here, the “Triple Cross” strategy, a sophisticated tool from VantagePoint A.I., plays a critical role. It leverages three predictive moving averages—spanning short (3-day), medium (8-day), and long (18-day) terms—to provide early alerts on potential trend reversals, giving traders a nearly prophetic view into upcoming market shifts.
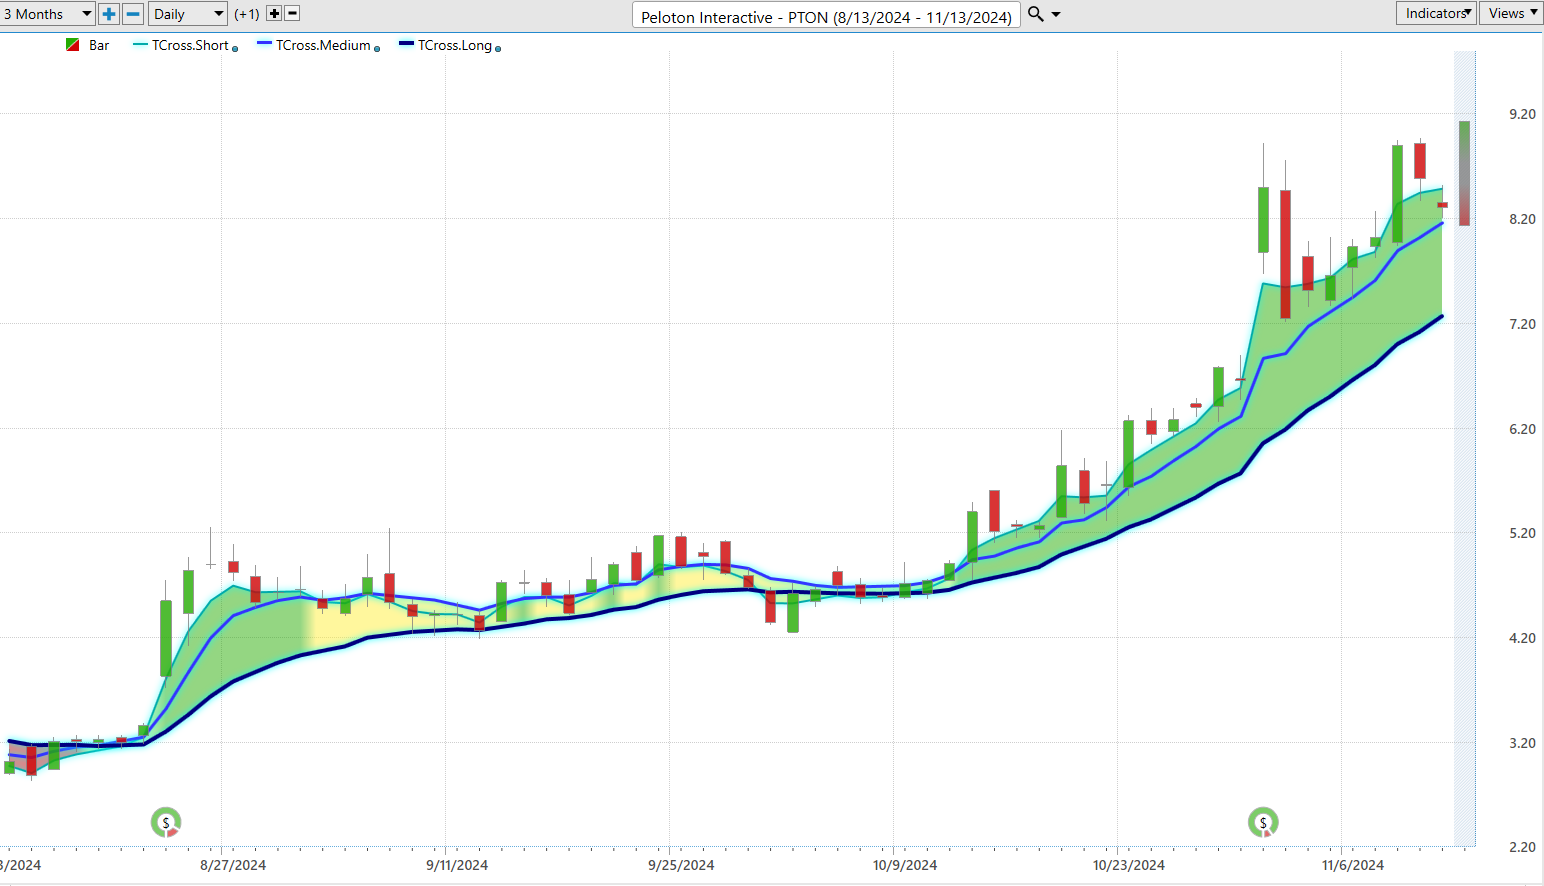
What sets the Triple Cross strategy apart is its blend of accuracy and restraint. Instead of reacting hastily to the first signs of trend changes, it waits for alignment across all three timeframes, ensuring a robust confirmation before signaling a shift. This deliberate patience helps filter out market noise, offering clear, reliable trading signals. This strategy is not just another tool; it functions as a vigilant guardian of your trading strategy, reinforcing decisions with triple-confirmed data, thus significantly enhancing the quality and precision of trade engagements. This approach not only bolsters a trader’s confidence but also meticulously guards against premature, risky decisions, positioning the Triple Cross as more than just an indicator — it’s an essential ally in navigating the turbulent waters of stock trading.
Neural Index (Machine Learning)
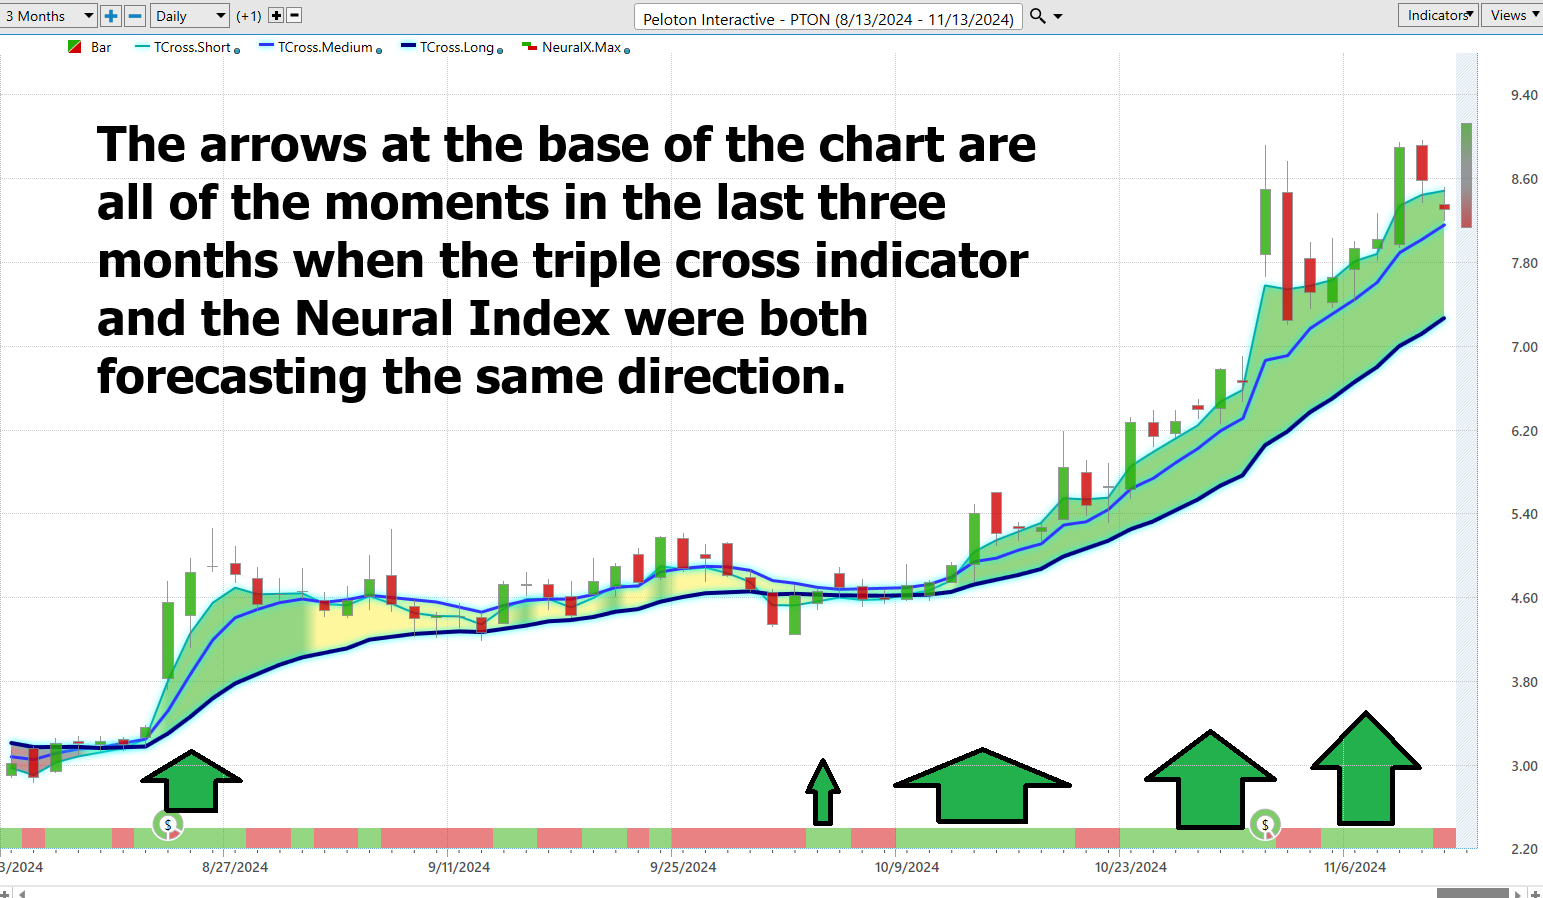
Neural networks in trading represent a sophisticated application of artificial intelligence, mimicking the human brain’s capacity to process information and learn from it. These systems delve deep into vast pools of market data to forecast future price trajectories. Constructed with multiple layers of ‘neurons,’ each layer processes a segment of the data, continually enhancing its connections based on learning, thus refining its predictive precision incrementally.
Traders develop these neural networks through intensive training on large datasets, including historical price trends and various market indicators. This continuous cycle of analysis and adjustment allows the neural network to hone its forecasting abilities by aligning its internal architecture to more effectively recognize patterns in data. In the trading arena, tools like the Neural Index Indicator provide essential signals, much like a traffic light, indicating the strength or weakness of market conditions. Used in conjunction with analytical tools like the Triple Cross Indicator, traders can identify prime trading opportunities with enhanced accuracy. This blend of cutting-edge analysis tools not only sharpens precision in trading but also supports traders in making informed, strategic decisions in fast-moving markets.
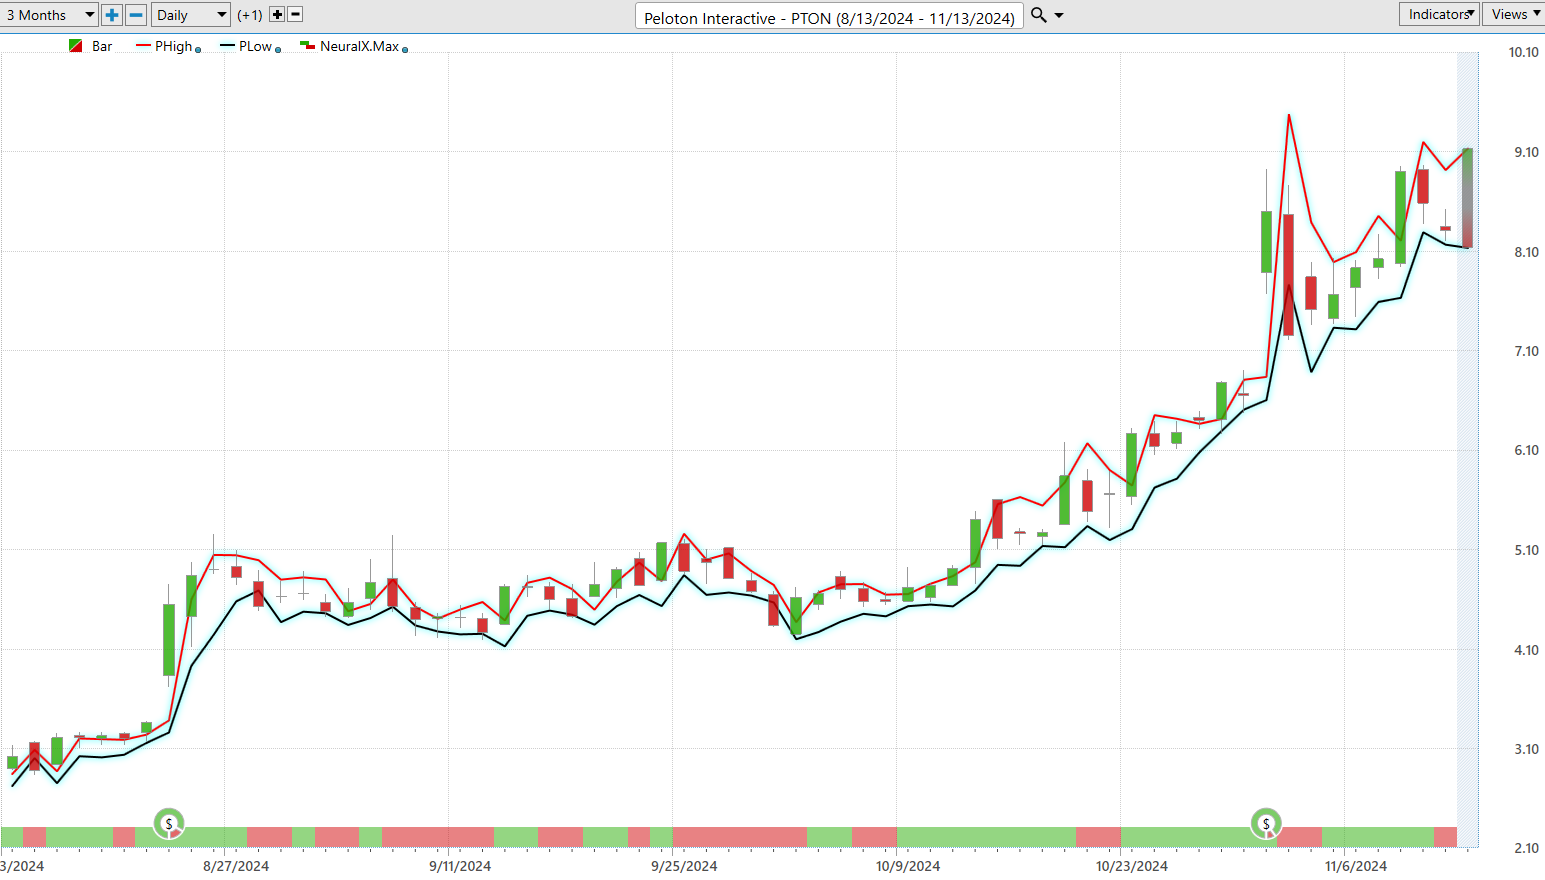
VantagePoint Software Daily Price Range Prediction
In the trading arena, timing isn’t just a luxury — it’s the essence of the game. For the elite traders, the VantagePoint A.I. Daily Range Forecast transcends the role of a mere tool; it serves as a mentor. It’s crafted for precision — pinpointing those critical instants to either seize the opportunity or retreat, each decision potentially making or breaking a trade.
However, in an environment where volatility looms incessantly, mere access to data falls short. The real power lies in transforming this data into actionable insights through advanced technologies like artificial intelligence, machine learning, and neural networks. These terms are not just the latest jargon — they are indispensable instruments that refine your trading acumen, cutting through market noise to deliver sharp, accurate forecasts. Here, we delve into the daily, weekly, and monthly average trading ranges for $PTON, illustrating the past year’s market dynamics.

But in the trading world, it’s all about nailing those prime entry and exit points — timing is everything. Curious about the best moments to dive in or duck out of a trade? Think of the Daily Range Forecast chart as your personal GPS in the bustling trading landscape. This tool charts a path for short-term trades with pinpoint accuracy, allowing you to navigate the market’s fluctuations with precision and confidence. There’s no need for guesswork; this forecast hands you the exact trading range for the next day, with a clear indication of the trend.
Study the chart below and look at how clearly the trend is delineated every single day.
Intermarket Analysis
Intermarket analysis is a crucial concept in finance that examines the connections and interactions across different financial markets, including stocks, bonds, commodities, and currencies. This approach helps you understand how movements in one market can influence others. For instance, a significant change in the bond market, like a shift in interest rates, can impact stock market valuations or currency strength. By studying these relationships, you can gain a broader perspective on global financial dynamics, enabling you to make more informed investment decisions and develop robust trading strategies.
Intermarket analysis offers a comprehensive framework that reveals the intricate relationships among various financial markets—such as equities, bonds, commodities, and currencies. This method highlights how shifts in one sector can cause cascading effects across others. Figures like John Murphy have been instrumental in demonstrating how trends in one market can signal upcoming changes in another, thus providing traders with valuable foresight to anticipate market movements and adjust their strategies accordingly. Furthermore, innovators like Lou Mendelsohn have enhanced this approach by integrating artificial intelligence with tools such as VantagePoint, allowing traders to harness these intermarket relationships with unprecedented accuracy and navigate market dynamics more effectively.
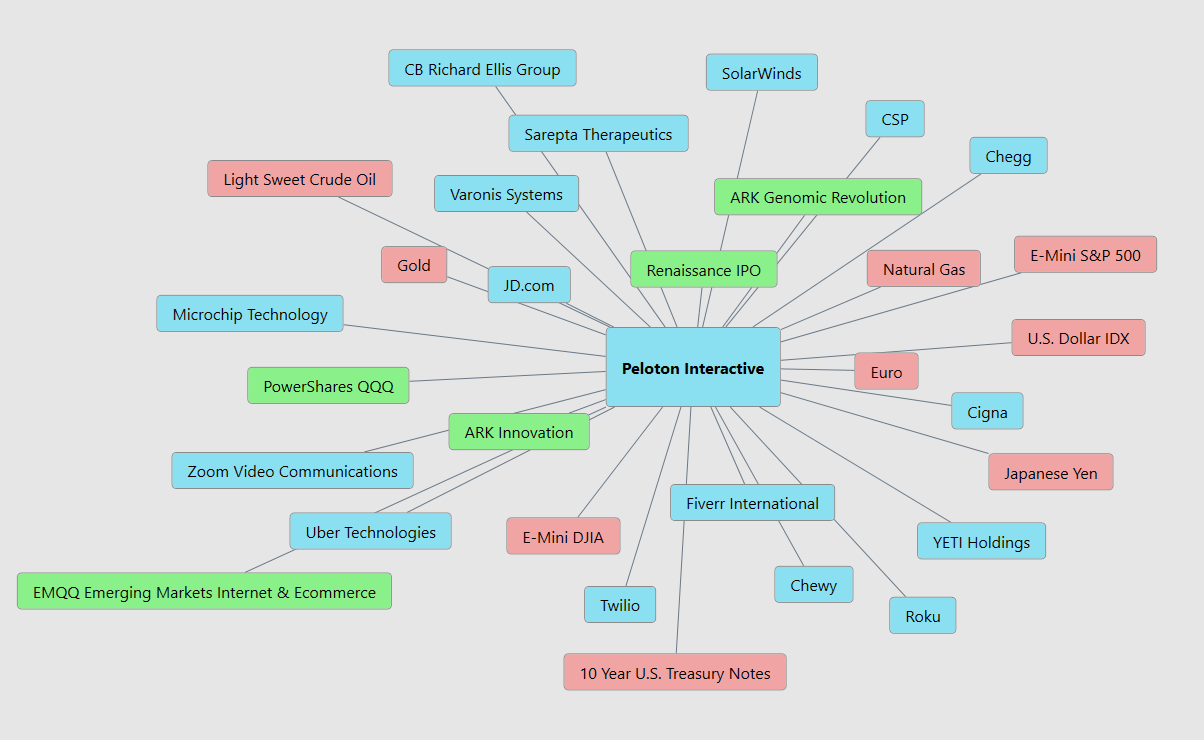
The diverse array of ETFs and stocks listed, ranging from innovative tech-centric ETFs like ARKK and ARKG to consumer-focused companies such as Chewy and YETI, provide a multifaceted view into market dynamics that can influence companies like Peloton. By analyzing sectors like healthcare, technology, and consumer behavior alongside economic indicators such as currency and commodity futures, and interest rates, investors gain insight into the external factors affecting consumer spending, market sentiment, and operational costs. This comprehensive approach helps in understanding the interconnectedness of global economic trends, consumer preferences, and technological advancements, which are essential for strategic investment decisions in contemporary markets like that of Peloton.
Our Suggestion
Peloton’s stock experienced a notable surge, rising by 51% following these announcements, signaling growing investor confidence in the company’s recovery path.
Furthermore, Peloton has been in the spotlight due to a change in its executive leadership, with Peter Stern stepping in as the new CEO. This top-level change has been well-received by the market, evidenced by a double upgrade from analysts at Bank of America Securities and a sharp increase in stock prices shortly after the announcement. The new CEO’s background from Apple Fitness+ suggests strong potential to steer the company towards a more sustainable and profitable future.
Given these developments, with the new CEO at the helm and analysts upgrading their forecasts, Peloton ($PTON) indeed warrants attention on your watchlist. The company’s recent maneuvers suggest a strategic pivot that could stabilize and grow its market standing. Expect volatility as these changes start to impact operations and market perceptions, providing potentially lucrative opportunities for those who excel in navigating such dynamic market conditions.
Practice great money management on all your trades.
Follow the VantagePoint A.I. Daily Range Forecast for daily guidance.
Let’s Be Careful Out There.
It’s Not Magic.
It’s Machine Learnin g.
Disclaimer: THERE IS A HIGH DEGREE OF RISK INVOLVED IN TRADING. IT IS NOT PRUDENT OR ADVISABLE TO MAKE TRADING DECISIONS THAT ARE BEYOND YOUR FINANCIAL MEANS OR INVOLVE TRADING CAPITAL THAT YOU ARE NOT WILLING AND CAPABLE OF LOSING.
VANTAGEPOINT’S MARKETING CAMPAIGNS, OF ANY KIND, DO NOT CONSTITUTE TRADING ADVICE OR AN ENDORSEMENT OR RECOMMENDATION BY VANTAGEPOINT AI OR ANY ASSOCIATED AFFILIATES OF ANY TRADING METHODS, PROGRAMS, SYSTEMS OR ROUTINES. VANTAGEPOINT’S PERSONNEL ARE NOT LICENSED BROKERS OR ADVISORS AND DO NOT OFFER TRADING ADVICE.

