| This week’s stock analysis is Novartis ($NVS) |

Novartis is a multinational pharmaceutical company based in Switzerland. They are one of the largest pharmaceutical companies in the world, with over 130,000 employees. They are best known for their cancer drug, Gleevec, which is used to treat chronic myeloid leukemia. Novartis also manufactures other drugs for conditions such as hypertension, kidney disease, and multiple sclerosis. The company has come under fire in recent years for their high prices, but they continue to be a major player in the pharmaceutical industry. Their main competitors are Pfizer, Merck, Bristol Myers Squibb, and Roche.
Novartis has been awaiting FDA approval on a cancer drug. The delays have occurred primarily because of Covid19 and the FDA’s inability to inspect the Chinese manufacturing sites.
Some background history in cancer therapeutics is necessary to appreciate the financial context that $NVS is operating under.
In 2014, the U.S. Food and Drug Administration (FDA) approved Opdivo (nivolumab) which is manufactured by Bristol Myers Squibb as a treatment for patients with unresectable or metastatic melanoma who have previously been treated with ipilimumab. OPDIVO is a monoclonal antibody that works by targeting the protein PD-1, which helps to regulate the immune system. By blocking PD-1, OPDIVO allows the immune system to fight cancer cells more effectively. OPDIVO is the first FDA-approved treatment in a new class of drugs known as checkpoint inhibitors. Checkpoint inhibitors work by taking the brakes off of the immune system, allowing it to more effectively fight cancer. In clinical trials, OPDIVO was shown to significantly improve overall survival in patients with advanced melanoma. OPDIVO is currently approved for use in six different types of cancer, including lung, kidney, colorectal, head and neck, bladder, and gastric cancers.
Also in 2014, the FDA approved the release of Keytruda which is manufactured by Merck. Keytruda is a type of immunotherapy used to treat various types of cancer. It works by helping the body’s immune system to attack cancer cells. It was first approved by the US Food and Drug Administration (FDA) for the treatment of melanoma, and it has since been approved for several other types of cancer. Keytruda is currently being studied in clinical trials for its potential use in treating many other types of cancer.
Novartis has been patiently awaiting the approval of Tislelizumab which is an immunotherapy drug that is used to treat various types of cancer. It works by targeting a protein called programmed cell death protein 1 (PD-1), which is found on the surface of T cells. By binding to PD-1, tislelizumab blocks the interaction between PD-1 and its ligands, which allows the T cells to become activated and kill cancer cells. Tislelizumab has been shown to be effective in treating several types of cancer, including non-small cell lung cancer, Hodgkin’s lymphoma, and renal cell carcinoma. It is typically used in combination with other cancer treatments, such as chemotherapy or radiation therapy.
Novartis also has a variety of drugs awaiting approval which are variations of Monoclonal antibodies. These are proteins that are produced in the laboratory and used to treat various diseases, including cancer. These proteins are designed to bind to specific molecules, known as antigens, on the surface of cells. By binding to these antigens, monoclonal antibodies can either destroy the cells outright or help the immune system to better identify and attack them. In the case of cancer cells, monoclonal antibodies can bind to proteins that are overexpressed on the surface of the cells, helping the immune system to recognize and destroy them more easily. Additionally, monoclonal antibodies can be used to deliver toxins directly to cancer cells, causing them to die without harming normal cells. As a result, monoclonal antibodies provide a potentially powerful tool for selectively targeting and destroying cancer cells.
Novartis’ newest immuno-oncology drug, tislelizumab, has been making headlines due to its impressive clinical trial results. While the Food and Drug Administration (FDA) has not yet announced an approval date for the drug the markets do believe that an approval is pending. Until then, other potential therapeutic options are available for treating advanced non-small cell lung cancer (NSCLC). It could be a game changer if approved though, so Novartis and many other parties are anxious for news of its approval.
In the interim what make Novartis ($NVS) attractive to investors is:
Earnings are forecast to grow 4.34% per year
Earnings grew by 122.3% over the past year
$NVS pays a reliable dividend of 3.37%. This is more than double the 1.6% dividend yield of all of the combined S&P 500 stocks.
It appears very fairly valued when compared to its competitors in the pharmaceutical sector.
In this weekly stock study, we will look at and analyze the following indicators and metrics as are our guidelines which dictate our behavior in deciding whether to buy, sell, or stand aside on a particular stock.
- Wall Street Analysts’ Estimates
- 52-week high and low boundaries
- Best Case – Worst Case Analysis and Takeaways
- Vantagepoint A.I. Forecast (Predictive Blue Line)
- Neural Network Forecast
- Daily Range Forecast
- Intermarket Analysis
- Our trading suggestion
We don’t base our trading decisions on things like earnings or fundamental cash flow valuations. However, we do look at them to better understand the financial landscape that a company is operating under.
Wall Street Analysts’ Estimates
The 20 analysts offering 12-month price forecasts for Novartis AG have a median target of 90.12, with a high estimate of $111.11 and a low estimate of $74.38 . The median estimate represents a -0.95% decrease from the last price of 90.98.
52-Week High and Low Boundaries
Looking at the Long-Term chart of $NVS provides us with the 52-week high and low boundaries.
Over the past year we have seen $NVS trade as low as $74.09 and as high as $94.26. The annual trading range has been $20.17
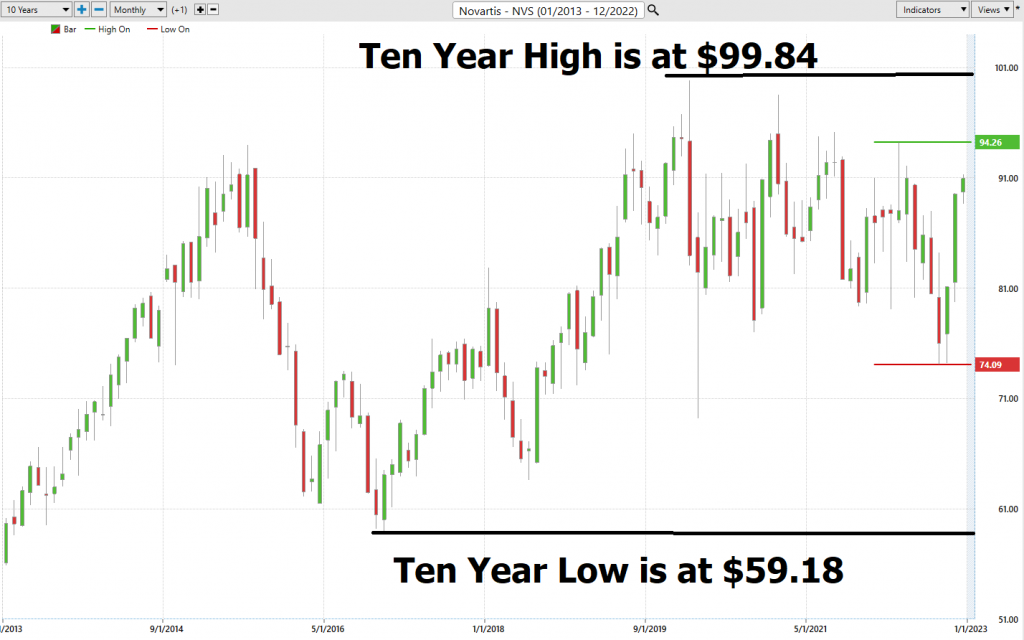
Currently, the stock is trading at the 82 nd percentile of its annual range.
Next, we measure the annualized statistical volatility by dividing the current price ($90.62) by its annual trading range (20.17). This tells us that the annualized statistical volatility is 22.2%. This tells us that that if the following 12 months are like the past 12 months, we could define normal as $NVS being 22.2% higher or lower than the current price level.
Since the stock is testing its 52-week high, we would not be surprised to see the stock quickly rise to its 10-year high level at $99.84, should it break the boundary at $94.26.

Best Case – Worst Case Scenario
When we study the long term 52-week chart we can look at the best case and worst-case scenarios just to get an eyeball perspective of the risk and volatility of this asset. This is worth doing anytime you invest or trade to monetarily understand what the potential risks and rewards have been over the past year.
It is worth doing this type of baseline analysis because it allows you to visually ascertain how quickly a stock drops in comparison to the speed with which it moves higher.
It will also provide you with a very practical understanding of statistical volatility. We know that the Annualized Volatility for $NVS is 22.2%. Observe how all of the rallies and declines, for the most part, stay within this statistical boundary.
Here is the best-case scenario:
Followed by the Worst-case Scenario:

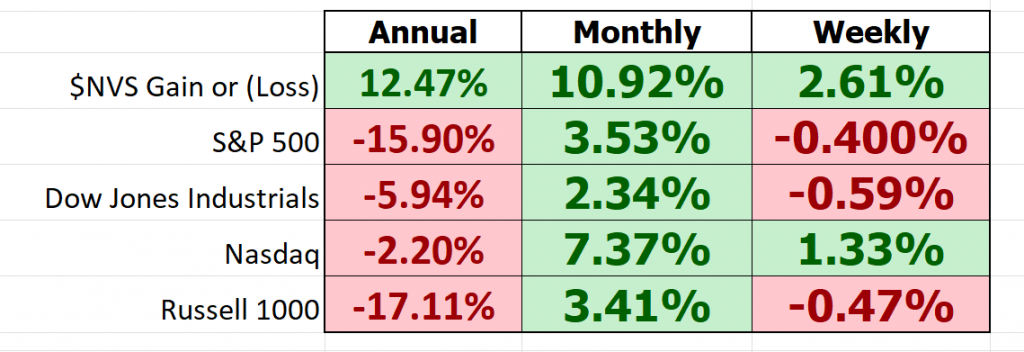
Next, we want to compare the performance of $NVS to the major broad market indexes.

So, in $NVS we have an asset which is performing better than the broader market with less volatility. In the past year the worst-case downside was -15.6% and the best-case upside was +22.97%. In between those boundaries is where all the price action occurred.
Lastly, we compare $NVS to its main competitors.
This simple analysis so far allows us to get a very realistic view of future expectations before we dig into the artificial intelligence analysis.
$NVS is very competitive in its niche. Should they receive approval of their cancer drug Tislelizumab the results could be very explosive.
We advise Power Traders to always pay close attention to the 52-week high and low boundaries as these markers often provide great trading opportunities and create a great deal of volatility in an asset.
Earnings dates have also been a key driver in price action. The next earnings call is slated for February 3, 2023.
Vantagepoint A.I. Forecast (Predictive Blue Line)
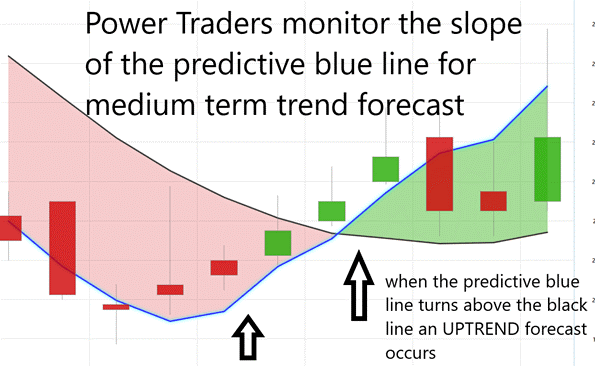
On the following chart you will see the power of the VantagePoint Predictive blue line which determines the medium term trend price forecast.

The guidelines we abide by are as follows:
- The slope of the predictive blue line determines the trend forecast and general direction of
- Ideally, the VALUE ZONE is determined to try and find buy opportunities at or below the predictive blue line, or to sell opportunities above the predictive blue line during a downtrend.
Naturally when the predictive blue line slopes lower traders would be anticipating lower prices and either moving to the sidelines or hedging their positions.
Using VantagePoint Software and the artificial intelligence, traders are alerted to trend forecasts by monitoring the slope of the predictive blue line.
The predictive blue line, however, utilizes the VantagePoint-patented Neural Network and Intermarket Analysis to arrive at its value. It looks at the strongest price drivers of an asset through artificial intelligence and statistical correlations to determine its value.
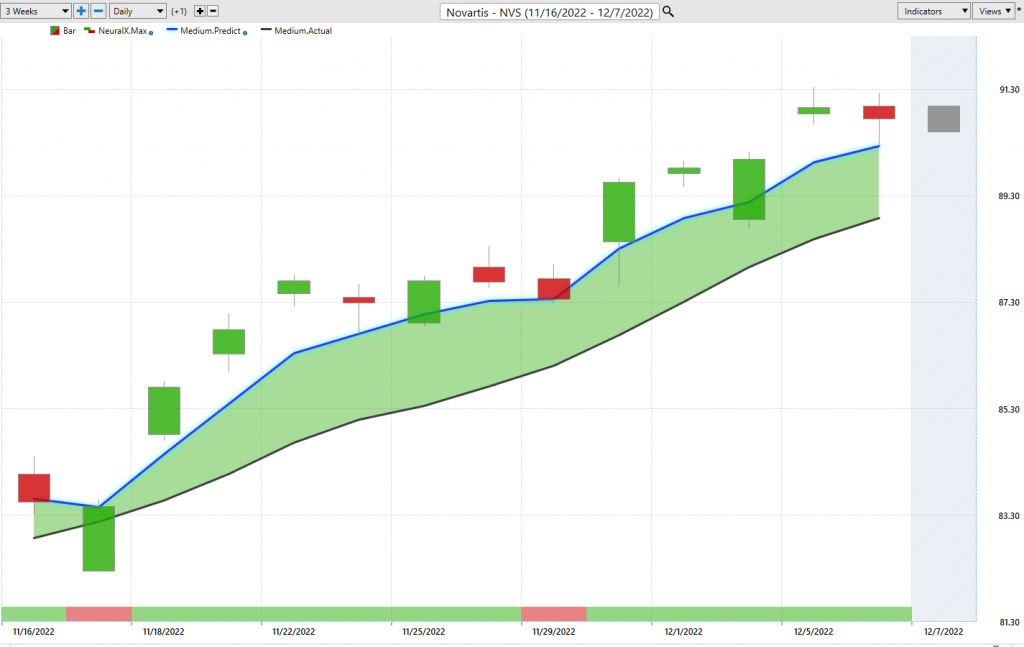
What is fascinating about the chart is that by simply eyeballing the chart we can see that the slope of the predictive blue line is like the NORTH STAR in providing directional guidance to traders. In other words, don’t fight the trend . The trading opportunities might last a few days or several weeks, but the focus is always to keep the trader on the right side of the right trend at the right time. The blue line ALWAYS determines the forecast and the best move forward.
Normally an UPTREND forecast occurs when you have two consecutive closes above the predictive blue line . On the downside the inverse is also true. A downtrend forecast normally occurs when you have two consecutive closes below the predictive blue line.
Fine Tuning Entries with The Neural Net Indicator
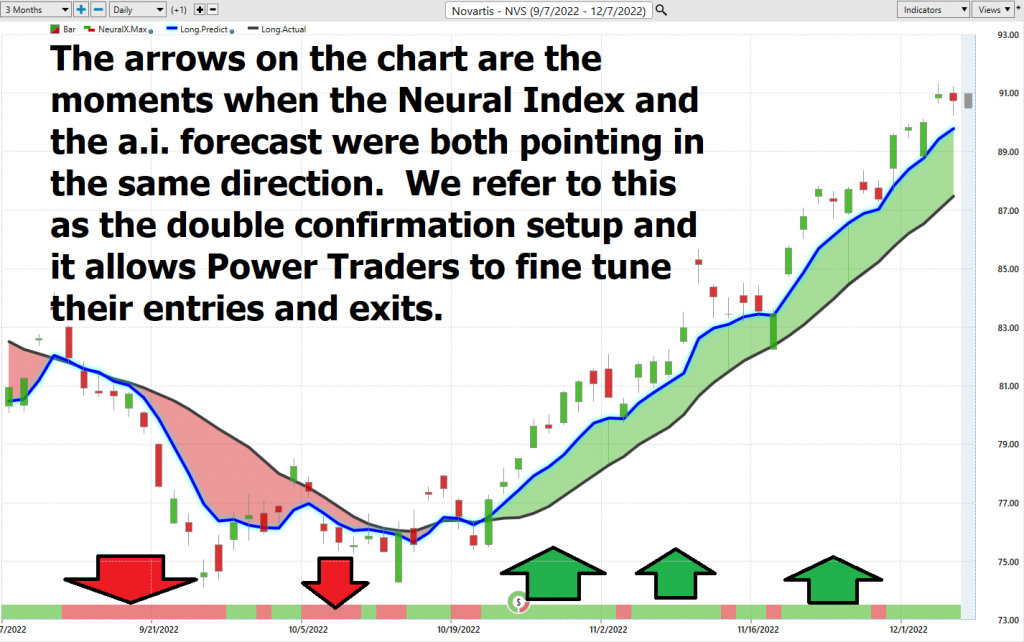
At the bottom of the chart is the Neural Network Indicator which predicts future short-term strength and/or weakness in the market. When the Neural Net Indicator is green it communicates strength. When the Neural Net is Red it is forecasting short term weakness in the market. When it is yellow it is anticipating sideways prices.
A Neural Net is a computational learning system that uses a network of functions to understand and translate massive amounts of data into a desired output, consistently monitoring itself and improving its performance.
A neural network in trading is an artificial intelligence technology designed to predict the efficiency and efficacy of market behavior. Often composed of neurons that are wired together, these networks can recognize patterns in data and quickly modify them as new data or information is fed into the system. Neural networks have been utilized in electrical engineering since the 1940s, but more recently they’ve been used by traders to gain a competitive edge in their investments. The success of neural networks in trading can be credited to its ability to learn from both positive and negative outcomes, while incorporating human-understood metrics within its computation structure.
Neural Networks are essentially trainable algorithms that emulate aspects of the human brain. This means they can be trained based upon criteria for assessing risk and potential reward to determine the best move forward. This allows them to make high probability forecasts based on available historical information .
We advocate that Power Traders cross reference the chart with the predictive blue line and neural network indicator to create optimal entry and exit points.
For the serious trader, neural networks are a next-generation trading tool that can detect subtle non-linear interdependencies and patterns that traditional methods of technical analysis are unable to uncover.

Traders look for confirmation on the NeuralNet to position themselves LONG or SHORT in the market. In other words, when the A.I. forecast is green, and The Neural Net is green, that presents a buying opportunity.
The inverse is also true, when the A.I. forecast is red and the Neural Net is red, that is a selling opportunity. The arrows on the chart below highlight the trading zones where Power Traders would’ve been using double confirmation to find buying opportunities in cross referencing the A.I. forecast with the NeuralNet.
Power Traders are always looking to apply both the Neural Network and A.I. to the markets to find statistically sound trading opportunities.
VantagePoint Software Daily Price Range Prediction
We will zoom in on the last 3 months of price action so that you can see for yourself how the a.i. and machine learning combine to create a very accurate daily price range forecast that keeps traders focused on optimal trade placement.
Before doing so let’s quickly examine the average trading ranges for $NVS for the daily, weekly, and monthly time frames. From this perspective we can see the norm of what has been occurring in the market over these given time frames.
One of the powerful features in the VantagePoint Software which Power Traders use daily is the Price Range prediction forecast. This forecast is what permits Power Traders to truly fine tune their entries and exits into the market with exacting precision.
Every day traders are faced with the anxiety and frustration of wondering where they should be looking to buy and sell the market. VantagePoint’s A.I. makes this decision super easy with the Daily Price Range Forecast.

See how the upper and lower bands of the price range forecast for a very clear channel of trading activity as well. Swing traders are always looking for buying opportunities towards the bottom of the predicted channel and try to find selling opportunities above the top band.
Intermarket Analysis
Power lies in the way we respond to the truth we understand.
One of the supremely important questions in trading is what is driving the price? Headlines often create interesting narratives. But these “stories” only capture the imagination. Traders want and need to understand the cause and effect of price movement.
The only way to get an answer to this important question is through intermarket analysis which looks at statistical price correlations of assets.
We live in a global marketplace.
Everything is interconnected.
Intermarket analysis is a term used in trading that refers to the study of price movements and correlations among markets. It helps traders identify relationships and opportunities between different asset classes, such as stocks, bonds, commodities, currencies, and futures. Intermarket analysis helps traders develop strategies based on understanding the correlations between asset class prices, anticipating changes in market behavior resulting from shifts in the linkages between different sectors. Intermarket analysis is one of the major components of technical analysis, as it can help traders to gain an edge when trading across multiple asset classes.
Intermarket analysis seeks to explain the relationship between different financial markets and instruments, as well as how they influence each other. This analytical tool has proved invaluable for traders in making investment decisions. Two of the most notable proponents of Intermarket analysis are John Murphy and Vantagepoint A.I. founder, Lou Mendelsohn. Murphy was a pioneer who published multiple books about technical analysis, including Intermarket Technical Analysis: Trading Strategies for the Global Stock, Bond, Commodity, and Currency. Both Murphy and Mendelsohn helped popularize this sophisticated means of assessing assets.

Interest rates, Crude Oil Prices, and the volatility of the Dollar amongst thousands of other variables affect the decisions companies must make to flourish and prosper in these very challenging times. Trying to determine what these factors are is one of the huge problems facing investors and traders.
You always have a choice. You can tune in to the talking heads in the media who spin talking points which promote fear. Or you can rely on facts to base your decision making on.
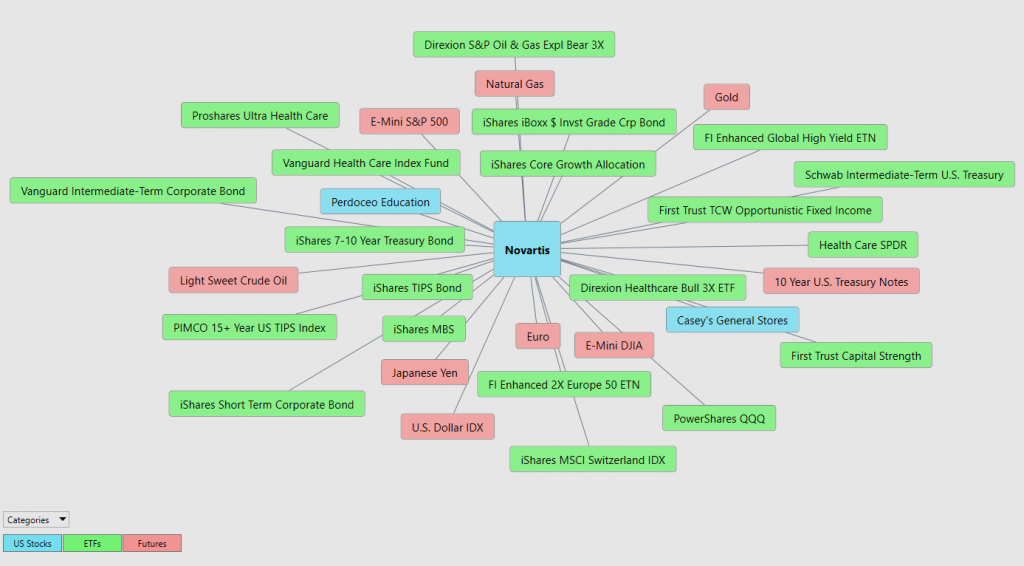
Within the Intermarket Analysis graphic, you will see the 31 markets that are the key drivers of $NVS price action.
There is great value to be had in studying and understanding the key drivers of ’s price action. This graphic provides a microcosmic view of what factors have been driving ’s higher. You will find a handful of biotech and pharmaceutical ETF’s whose price action is very statistically correlated to.
Suggestion for Traders
Charts are the footprints of money flows.
In an up market the footprint left on the chart is that the market is making higher high prices and higher lows.
In a down market the footprint on the chart is a series of lower highs and lower lows.
Currently Novartis ($NVS) is in an uptrend and over the longer-term consolidating price action at the upper end of its ten-year range. On a ten-year basis it is trading at its 77 th percentile. What may also be attractive to longer-term investors is the company trades at only 9 times earnings. In the pharmaceutical sector this is cheap, and we expect that it will draw in a lot of institutional money to support $NVS. Should approval occur from the FDA this asset will rise very quickly.
For purposes of comparison:
Eli Lilly is trading at 58 times earnings
Bristol Myers Squibb is trading at almost 27 times earnings.
Johnson and Johnson is trading at 24 times earnings.
Merck is trading at 18 times earnings.
We like the narrative and think the upside can be explosive. We like the reality that the stock is fairly valued, and the most optimistic Wall Street Analysts still think the stock has potential to run to $111 over the next 12 months. Because of its very low P/e ratio, the downside risk could be very small.
Whenever we encounter this type of potentially bullish scenario, we review our process for market selection.
Our recommendation is to follow the A.I. trend analysis as outlined in this stock study and practice good money management on all trades. Here is a screenshot of the current trend.
Let’s Be Careful Out There!
Remember, It’s Not Magic.
It’s Machine Learning.
Disclaimer: THERE IS A HIGH DEGREE OF RISK INVOLVED IN TRADING. IT IS NOT PRUDENT OR ADVISABLE TO MAKE TRADING DECISIONS THAT ARE BEYOND YOUR FINANCIAL MEANS OR INVOLVE TRADING CAPITAL THAT YOU ARE NOT WILLING AND CAPABLE OF LOSING.
VANTAGEPOINT’S MARKETING CAMPAIGNS, OF ANY KIND, DO NOT CONSTITUTE TRADING ADVICE OR AN ENDORSEMENT OR RECOMMENDATION BY VANTAGEPOINT AI OR ANY ASSOCIATED AFFILIATES OF ANY TRADING METHODS, PROGRAMS, SYSTEMS OR ROUTINES. VANTAGEPOINT’S PERSONNEL ARE NOT LICENSED BROKERS OR ADVISORS AND DO NOT OFFER TRADING ADVICE.

