This week’s stock analysis is Eli Lilly – ($LLY)
Eli Lilly and Company (NYSE: LLY) is a global pharmaceutical company based in Indianapolis, Indiana. Founded in 1876 by Colonel Eli Lilly, the company has a rich history spanning over a century. It operates in the healthcare sector and primarily focuses on the discovery, development, manufacture, and sale of pharmaceutical products.
They develop and market a wide range of medicines in various therapeutic areas, including diabetes, oncology, neuroscience, immunology, and others. The company sells its products globally, both in the United States and internationally, through various channels such as wholesalers, retailers, hospitals, clinics, and online platforms.
Some of Eli Lilly’s best-selling drugs:
Trulicity (Dulaglutide): Trulicity is a medication used for the treatment of type 2 diabetes. In 2021, it generated approximately $5.03 billion in revenue.
Humalog (Insulin Lispro): Humalog is a fast-acting insulin used to control blood sugar levels in people with diabetes. It is one of Eli Lilly’s most well-known products. In 2021, it generated around $2.8 billion in revenue.
Cialis (Tadalafil): Cialis is a prescription medication used to treat erectile dysfunction and symptoms of benign prostatic hyperplasia. In 2021, it generated approximately $1.7 billion in revenue.
Alimta (Pemetrexed): Alimta is a chemotherapy drug used for the treatment of certain types of lung cancer and mesothelioma. In 2021, it generated around $1.5 billion in revenue.
Cyramza (Ramucirumab): Cyramza is a medication used to treat various types of cancer, including lung, stomach, and colorectal cancer. In 2021, it generated approximately $1.1 billion in revenue.
Eli Lilly is headquartered in Indianapolis, Indiana, where its main corporate offices and research facilities are located. The company had approximately 38,700 employees worldwide.
Some of its key competitors include Pfizer, Novartis, Johnson & Johnson, Roche, Merck & Co., and AstraZeneca.
The pharmaceutical industry offers both opportunities and risks for Eli Lilly. One significant opportunity lies in the potential for breakthrough innovations and the development of new drugs that can address unmet medical needs. Expanding into emerging markets and the growing demand for healthcare in developing countries also presents opportunities for growth. On the other hand, risks include the challenges of drug development, regulatory compliance, patent expirations, competition, and potential adverse events associated with their products.
Wall Street analysts have become very optimistic on $LLY because of its recent financial performance, product pipeline, optimistic regulatory approval, and overall industry dynamics.
The current buzz on Wall Street is all about the future of obesity and diabetes treatments. This past weekend, drugmakers unveiled some exciting clinical-trial data on these next-gen drugs. Here’s the kicker: we’re talking about weight-loss pills that could give popular injectables like Wegovy and Ozempic a run for their money. This little pill, when combined with diet and exercise, led to a 15.1% weight loss in adults battling obesity or overweight conditions, and that’s without type 2 diabetes. This news was the talk of the town at the American Diabetes Association’s annual scientific conference.
This report shed the spotlight on Eli Lilly’s orforglipron. Their once-daily pill chalked up to 14.7% average weight loss at 36 weeks in adults with obesity or overweight. This was another headline-grabber at the American Diabetes Association conference. Dr. Robert Gabbay, the ADA’s top scientific and medical officer, says these oral weight-loss drugs are a game changer. They offer “increased accessibility of these revolutionary drugs for people who have struggled to lose weight.” More than half of Americans are worried about their weight, and 50% are open to taking weight-loss drugs. Nearly half of the U.S. adults surveyed are willing to shell out up to $100 a month on these medications.
Eli Lilly is making waves with its next-generation weight loss medication, Retratrutide. In a Phase 2 trial, non-diabetic patients were put on this drug, and the results after 24 weeks, patients saw an average weight reduction of 17.5%, and by the end of the 48-week treatment duration, that figure rose to 24.2%. So, what does this mean? Well, it’s suggesting that Retratrutide could be a game-changer, potentially becoming a leading treatment in the fight against obesity. Now, that’s something to keep an eye on.
Many of these pills in the pipeline are GLP-1 receptor agonists. They mimic the effects of a gut hormone that helps control appetite and blood-sugar levels — the same basic mechanism that powers the injectable medications Wegovy, Ozempic and Mounjaro. The demand for these injections has been so high that supplies have sometimes run dry based upon the recent optimism from clinical trials.
As of 2023, the global weight loss and weight management market is valued at approximately $225 billion and is expected to surpass $405.4 billion by 2030, registering a compound annual growth rate (CAGR) of 6.84% during this period.
These figures underscore the significant potential of the growing demand for effective weight loss solutions.
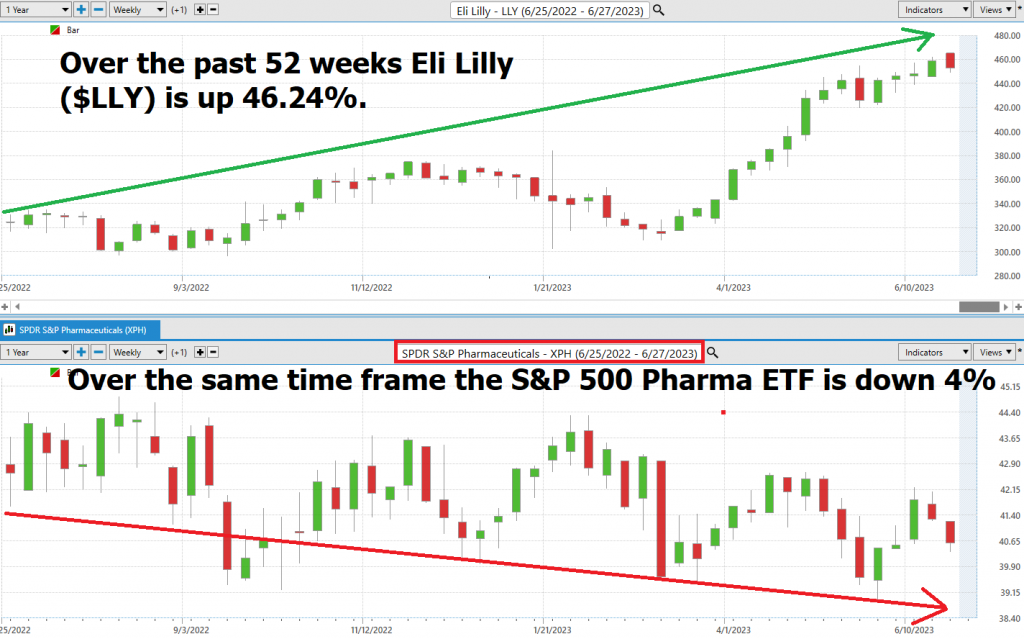
According to the recent financial headlines dominated by Eli Lilly ($LLY) the future of obesity and diabetes treatments is looking brighter and more accessible than ever. And Wall Street, as always, is watching closely. What makes Eli Lilly’s performance so impressive is comparing it to S&P 500 Pharmaceutical ETF ($XPH). The chart below shows by how large of a margin $LLY is outperforming all of its competitors.

In this weekly stock study, we will look at and analyze the following indicators and metrics which are our guidelines to dictate our behavior regarding any stock analysis.
- Wall Street Analysts’ Estimates
- 52-week high and low boundaries
- Vantagepoint A.I. Triple Cross Indicator
- The Best Case – Worst Case Scenarios
- Neural Network Forecast
- Daily Range Forecast
- Intermarket Analysis
- Our trading suggestion
We don’t base decisions on things like earnings or fundamental cash flow valuations. However, we do look at them to better understand the financial landscape that a company is operating under.
Wall Street Analysts’ Estimates
The 22 analysts offering 12-month price forecasts for Eli Lilly and Co have a median target of $472.00, with a high estimate of $507.00 and a low estimate of $300.00. The median estimate represents a +1.6% increase from the last price of $464.50.
Whenever we see Wall Street estimates this divergent in their opinion it is a sign that we should expect increased volatility in the asset.
We love to see this heavily divergent opinion as it tells us that volatility is baked into the mix.
52-Week High and Low Boundaries
Over the past year we have seen $Eli Lilly ($LLY) trade as low as $296.32 and as high as $467.98. This tells us that the annual trading range is $171.66.
We also like to divide the current price of $464.50 by the annual trading range to get a broad-based estimate of trading volatility. This tells us that the volatility of $Eli Lilly ($LLY) over the past year has been 37%. This value also provides us with a basic estimate in letting us know that if the future is like the recent past, it would be normal for $Eli Lilly ($LLY) to trade in a range that is 37% higher and lower than the current price over the next year.
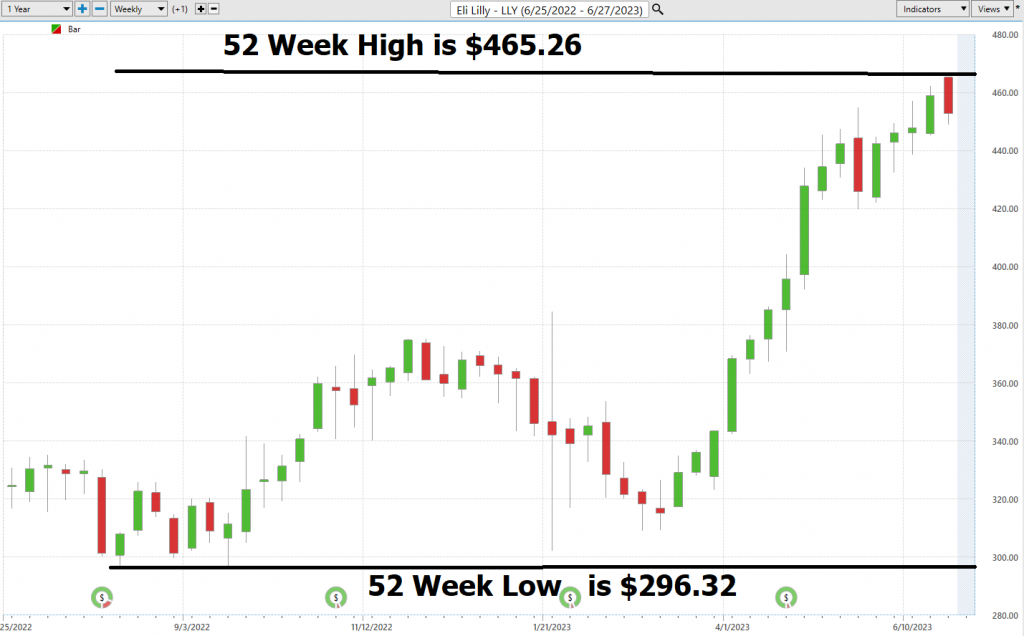
Here is the annual 52-week chart of $Eli Lilly ($LLY) so that you can see the powerful price journey it has taken over the last few months.
The 52-week low price boundary is a significant level that professional traders pay close attention to for a few reasons. First, it helps them to defining what is “fair value” for a given security. Second, it can be useful in defining what is “cheap” – i.e. when a security is trading significantly below its analyst estimates, it may be an attractive buying opportunity. Finally, professional traders will often look for bottoming price action near the 52-week low boundary – this can be a helpful indication that the security is about to begin a new uptrend. As such, the 52-week low boundary is a key level that professional traders use in their analysis.

Power Traders will compare the Wall Street Analysts estimates with these broad volatility estimates to get a broad sense of price action in $Eli Lilly ($LLY).
What is also very constructive is to look and examine the longer term 10 year monthly chart for Eli Lilly ($LLY).
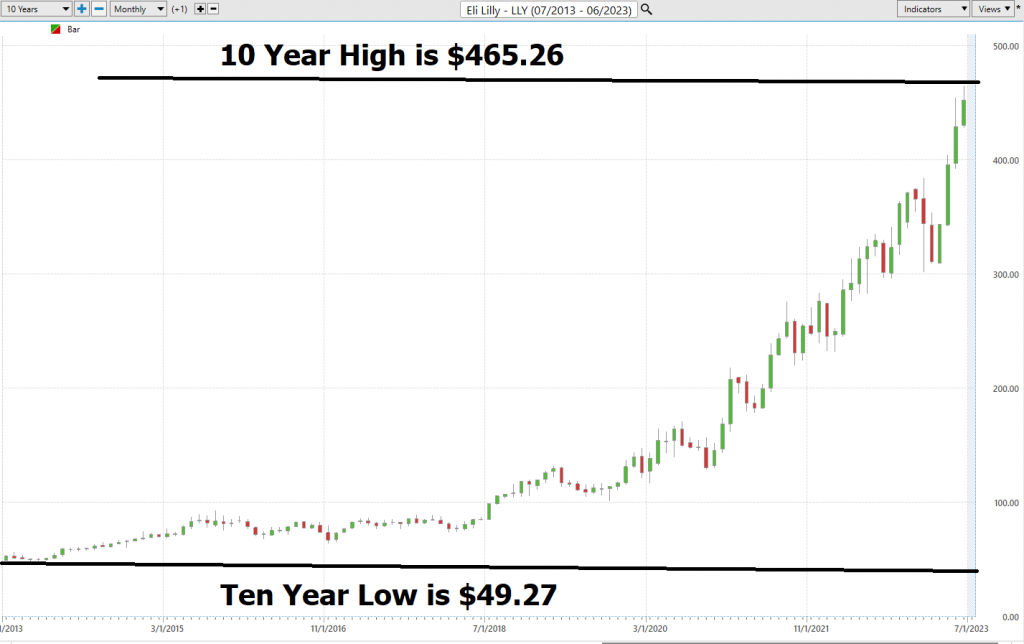
One of our favorite indicators of all time is when we see a market making new 52 week highs while simultaneously also making new 10 year highs. This occurrence is a beacon of strength and momentum, a testament to an asset’s robust performance and resilience. It’s like finding a diamond in the rough, and the potential gains can be explosive.
When an asset achieves this feat, it’s not just breaking barriers; it’s shattering expectations. It’s an indication that the asset is not only outperforming its recent past but also surpassing its long-term historical performance. This is a clear signal of an exceptionally strong bullish trend, one that has withstood the test of time and market fluctuations.
But why is this so powerful? It’s all about market psychology. New highs attract attention, fuel optimism, and generate momentum. They create a self-fulfilling prophecy of sorts – as more traders notice the asset’s strong performance, more are likely to invest, driving the price even higher.
There is no better way to measure growth and potential expansion than when this occurs in the price of an asset. On Wall Street analysts look at every type of fundamental piece of data that is available to try an understand and anticipate growth. As traders we want to be where the growth is occuring and then allow the artificial intelligence, neural networks and machine learning to navigate.
In conclusion, finding an asset making new 52-week highs alongside new 10-year highs is a rare and powerful signal. It’s like catching a wave just as it’s about to crest, offering the potential for a thrilling ride and substantial gains. But as always, navigate these market waves with caution and precision. This is what has been occuring in Ely Lilly for the past 18 months and the growth has been truly remarkable.
Best Case – Worst Case Scenario Eli Lilly ($LLY)
As Wall Street analysts, we delve deep into the heart of a trade or long-term investment opportunity, dissecting its volatility. We compare the zeniths of rallies against the nadirs of declines to decode the real-time volatility of the asset. Then, we pit the asset’s performance against the returns of the major market indexes. This rigorous analysis is not just a routine – it’s a necessity.
Statistical annualized volatility, a measure of the stock’s price fluctuation over time, is our compass in this exploration. It mirrors the standard deviation in price movements during normal market trading. The longer the time we use to calculate its average, the more precise and realistic our prediction of future performance becomes. But we don’t stop at just crunching numbers. We delve into the charts, conducting a best-case and worst-case analysis. This gives us a tangible understanding of what this volatility implies for potential performance.
Trading, at its finest, is about being acutely aware of an asset’s potential volatility. As traders, we are in the pursuit of MOTION. But remember, motion is a double-edged sword. By scrutinizing rallies and declines, we can swiftly discern whether an asset is retaining its gains or not.
Consider Eli Lilly ($LLY), with an annualized volatility of 37%. This implies that the “NORMAL” for this stock is a potential swing of 37% higher or lower over the next 12 months. As traders, we don’t fear this volatility – we embrace it. It’s the lifeblood of our trade, the rhythm to our rhyme. So, let’s navigate these market waves with precision, armed with the power of analysis and the courage to act.
Here is the BEST-CASE analysis.
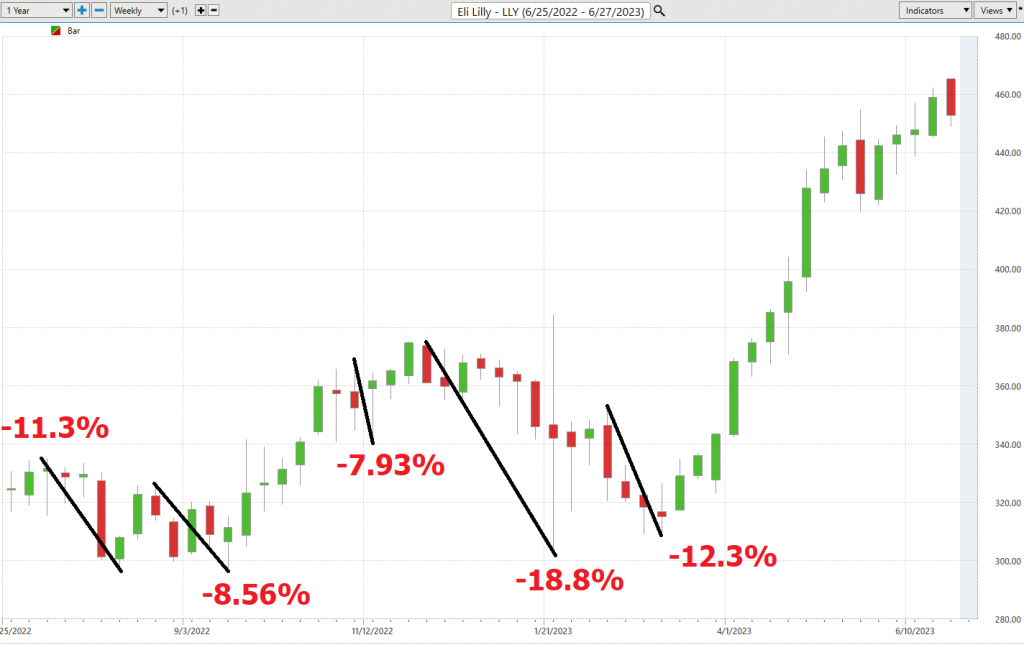
Followed by the WORST-CASE Analysis:

Next, we compare the performance of Eli Lilly ($LLY) to the broader major stock market indexes.
When we drill down a little deeper, we compare Eli Lilly ($LLY) to the other top pharmaceutical stocks. We can quickly see that Eli Lilly ($LLY) is the ALPHA stock that many traders dream of owning and trading.

While other companies have done well on the weekly, monthly, and six month time frames, Eli Lilly ($LLY) has turned positive across all time frames. In other words, they are the leader of the pack.
Vantagepoint A.I. Triple Cross Indicator
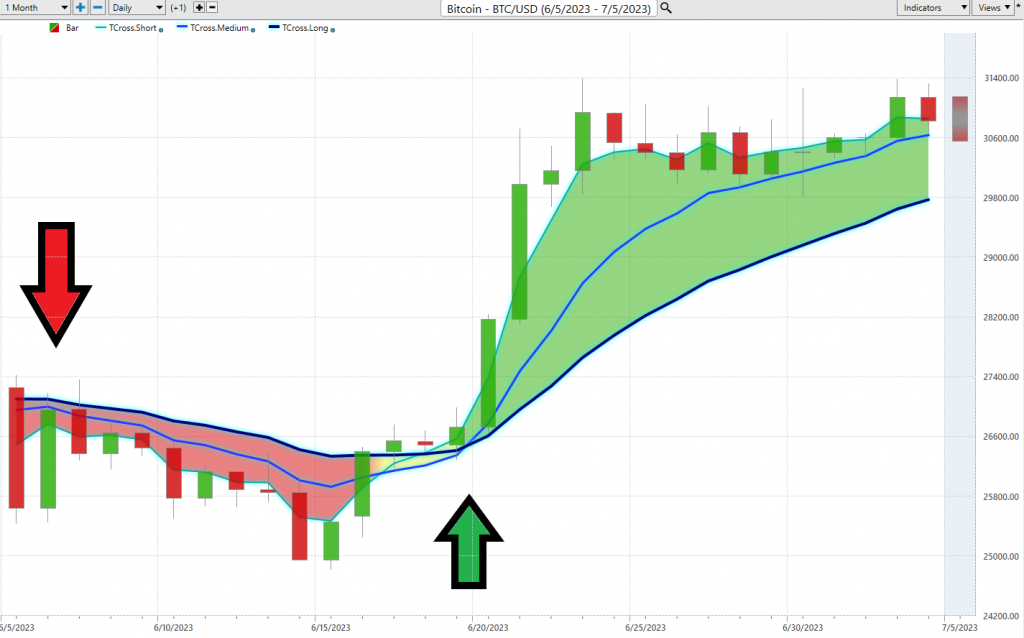
The Vantagepoint A.I. Triple Cross indicator uses three predictive moving averages instead of the typical two. The triple cross indicator consists of a 3-day predictive moving average, an 8-day predictive moving average and an 18-day predictive moving average. These time frames correspond to short-term. Medium-term or long-term analysis, providing early alerts and confirmation of valid trend signals.
The Triple Crossover reduces the number of trades by waiting for crossover confirmation from all three predictive moving averages: short-term, medium-term, and long-term. When the short-term average crosses the medium-term, it signals a potential trend change. When the medium-term crosses the long-term, it confirms the trend change. The alignment of all three averages indicates the start of a trend.
Predictive data reduces time lag and protects against premature entries and false signals caused by choppy or volatile markets.
In summary, the Triple Crossover provides an early indication of trend change, confirmed by a second and third predictive moving average crossover. It helps screen out premature signals, potentially offering fewer but higher quality trades.
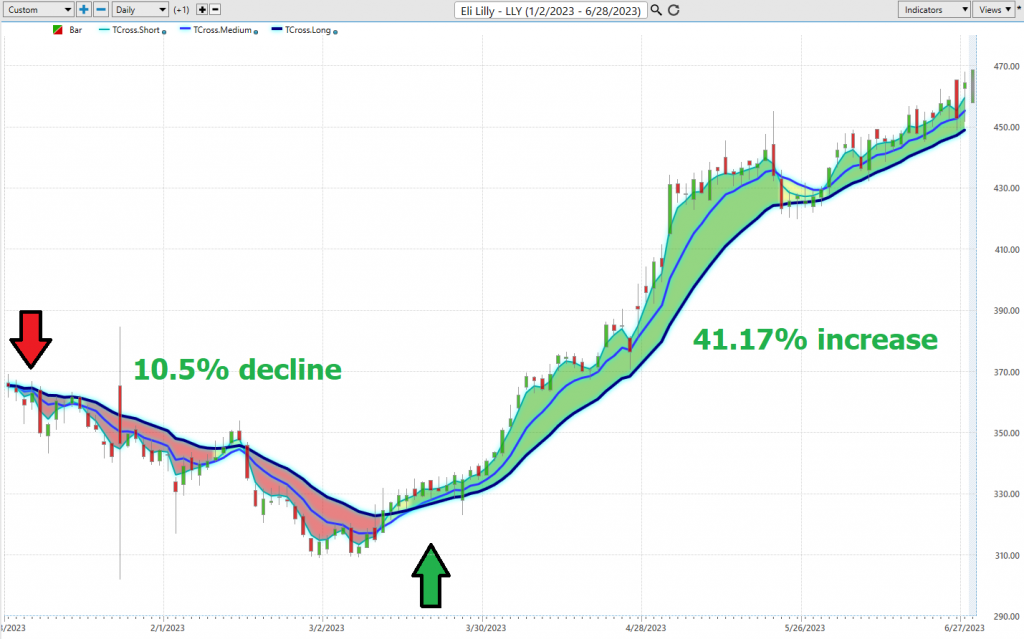
Here is the chart of Eli Lilly over the last 6 months. Observe how effective the Vantagepoint A.I Triple cross indicator was at anticipating the corresponding decline and advance of the stock price.

Neural Network Indicator (Machine Learning)
Let’s talk about a cool tool that’s like a super-smart brain for your trading strategy. It’s called the Neural Network Indicator, and it’s like a traffic light for the market. When it’s green, it means the market is strong. When it’s red, it means the market might get a bit weak.
Imagine a computer system that works like our brain. It takes in information, processes it, and gives out results. That’s what a neural network does. It learns by strengthening the connections between different points, just like our brain strengthens connections when we learn something new.
In simple terms, a Neural Network is like a super-smart computer brain that can take a ton of information, understand it, and then give us a useful result. It keeps getting better and better at this the more it learns.
Traders use neural networks to spot patterns in lots and lots of data. These patterns can help predict what might happen in the market next. It’s like having a crystal ball that uses math and science instead of magic. This can help traders make really accurate guesses about what trades to make.
When we’re looking for a good trade, we want a DOUBLE confirmation signal. That’s like getting two thumbs up that a trade is a good idea. We get this when the blue predictive line and the Neural Network both suggest the same thing about the future.
We recommend that traders use the chart with the predictive blue line and the Neural Network Indicator to find the best times to buy or sell. When both the A.I. forecast and the Neural Network are green, that’s a good time to buy. When they’re both red, it might be a good time to sell.

By using both the Neural Network and A.I., traders can find solid trading opportunities. It’s like having a secret weapon that gives you an edge over everyone else. So, let’s use this super-smart computer brain to help us make the best trades possible!
VantagePoint Software Daily Price Range Prediction
Let’s talk about a super cool feature in the VantagePoint Software that Power Traders use every day. It’s called the Price Range prediction forecast. This tool helps traders fine-tune when they should buy or sell in the market.
You know how it can be stressful and confusing to figure out when to buy or sell? Well, VantagePoint’s A.I. makes this decision a lot easier with the Daily Price Range Forecast. It’s like having a roadmap for your trading journey.
Lots of things can change how much a stock’s price goes up or down each day, like big world events or even the weather. So, predicting the daily price range is like solving a tricky puzzle. But don’t worry, VantagePoint’s A.I. uses a special formula that combines A.I., neural networks, and machine learning to give a daily price range forecast.
By looking at past price movements, economic factors like company earnings and interest rates, and breaking news stories, VantagePoint’s A.I. can make a pretty accurate guess about the daily stock market price range.
So, whether you’re an individual or a big company, knowing what might cause daily price changes is key to guessing future trends. VantagePoint keeps track of these patterns over time. By watching these elements and guessing potential influences, you can make smart and statistically sound decisions when investing in the stock market.
Historically speaking this is what last year’s average trading ranges on the daily, weekly, and monthly time frames look like.

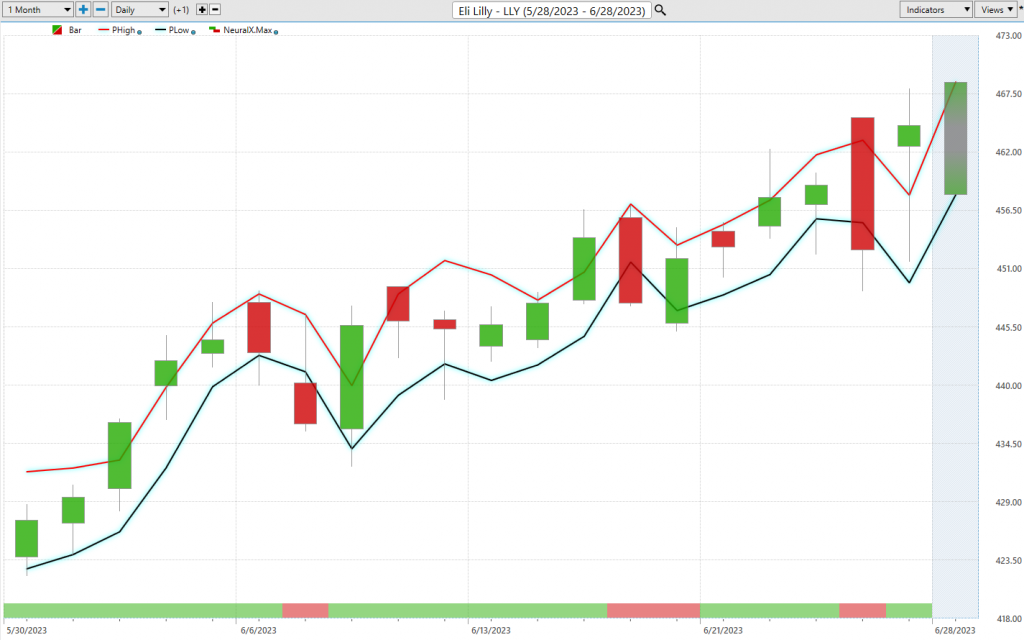
Here is the price chart of Eli Lilly ($LLY) during the most recent uptrend. The software very clearly delineates the daily forecast by providing an exact lower and upper boundary and specifies the short-term trend.
This chart helps traders decide where stop placement should occur. Observing how placing protective sell stops below the dark line on the chart was a powerful way to minimize risk on this trade.
See how the upper and lower bands of the price range forecast for a clear channel of trading activity as well. Swing traders are always looking for opportunities to buy towards the bottom of the predicted channel and selling opportunities above the top band.
Intermarket Analysis
Power lies in the way we respond to the truth we understand.
One of the supremely important questions in trading is what is driving the price? Headlines often create interesting narratives. But these “stories” only capture the imagination. Traders want and need to understand the cause and effect of price movement.
The only way to get an answer to this important question is through Intermarket analysis which looks at statistical price correlations of assets.
Intermarket analysis is often used by traders to gain insight into the relationships between different asset classes and markets. Three of the most notable leaders in using intermarket analysis in trading financial markets are John Murphy, Martin Pring and Lou Mendelsohn. Murphy wrote “Intermarket Technical Analysis” which is considered by many to be the definitive guide on this subject, including techniques such as correlation studies and divergence interpretations. He especially emphasized stock indexes, commodities, bonds, and currencies as important pieces of investment market data. Pring has written several books on the subject, including “Intermarket Analysis: Profiting from Global Market Relationships”, in which he explains how equity or commodity trends can be explained when looking at correlating movements in different markets like bonds and stock indexes. Lou Mendelsohn is the founder of Vantagepoint Software and the pioneer in delivering a powerful means to quantify and qualify Intermarket relationships for traders.
We live in a global marketplace.
Everything is interconnected.
Interest rates, Crude Oil Prices, and the volatility of the Dollar amongst thousands of other variables affect the decisions companies must make to flourish and prosper in these challenging times. Trying to determine what these factors are is one of the huge problems facing investors and traders.
You always have a choice. You can tune in to the talking heads in the media who spin talking points which promote fear. Or you can rely on facts to base your decision-making on.
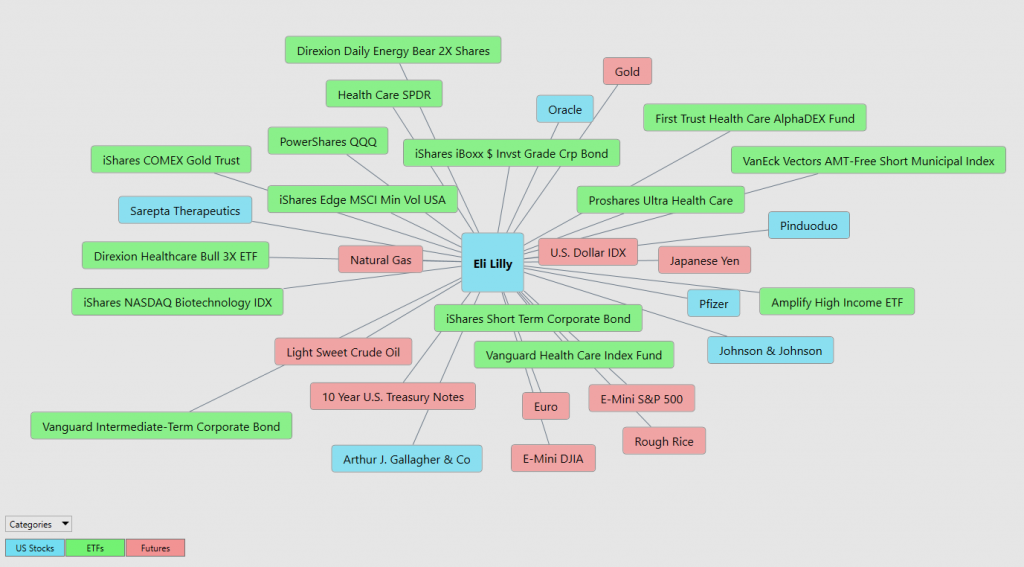
The following graphic shows you the top 31 drivers of Eli Lilly ($LLY)’s price action.

Our Suggestion
We like the price action in $Eli Lilly ($LLY) for multiple reasons.
#1) $LLY for the last 18 months has been consistently making new 52-week highs as well as new 10-year highs. This is rare for chartists to uncover and find. When it does occur, if nothing else it deserve to be on your trading radar.
#2) $LLY is solidly outperforming the broader stock market indexes.
#3) $LLY is solidly outperforming all of its pharmaceutical competitors.
#4) Its product pipeline is awaiting FDA approvals on weight loss drugs which would easily add billions to $LLY’s bottom line. Some analysts believe that $LLY will double its market cap in the next 4 years based upon its very aggressive product pipeline.
All of these factors make $LLY an ALPHA stock.
Also $LLY has wide trading ranges creating numerous opportunities on a daily, weekly, and monthly basis.
In the world of stock trading, “Alpha” is a term that’s used to describe a strategy’s ability to beat the market, or it’s “edge.” Alpha is a measure of performance, showing the excess return of an investment relative to the return of a benchmark index. If an investment has an Alpha of 1, that means it has outperformed its benchmark by 1%. If it has an Alpha of -1, it has underperformed by 1%. $LLY has an ALPHA for +31 when compared to the S&P 500 Index.
Now, when we talk about an “Alpha Stock,” we’re referring to stocks that are expected to outperform the market or generate a positive Alpha.
Alpha stocks are typically the leaders in their industries, and they often exhibit higher levels of volatility compared to the broader market, providing greater potential for high returns (but also higher risk). They are the kind of stocks that can significantly boost the performance of your portfolio if their potential is realized.
However, it’s important to remember that high Alpha stocks come with increased risk, and they require careful analysis and active management to maintain a balanced portfolio. As with all investments and trades, it’s crucial to do your own research and consider your own risk tolerance before investing in Alpha stocks.
PUT Eli Lilly ($LLY) on your radar and allow the a.i. to guide your trading decisions.

We think $LLY will continue to outperform the broader market, but it will do so with greater volatility.
Practice solid money management in all your trades.
We will re-evaluate based upon:
- New Wall Street Analysts’ Estimates
- New 52-week high and low boundaries
- Vantagepoint A.I. Triple Cross Forecast
- Neural Network Forecast
- Daily Range Forecast
Let’s Be Careful Out There!
It’s Not Magic.
It’s Machine Learning.
Disclaimer: THERE IS A HIGH DEGREE OF RISK INVOLVED IN TRADING. IT IS NOT PRUDENT OR ADVISABLE TO MAKE TRADING DECISIONS THAT ARE BEYOND YOUR FINANCIAL MEANS OR INVOLVE TRADING CAPITAL THAT YOU ARE NOT WILLING AND CAPABLE OF LOSING.
VANTAGEPOINT’S MARKETING CAMPAIGNS, OF ANY KIND, DO NOT CONSTITUTE TRADING ADVICE OR AN ENDORSEMENT OR RECOMMENDATION BY VANTAGEPOINT AI OR ANY ASSOCIATED AFFILIATES OF ANY TRADING METHODS, PROGRAMS, SYSTEMS OR ROUTINES. VANTAGEPOINT’S PERSONNEL ARE NOT LICENSED BROKERS OR ADVISORS AND DO NOT OFFER TRADING ADVICE.

