| This week’s a.i. Stock Spotlight is CARVANA ($CVNA) |

Carvana (ticker: CVNA), founded in 2013 by Ernest Garcia III, represents a pioneering force in the digitization of car sales, offering a seamless online experience for buying and selling used vehicles. With services including six-day-a-week home delivery and an expansive network of over 8,500 Car Vending Machines nationwide, Carvana went public in April 2017 and has grown to employ nearly 4,000 individuals. Despite facing stiff competition from industry stalwarts like Carmax and AutoNation, Carvana’s most formidable challenge lies in scaling its operations to meet the surging consumer demand.
The advent of e-commerce has undeniably transformed the automotive retail landscape, introducing a wave of innovation led by firms such as Carvana, Vroom, and Shift Technologies. These entities have successfully capitalized on the burgeoning digital economy, attracting significant investor interest, and enabling ordinary Americans to invest in a future reshaped by online retail. The sector is fiercely competitive, driven to new heights of rivalry by digital advancements that have lowered entry barriers and intensified the battle for market dominance.
We did an ai stock spotlight on $CVNA on July 12th, 2023. You can read it here . In that analysis we stated the following:
“Carvana has never been profitable and is bleeding money hand over first. It is releasing its next earnings on February 23, 2023. They are expected to post losses of -$2.30 per share. If the number is smaller than that it will be considered an earnings surprise, and the rally will continue. If not, expect the volatility that $CVNA has experienced over the past year to continue.
Keep in mind that $CVNA has $6 billion in debt on its balance sheet and only $318 million in cash. A few more bad quarters and it will run out of money and will either file for bankruptcy or will be purchased by one of its rivals.
This is why it deserves to be on your trading radar.
We have learned from years and years of observation that when a stock loses almost all its value in a 52-week time frame it is time to put on the discriminating trader hat. These types of meltdowns can and often reverse very quickly.
This type of speculation requires patience for the setup to develop and to be effective it should only be pursued in a very tiny segment of a portfolio. But when guided by the A.I. forecast the opportunity can be very lucrative.”
“The stock’s volatility is off the charts, making it one of the most tumultuous assets we’ve ever analyzed. We chose to scrutinize it primarily because it’s an asset that has shed 98% of its value in less than two years and we correctly anticipated a healthy bounce with the assistance of the ai forecasts in the Dreamboot Wealth Institute Software.
We’ll be closely following the Triple Cross for guidance. Brace for significant volatility post-earnings. For seasoned traders, this could be an excellent opportunity. However, newcomers should proceed with caution.”
Carvana ($CVNA) was without a doubt one of the best-performing stocks on Wall Street not too long ago. From its initial public offering in April 2017 to its all-time high in late 2021, shares skyrocketed more than 3,200%. Investors were extremely bullish on the company’s disruptive potential.
Starting in 2022, the business hit a bit of a rough patch as macroeconomic and industry conditions deteriorated somewhat. But as things start to stabilize, the stock is winning over investors once again.
Carvana has put up a monster 1,137% return since January 2023. That’s impressive. However, the year 2022 marked a period of recalibration for Carvana as it contended with broader economic headwinds and specific challenges within the auto industry. Despite these obstacles, the company has begun to regain its footing, attracting renewed interest from the investment community as conditions begin to stabilize. This remarkable recovery prompts a critical question among investors and analysts alike: Given the dramatic upswing, is it now too late to consider Carvana as a viable addition to growth-focused portfolios, or does the company’s performance indicate underlying strengths that could support further appreciation in its stock price? This analysis seeks to delve deeper into Carvana’s market position, evaluating its prospects in a rapidly evolving landscape.
In this hyper-competitive arena, companies are continuously pressed to evolve, enhancing their service offerings while managing operational costs to sustain healthy margins. The perpetual quest for innovation is not just about staying relevant but also about adapting to the rapidly shifting consumer preferences that characterize the volatile auto e-commerce market.
Customers today seek a harmonious blend of value, affordability, and convenience, setting a high bar for online auto retailers. Achieving an optimal mix of high-quality offerings at reasonable prices, coupled with the ease of transaction, is the crux of succeeding in this space. Retailers are thus compelled to refine their value propositions, often through added services like free shipping, special insurance offers, or exceptional customer support, to differentiate themselves in a crowded market.
A closer look at Carvana’s competitors reveals a diverse landscape of value propositions:
**AutoNation**, founded by Wayne Huizenga in 1996, has cemented its position as a behemoth in online car retailing, leveraging advanced technologies to broaden its market reach and enhance customer service.
**Vroom**, established in 2013, distinguishes itself through a focus on customer convenience, underscored by policies like a 7-day return guarantee and free delivery, driving a satisfying purchasing experience.
**Shift**, with its roots in 2013 and a vision for an effortless, transparent buying process, has leveraged technology to streamline car purchases, earning commendation for its customer-centric approach.
**CarMax**, a trailblazer in the no-haggle car buying experience, has demonstrated remarkable growth since the early 1990s, illustrating the appeal of straightforward pricing and a vast inventory.
**TrueCar** and **Cars.com** have each carved out their niches by facilitating easier connections between buyers and sellers and by offering comprehensive platforms for new and used car transactions, respectively.
Carvana’s financial health has been precarious, marred by escalating operating losses and a daunting $6 billion in long-term debt. This juxtaposition of rapid revenue growth against a backdrop of increasing losses and substantial debt encapsulates the paradoxical nature of Carvana’s financial landscape. The company’s struggle to achieve profitability, amidst such promising growth metrics, underscores the speculative nature of its stock and highlights the intricate challenges faced by pioneers in the digital transformation of traditional industries. The current narrative on $CVNA is that it recently turned its first annual profit since its inception. Bulls on the stock are comparing $CVNA to the early days of Amazon which also bled cash till it finally turned its first profit. However, skeptics point out that $CVNA’s balance sheet holds massive liabilities that will require careful management.
Carvana has escalated its sales from a mere 2,100 vehicles just nine short years ago to a staggering 313,000 cars in 2023. But hold your horses; when we look at the vast ocean of 36 million used vehicle transactions last year across the U.S., Carvana’s market share is still under 1%. What does that tell us? There’s a vast frontier for growth ahead, an expansive horizon that’s just waiting to be claimed.
Carvana isn’t just selling cars; they’re revolutionizing the car buying experience, making the old school, the conventional dealership lot, look like a horse and buggy operation. They’re tapping into the pulse of the digital age, attracting a demographic that’s young, tech-savvy, and hungry for a better way to buy their rides.
Now, let’s talk growth – a topic that gets any investor’s heart racing. Carvana’s revenue has been surging at a compound annual rate of 40.7% over the past five years. Projecting into the future, if Carvana just nabs 3.3% of the market by 2033, we’re talking about a company that could be moving a million cars annually. That’s not just growth; that’s an explosion, pushing the company into a new stratosphere nearly five times its current size.
And here’s where it gets even more interesting – profitability. Historically, Carvana has been chasing the elusive dream of consistent positive earnings, though it did flash us a glimpse of potential with $150 million in net income last year. But imagine, just imagine, if at this new scale, it hits its stride, achieving an EBITDA margin between 8% and 13.5%, catapulting from the 3.1% margin of 2023. We’re not just talking about success; we’re talking about a seismic shift in how we think about buying cars and running a car business. Carvana is not just in the race; they’re looking to redefine it.
Here are the annual revenues for Carvana from 2019 through 2023, showcasing the company’s financial performance over these years:
– **2019**: $3,940 million
– **2020**: $5,587 million
– **2021**: $12,814 million
– **2022**: $13,604 million
– **2023**: $10,771 million
These figures highlight Carvana’s rapid revenue growth from 2019 to 2022, followed by a decline in 2023, reflecting the company’s evolving business landscape and the challenges it faced during that period.
Based on the information provided earlier, here are Carvana’s net earnings (losses) from 2019 forward, demonstrating the company’s financial performance in terms of profitability:
– **2019**: $(365 million) (Net Loss)
– **2020**: $(462 million) (Net Loss)
– **2021**: $(287 million) (Net Loss)
– **2022**: $(2,894 million) (Net Loss)
– **2023**: $150 million (Net Gain)
These figures show that Carvana experienced significant net losses from 2019 through 2022, with the losses peaking in 2022. However, in 2023, Carvana reported a net gain of $150 million, marking a significant turnaround in its financial performance and indicating a shift towards profitability.
Carvana’s shift towards profitability in 2023, as indicated by the net gain reported for that year, suggests several strategic and operational adjustments may have contributed to this improvement. While specific strategies Carvana employed to become profitable in 2023 (and potentially maintaining or enhancing profitability into 2024) were not detailed in the provided information, we can infer several possible factors based on common industry practices and the challenges Carvana faced: Carvana likely focused on streamlining operations, reducing overhead, and enhancing logistical efficiency. This could involve optimizing inventory management, refining the car procurement process, and improving the cost-efficiency of delivery and logistics operations. The company may have achieved higher sales volumes while also working on improving profit margins per vehicle. The bottom line is that as long as $CVNA continues with positive earnings we can anticipate a less volatile stock price with an upward trajectory.
In this weekly stock study, we will look at and analyze the following indicators and metrics as are our guidelines which dictate our behavior on a particular stock.
- Wall Street Analysts’ Estimates
- 52-week high and low boundaries
- Best Case – Worst Case Analysis
- Dreamboot Wealth Institute A.I. Triple Cross Forecast
- Neural Network Forecast
- Daily Range Forecast
- Intermarket Analysis
- Our trading suggestion
We don’t base our decisions on things like earnings or fundamental cash flow valuations. However, we do look at them to better understand the financial landscape that a company is operating under.
Analysts Ratings
The first set of boundaries which we explore in our stock study is what do the professionals think who monitor the stock for a living. We can acquire this information by simply looking at the boundaries that the top Wall Street Analysts set for $CVNA. This initial set of boundaries provides us with an idea of what the analysts on Wall Street who monitor the stock for a living think is expensive, fairly valued, and cheap.
Based on 15 Wall Street analysts offering 12-month price targets for Carvana $CVNA in the last 3 months. The average price target is $65.91 with a high forecast of $90.00 and a low forecast of $45.00 . The average price target represents a -25.45% change from the last price of $88.41.

We can quickly deduce that the stock is currently trading close to the top end of the expected trading forecasts. However, make sure you also look at the variances between the most bullish and most bearish forecast. This variance is $45 or 51% of the current price. It is important to pay attention to this value as it often is a predictive precursor of anticipated volatility.
This giant variance in price estimates from Wall Street Analysts who watch the stock 24/7 show you how much volatility and uncertainty is baked into $CVNA at the present time.
52-Week High-Low Boundaries
We always advise traders and investors to be aware of the 52-week trading range of any stock they are looking to get involved in. The reason is that the 52-week boundaries can often tell a very important story.

We want to focus our trading capital on stocks that are trending, and a quick glimpse of the chart will allow us to see whether a trend is occurring. However, one of our favorite trading setups is to pay very close attention to stocks that are making new 52-week highs. Whenever this occurs, we must acknowledge that the company is overcoming obstacles.
Being aware of the 52-week high and low boundaries of a stock is crucial for traders because these markers offer insights into the stock’s historical performance range, serving as potential indicators of psychological resistance and support levels among investors. While the traditional Wall Street adage encourages buying low and selling high, an often more lucrative strategy is to identify a strong upward trend and adopt a “buy high, sell higher” approach. This strategy capitalizes on the momentum of a stock that is consistently breaking past its 52-week high, signaling strong investor confidence and potential for further gains. The 52-week metric, a standard reference in financial markets, emerged from the need to assess a stock’s performance within a relatively stable, annual timeframe, providing a snapshot of its volatility and trend strength over a period that captures a variety of market conditions. This historical context enriches the decision-making process, allowing traders to position themselves advantageously in the market by leveraging these psychological benchmarks.
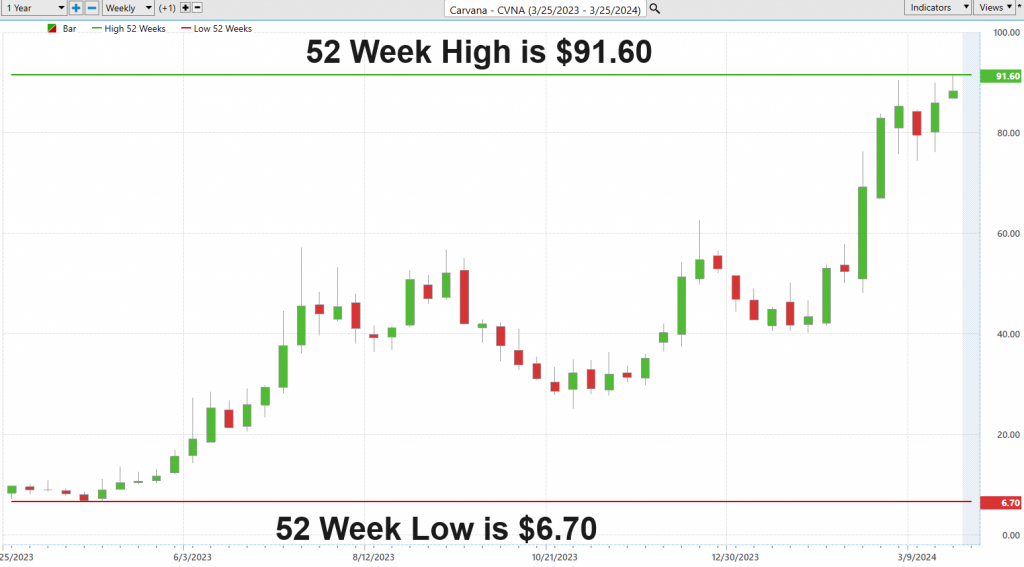
When we zoom out on $CVNA and look at the longer-term charts we can see how volatile the stock has been and how incredible the recent rebound was.
Observe how the 52-week lows were tested numerous times while the stock consolidated, built a foundation, and rocketed higher.
Best Case/Worst Case Analysis
In trading, mastering the delicate balance between risk and reward stands as a pivotal principle for all traders. Among the myriad of tactics employed to navigate this balance, the method that often strikes with remarkable precision is the best-case/worst-case analysis. This technique, grounded in both pragmatism and foresight, involves a detailed examination of contrasting optimistic pessimistic outcomes, all through the lens of historical chart analysis over the preceding year.
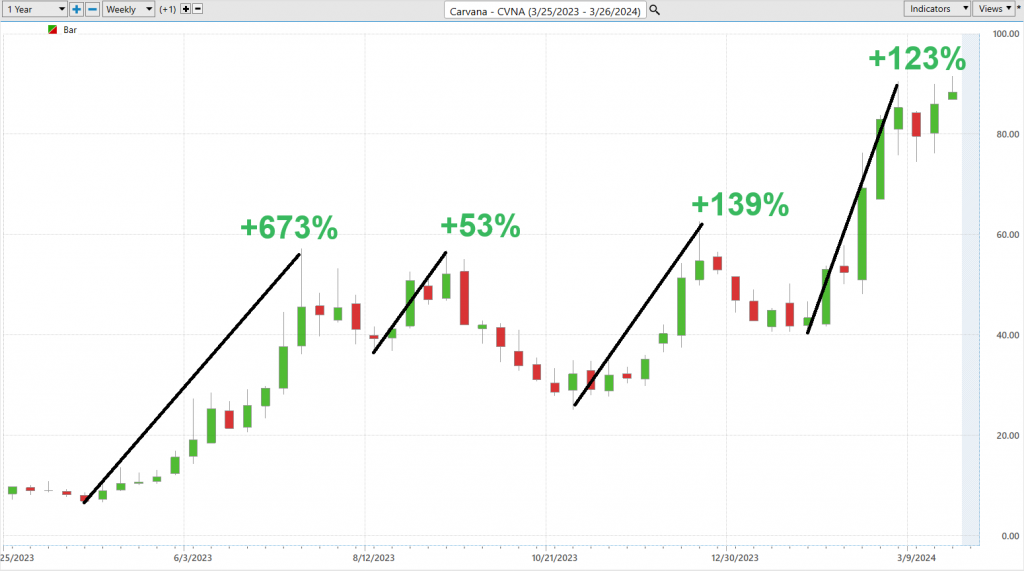
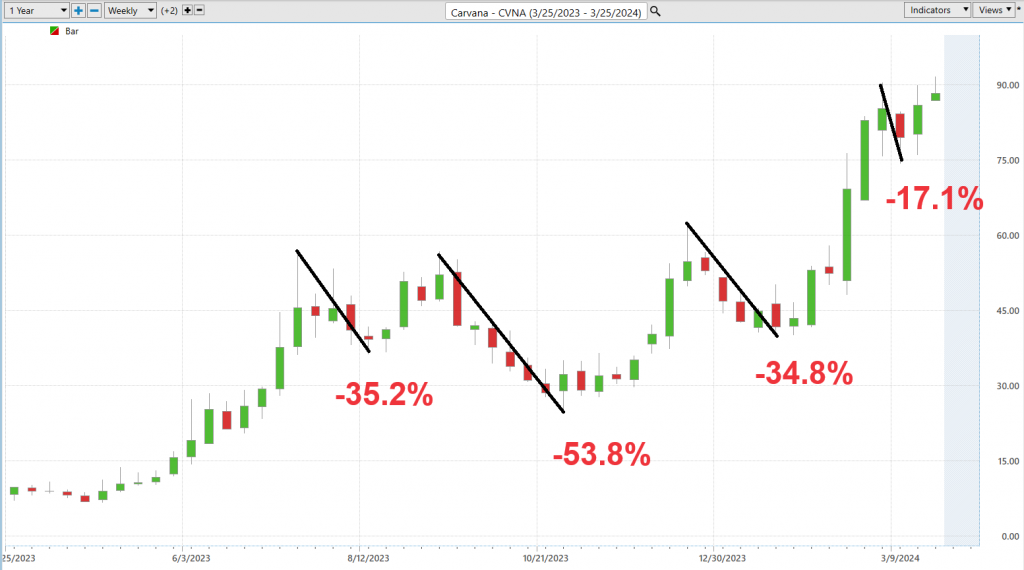
Employing this methodology requires a discerning eye for chart analysis, skillfully drawing connections between the peaks of rallies and the bottoms of economic downturns. This exercise in comparison offers a balanced view, evaluating periods of expansion against moments of contraction. It is a very simple and practical perspective of evaluating risk versus reward. You, as a trader, can enter a market knowing what the outcomes have been over the past year.
It is always wise to measure the magnitude of these upward surges against downward spirals on a chart. This comparison provides clear insights into the inherent risks and potential rewards of the previous year.
To distill it further: examining these highs and lows transcends mere analytical exercise; it’s akin to decoding the market’s underlying currents of volatility. It presents a clear-eyed view of the landscape you’re venturing into, stripping away any superfluous details.
This is far from an academic exercise; it’s a practical blueprint for navigating the financial markets. By considering both the victories and setbacks, traders gain a comprehensive view of a stock’s range of outcomes. This method isn’t just about chasing after profits; it’s about preparing for the full gamut of possibilities. By delving into this analysis, investors are equipped for the market’s inevitable fluctuations. The objective extends beyond mere numerical analysis; it’s about forging a strategy that empowers traders with the foresight to sail through market volatility. And rest assured, the charts we delve into are not merely illustrative; they serve as quintessential guides, leading the way through the complexities of market volatility with precision and insight.
Here is the best-case analysis:
Followed by the worst-case analysis:
Next, we compare $CVNA to all the broader stock market indexes:

To say that $CVNA has outperformed is an understatement of all understatements. We need to recognize that this comparative analysis begins just as $CVNA was testing its 52-week lows, which makes the metrics almost appear exaggerated.
In our analysis, a crucial element to consider is the volatility of Carvana ($CVNA) relative to the broader market, an assessment effectively captured through the lens of Beta. Beta serves as a pivotal metric, quantifying a stock’s volatility in contrast to the market at large. A Beta value of 1 signifies that a stock’s price movement is aligned with the market. Conversely, a Beta exceeding 1 indicates a stock with higher volatility, while a figure below 1 points to less volatility than the market average.
Carvana ($CVNA), with a Beta of 3.32 over the preceding five years, demonstrates a volatility rate 232% above the broader market. This elevated Beta underscores Carvana’s position as a stock that not only has significantly outpaced market performance but also comes with a heightened degree of volatility and associated risk. For investors and analysts, this distinction is paramount, offering insight into the risk-return profile intrinsic to $CVNA in the context of diversified investment strategies.
Dreamboot Wealth Institute A.I. Predictive Blue Line Analysis
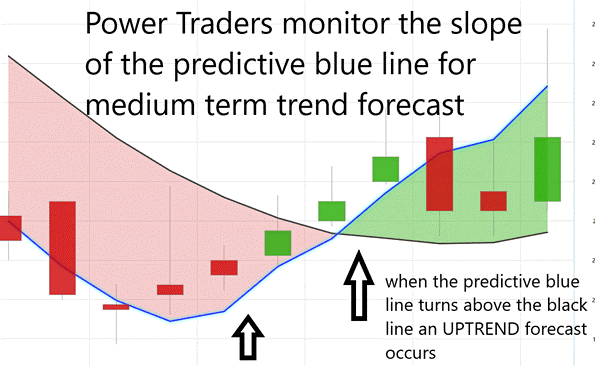
In the realm of financial analysis, the emergence of a predictive blue line as a key indicator cannot be understated. It serves as a fundamental guide for traders, suggesting a prudent approach to engage in purchases at or beneath this line’s value amid upward market trends. This strategy emphasizes the critical need to marry historical market data, as represented by the traditional black line, with forward-looking insights provided by the blue line. Such a nuanced understanding is paramount for those dedicated to executing well-informed trading decisions.
At the heart of this innovative forecasting lies Dreamboot Wealth Institute’s proprietary technology, which melds Neural Network capabilities with Intermarket Analysis to offer a cutting-edge perspective on an asset’s future direction. This technology delves into the asset’s most pivotal price influencers, leveraging a complex array of artificial intelligence and statistical methods to forecast market movements. The moments when the predictive blue line crosses above the historical black line are indicative of potentially lucrative entry points for traders, as these instances are often accompanied by upward trends (UP arrows) on the chart. Conversely, a descent of the blue line beneath the black line serves as a harbinger for downward market trends, suggesting an optimal juncture for market exit or short positioning.
By avoiding mere speculation in favor of an informed analysis, this approach arms traders with a comprehensive understanding of both the current market trend and the valuation zone. A three-month retrospective analysis of the $CVNA stock, through this AI-enhanced framework, underscores the significant role artificial intelligence plays in augmenting real-time trading decisions. Hence, for investors aiming to blend traditional market prudence with cutting-edge technological insights, Dreamboot Wealth Institute Software emerges as an invaluable tool.
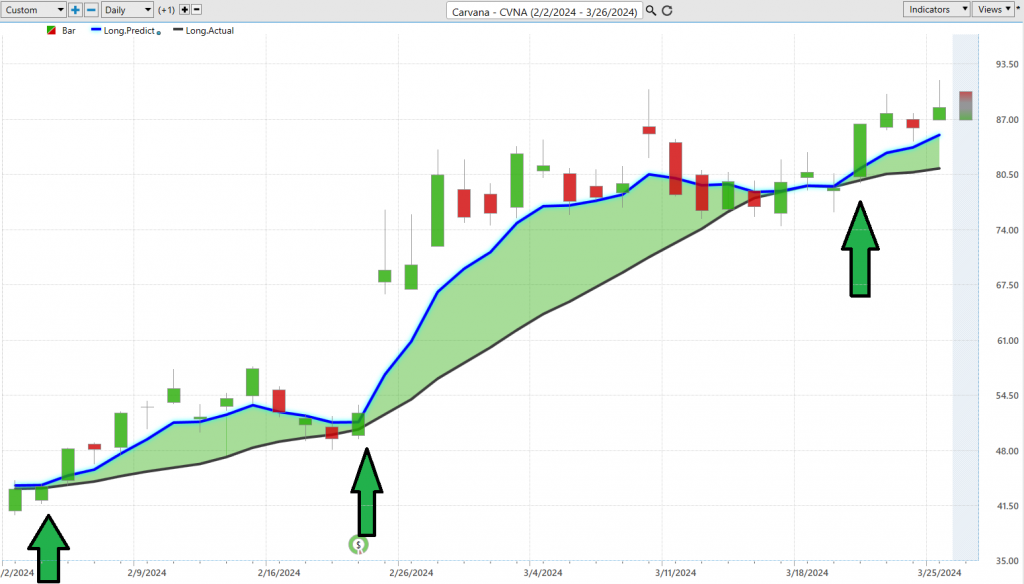
This practical method has yielded has successfully forecasted the powerful, yet volatile trend of $CVNA over the past few months. Observe how the slope of the predictive blue line correctly anticipated the future trend of the stock.
Neural Index (Machine Learning)
A neural network, in the context of trading, is an advanced form of artificial intelligence (AI) that mimics the human brain’s ability to recognize patterns and make decisions. It’s constructed using layers of nodes, or “neurons,” which are interconnected and work together to process and analyze data. Each neuron receives input, performs a simple computation on it, and passes the output to the next layer of neurons. The network “learns” by adjusting the connections (weights) between neurons based on the input data it receives and its success in predicting outcomes.
Training the network involves feeding it historical data and allowing it to make predictions. The network’s predictions are then compared to actual outcomes, and the weights are adjusted to minimize prediction errors. This process is repeated numerous times, allowing the network to improve its accuracy. Neural networks can significantly enhance traders’ decision-making by providing more accurate predictions of market movements. They can analyze vast amounts of data at speeds and depths impossible for human traders, identifying complex patterns and trends that may not be immediately apparent. This can lead to better timing of trades, identification of new trading opportunities, and improved risk management.
Neural networks are used in a wide range of fields beyond trading, including:
– **Healthcare**: For diagnosing diseases and predicting patient outcomes.
– **Finance**: Beyond trading, for credit scoring and fraud detection.
– **Image Recognition**: In security systems and medical imaging analysis.
For the trading community, neural networks unveil the latent intricacies of market patterns and dynamics, previously obscured from human analysis. By assimilating and learning from extensive historical data, these networks possess the unique capability to forecast future market trends with unparalleled precision. This evolutionary adaptability, honed through continuous data assimilation, renders neural networks an indispensable asset for optimizing trading strategies, reducing exposure to risk, and capitalizing on profit opportunities.
Embodied within the realm of trading AI, neural networks epitomize the pinnacle of technological advancement, imitating the brain’s capacity for complex problem-solving. This dynamic, learning-oriented system adeptly navigates through the vast data landscapes, progressively refining its predictive accuracy. Such integration of technological sophistication with financial insight equips traders with profound market understanding.
In the high-stakes arena of trading, where precision and timing are paramount, neural networks emerge as a linchpin of accuracy and predictive clarity. They mitigate the margin for human error, enhance decision-making precision, and ensure traders remain at the forefront of a vigilant and competitive market landscape.
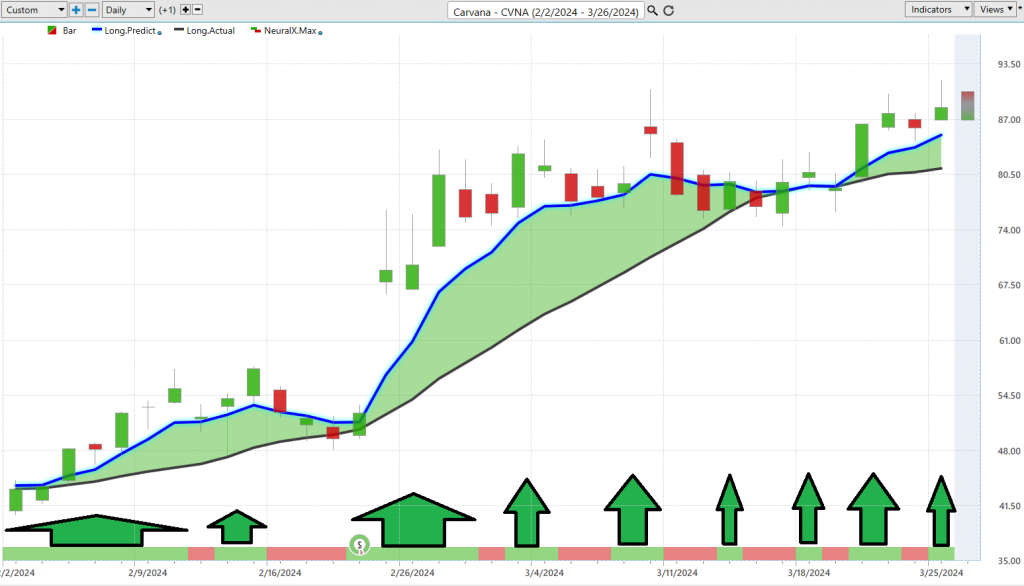
Take, for instance, Carvana ($CVNA) and its utilization of Dreamboot Wealth Institute’s A.I. Neural Index Indicator. Traders leverage this cutting-edge tool for “double confirmation,” aligning the predictive blue line’s trajectory with insights from the Neural Net Indicator to forge a potent blend of data-driven analysis and forecasting. The arrows on the chart above are the moments of double confirmation. These are the instances when the a.i. and the neural index were both forecasting the same future trend direction and are considered very high probability trades.
Traders should pay attention to neural networks because they represent the cutting edge of market analysis and prediction technology. With financial markets becoming increasingly complex and data-driven, the ability to quickly analyze and act on large datasets is becoming a critical advantage. Neural networks offer the promise of higher profitability through better predictions and risk management. Additionally, as the technology continues to evolve and improve, it is expected that the use of neural networks in trading will become more widespread, making familiarity with them an essential skill for traders.
Dreamboot Wealth Institute A.I. Daily Range Forecast
One of the paramount challenges faced by swing traders is the critical decision-making process of pinpointing the most opportune moments to enter and exit the market. This precision is essential for capitalizing on short-term price movements without being swept away by the market’s inherent volatility. The dilemma of identifying the precise thresholds for buying and selling not only requires a deep understanding of market dynamics but also an ability to forecast future movements with a high degree of accuracy. Traditional methods, while useful, often fall short of providing the granularity and foresight needed to make these decisions with confidence. This gap leaves traders in search of tools that can offer more definitive guidance in timing their trades to maximize potential gains while minimizing risks.
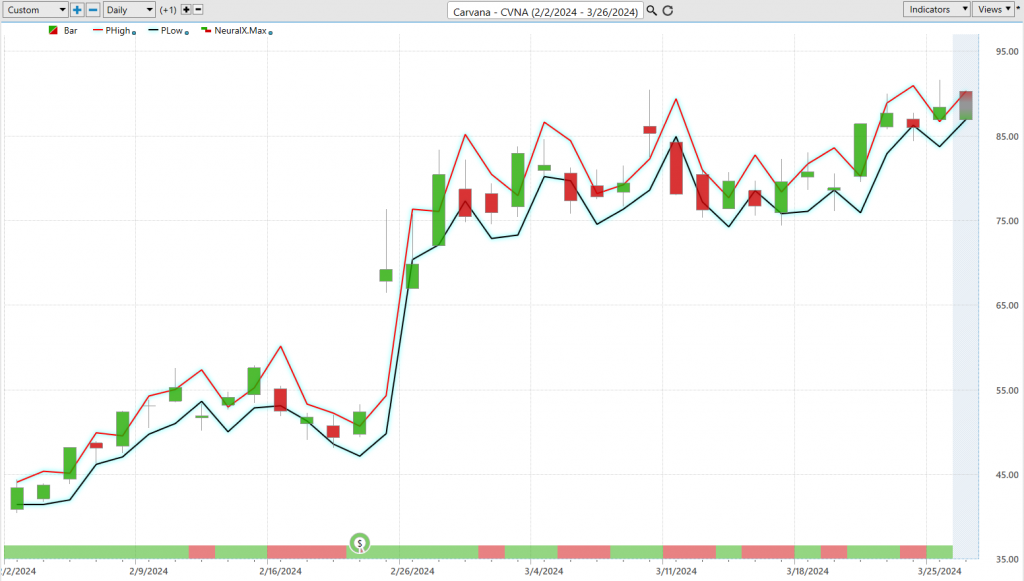
Enter AI Financial Navigator 4.0 and its daily range forecast, a pioneering solution that addresses this exact challenge with remarkable precision. Leveraging advanced artificial intelligence, including neural networks, Dreamboot Wealth Institute analyses vast amounts of market data to predict future price movements. What sets it apart is its ability to provide a specific daily price range forecast, offering swing traders clear insights into potential high and low prices for the day ahead. This capability allows traders to set more informed buy and sell points, significantly enhancing their strategy by basing decisions on predictive analytics rather than retrospective analysis or speculative forecasting. The daily range forecast acts as a compass in the often-tumultuous sea of market trading, guiding traders with evidence-based predictions that demystify the complexities of timing in swing trading. This tool empowers traders to approach the market with a newfound level of confidence and strategic advantage, making it an indispensable asset in the trader’s toolkit.
First observe the trading ranges of $CVNA for the daily, weekly, and monthly time frames.

While these values are relevant in terms of telling us what the market has done, the question still remains, “how do we apply them?” Next, these values are gargantuan which is why we always advise very careful position sizing when confronting this level of volatility. It is very rare that you find a stock with this level of outsized volatility. It commands your respect.
Shifting focus to the Dreamboot Wealth Institute A.I.’s Daily Range Forecast chart unveils a tool that transcends the ordinary, serving as an indispensable navigator for practitioners of short-term swing trading. Here, we are presented with a sophisticated forecast of daily market movements, a beacon for those navigating the choppy waters of the financial markets.
In the fast-paced arena of short-term swing trading, the margin for error is slim, and the value of precision cannot be overstated. This is where the Daily Range Forecast, powered by Dreamboot Wealth Institute A.I., comes into play. Harnessing the combined might of artificial intelligence, machine learning, and advanced neural networks, this tool ventures beyond mere data analysis. It anticipates the market’s daily ebb and flow, providing traders—affectionately dubbed Power Traders—with the insights needed to expertly chart their course. Through this technological marvel, traders gain the ability to pinpoint the most opportune moments for market entry and exit, executing their strategies with a level of precision previously unattainable.
Intermarket Analysis
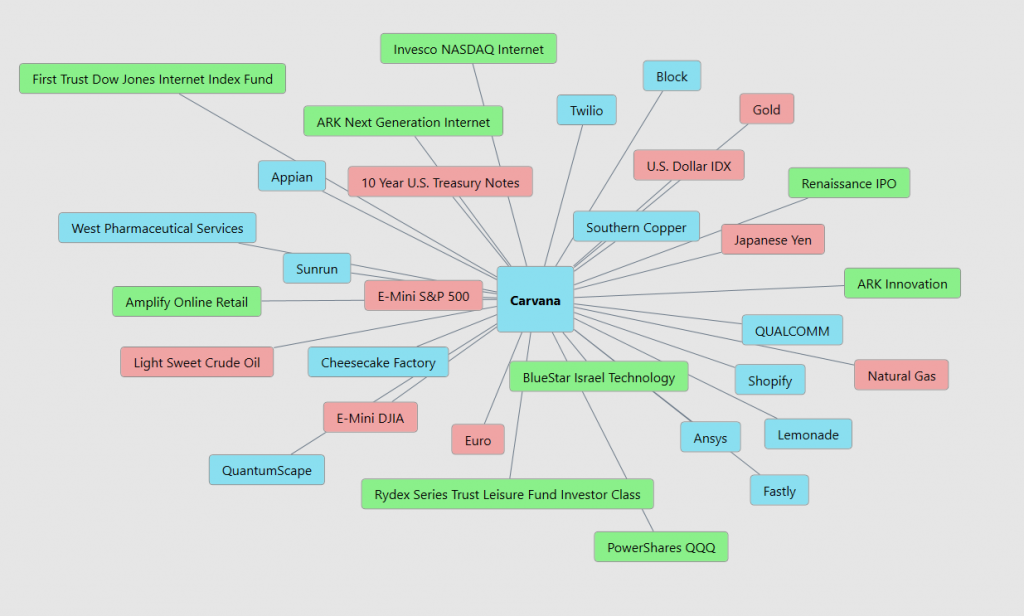
Intermarket analysis is a method used in trading that acknowledges and explores the connections between different financial markets, such as stocks, bonds, commodities, and currencies. The basic premise behind this approach is that these markets do not operate in isolation; instead, they influence each other in various ways. For instance, a significant change in the interest rates set by a central bank can affect currency values, which in turn can impact commodity prices and stock markets worldwide. By analyzing these relationships, traders can gain a comprehensive view of the financial landscape, helping them to predict market movements more accurately. For a newbie trader, understanding intermarket analysis means recognizing that financial markets are interconnected ecosystems where changes in one area can ripple through others, offering clues about future movements across the board.
The value of intermarket analysis for a new trader lies in its ability to provide a more holistic approach to trading decisions. Instead of focusing solely on the performance of individual stocks or sectors, intermarket analysis encourages looking at the bigger picture, considering how global economic factors and market relationships might influence market trends. This broad perspective can help traders identify opportunities they might miss when only analyzing a single market, and it can also serve as a risk management tool, alerting them to potential market downturns signaled by movements in related markets. In essence, intermarket analysis equips traders with a macro-level understanding of market dynamics, which is crucial for navigating the complexities of trading with confidence and insight.
Here are the 31 key drivers of Carvana’s stock price:
Our Suggestion
Investor sentiment towards Carvana appears to be strengthening as the company endeavors to fortify its balance sheet. With management projecting an uptick in unit sales for the coming year, there’s an emerging belief that earnings will become the pivotal force driving Carvana’s trajectory.
Mark your calendars: the next earnings call for Carvana is scheduled for May 2, 2024. Current analyst forecasts anticipate a loss of $0.80 per share. Should these projections hold true, it’s conceivable that Carvana will face significant challenges in the market.
Despite recent gains, Carvana’s stock value remains a considerable 78% beneath its historical peak but is currently trading at the top end of analyst’s annual forecasts. This raises the question: can this pioneer in online used car sales accelerate its recovery, potentially increasing by 25% to hit a $100 valuation by year-end 2024?
The landscape has been rough since 2022, with higher interest rates and a softening used car market impacting Carvana adversely. However, a shift towards lower interest rates could significantly enhance the company’s outlook.
In a strategic pivot, Carvana’s management has implemented substantial cost-cutting measures, trimming $1.1 billion in annual expenses. This fiscal prudence bore fruit last year, culminating in a surprising $150 million net income—the company’s first instance of annual profitability.
Given the stock’s remarkable rally over the previous year, achieving a $100 valuation by the close of 2024 might seem within reach with modest gains. Yet, it’s equally plausible that investors, looking to capitalize on recent gains, may begin to liquidate some of their holdings, potentially exerting downward pressure on the stock.
Traders are advised to leverage A.I.-driven forecasts for daily market insights. In navigating Carvana’s shares, a disciplined approach to money management and position sizing is indispensable, especially as the company continues its journey towards financial stability amidst expected volatility.
We advise that you practice good money management on all of your trades and that you follow the A.I. forecast for your trend analysis to determine optimal entries and exits.
Let’s Be Careful Out There!
Remember, It’s Not Magic.
It’s Machine Learning.
Disclaimer: THERE IS A HIGH DEGREE OF RISK INVOLVED IN TRADING. IT IS NOT PRUDENT OR ADVISABLE TO MAKE TRADING DECISIONS THAT ARE BEYOND YOUR FINANCIAL MEANS OR INVOLVE TRADING CAPITAL THAT YOU ARE NOT WILLING AND CAPABLE OF LOSING.
Dreamboot Wealth Institute’S MARKETING CAMPAIGNS, OF ANY KIND, DO NOT CONSTITUTE TRADING ADVICE OR AN ENDORSEMENT OR RECOMMENDATION BY AI Financial Navigator 4.0 OR ANY ASSOCIATED AFFILIATES OF ANY TRADING METHODS, PROGRAMS, SYSTEMS OR ROUTINES. Dreamboot Wealth Institute’S PERSONNEL ARE NOT LICENSED BROKERS OR ADVISORS AND DO NOT OFFER TRADING ADVICE.

