| This week’s a.i. Stock Spotlight is NVIDIA ($NVDA) |
NVIDIA Corporation ($NVDA) stands as a stalwart in the domain of graphics processing units (GPUs) and computing technologies. Founded in 1993 by Jensen Huang, Chris Malachowsky, and Curtis Priem, NVIDIA has become synonymous with cutting-edge advancements in graphics, artificial intelligence (A.I.), and parallel computing. NVIDIA’s name originates from “invidia,” the Latin word for envy, symbolizing its ambition to drive envy-worthy technological innovations . NVIDIA generates its revenue through a diversified portfolio of technology products and services, including but not limited to, GPU sales for gaming and professional visualization, data center platforms, automotive technology solutions, and A.I. computing technology. Over the years, NVIDIA has strategically expanded its revenue streams, currently boasting multiple profit centers across these segments. The company’s innovative approach and broad product lineup have enabled it to establish a robust financial performance and a solid market position. Analysts on Wall Street who are optimistic on $NVDA claim that the company will continue to be the primary beneficiary of an economy moving quickly towards robotics and artificial intelligence.
Over the last five years, NVIDIA has witnessed robust revenue growth, driven by the increasing demand for GPUs in gaming, A.I., and data center applications. The company has consistently delivered strong earnings, showcasing its operational efficiency and market dominance. NVIDIA’s GPU technology powers some of the most advanced supercomputers worldwide, facilitating scientific research and breakthrough discoveries. NVIDIA’s GPUs are utilized in various industries beyond gaming, including healthcare (for medical imaging), finance (for algorithmic trading), and entertainment (for visual effects). NVIDIA’s deep learning technologies have been instrumental in medical research, aiding in the diagnosis of diseases and drug discovery processes.
NVIDIA faces competition from companies like AMD (Advanced Micro Devices), Intel, and Qualcomm in different segments of its business. Despite this competition, NVIDIA has maintained its position as a leader in the GPU market, continually pushing the boundaries of innovation and performance.
The biggest opportunity for NVIDIA lies in the proliferation of A.I. and machine learning applications, which demand powerful computing solutions. Additionally, the growth of cloud computing and autonomous vehicles presents avenues for expansion. However, the company also faces risks related to market saturation, technological disruptions, and geopolitical uncertainties. NVIDIA became profitable within a few years after its founding, showcasing the demand and potential of GPU technology in both gaming and professional markets. Since then, the company has maintained strong financial health, which is also reflected in its debt management strategies. While specific debt figures vary over time, NVIDIA has traditionally managed its debt and financial leverage carefully to sustain growth and invest in research and development.
Here is a quick revenue and earnings analysis over the last 5 years which clearly shows an explosive level of growth.
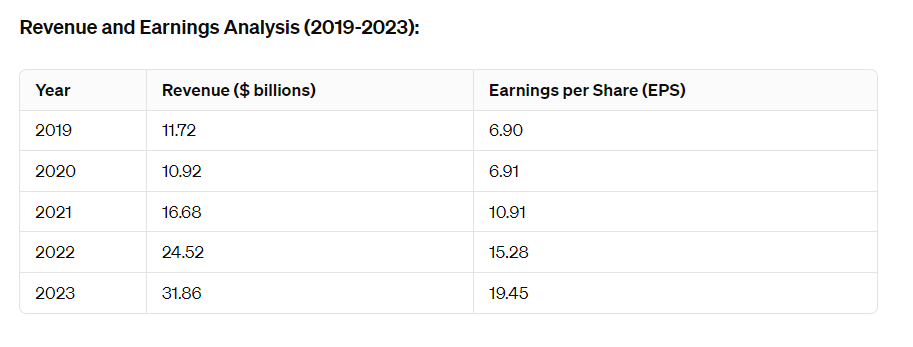
NVIDIA’s financial metrics highlight its robust profitability and efficiency. The company’s significant year-over-year quarterly earnings and revenue growth rates are particularly noteworthy, indicating a strong upward trajectory in its financial performance.
In the last decade, NVIDIA has strategically acquired several companies to bolster its product offerings and technological capabilities. Notable acquisitions include Mellanox Technologies, a leading provider of high-performance networking solutions, and Arm Holdings, a semiconductor and software design company.
Within the realm of indexes, $NVDA holds a significant presence. Firstly, it’s a vital constituent of the NASDAQ-100 Index, encapsulating the top 100 non-financial giants on the NASDAQ exchange, flaunting a robust 7% weighting. Secondly, it commands a spot in the prestigious S&P 500 Index, encompassing America’s 500 corporate titans, boasting a respectable 3.61% weighting in the same timeframe. And thirdly, it stands tall within the PHLX Semiconductor Sector Index, the bedrock for semiconductor industry performance evaluation, flexing its muscles with a hefty 7.54% weighting.
I will briefly touch on the importance of these indexes in this stock study, showcasing the reality that as goes $NVDA so often goes the broader market.
In this stock study we will look at the following metrics and indicators.
- Wall Street Analysts’ Estimates
- 52-week high and low boundaries
- Dreamboot Wealth Institute A.I. Predictive Blue Line
- The Best Case – Worst Case Scenarios
- Neural Network Forecast
- Daily Range Forecast
- Intermarket Analysis
- Our trading suggestion
We don’t base decisions on things like earnings or fundamental cash flow valuations. However, we do look at them to better understand the financial landscape that a company is operating under.
Wall Street Analysts’ Estimates
Based on 38 Wall Street analysts offering 12-month price targets for Nvidia in the last 3 months. The average price target is $703.30 with a high forecast of $1,100.00 and a low forecast of $560.00 . The average price target represents a -2.49% change from the last price of $721.28.

We typically like to look at the variance between the most bullish and bearish forecasts and use that as a gauge for future expected volatility. Currently this variance is 75% or $540 which is considered very high.
We find this variance valuable as often rallies and declines are confined to this level of volatility.
52-Week High and Low Boundaries
Over the past 52 weeks $NVDA has traded as high as $746.11 and as low as $204.21.
The annual trading range was $541.90 . These numbers provide us with an accurate perspective of historic volatility which we can calculate by comparing the annual trading range to the current price. Over the last 52 weeks the historic volatility was 75% which is HIGH in comparison to the broader stock market indexes. This value tells us that based upon the recent past it would be perfectly normal to expect prices to trade 75% higher and or lower over the next 52 weeks. Equally of importance is the fact that $NVDA is trading at it 95 th percentile of the last 52 weeks.

When analyzing trading opportunities, you simply can’t overlook the cornerstone: a stock’s 52-week high and low. Let’s take a gander at $NVDA for instance. Now, these boundaries aren’t just numbers; they’re akin to a report card, a clear gauge of a stock’s performance over the past year. It’s all about grasping the historical context, deciphering the trends, and catching the vibe of that stock’s journey.
The 52-week boundaries offer more than just numerical data. They provide a glimpse into the stock’s momentum, its staunch support, and daunting resistance levels. If a stock’s been scaling higher peaks and forging deeper valleys, it’s a bullish bonanza. Conversely, if it’s trudging down the path of lower highs and lower lows, that’s a bearish tale unfolding right before our eyes. And mind you, these boundaries also unveil the sentiments of investors – are they brimming with optimism near the 52-week high or succumbing to jitters close to the 52-week low?
But here’s the kicker, folks – when you’re navigating the volatility of the market, those 52-week highs and lows hold sway. If a stock vaults above that 52-week high, it’s a beacon, signaling it might just be the opportune moment to dive in. Conversely, if it tumbles below that 52-week low, well, consider it a crimson flag waving right in your face.
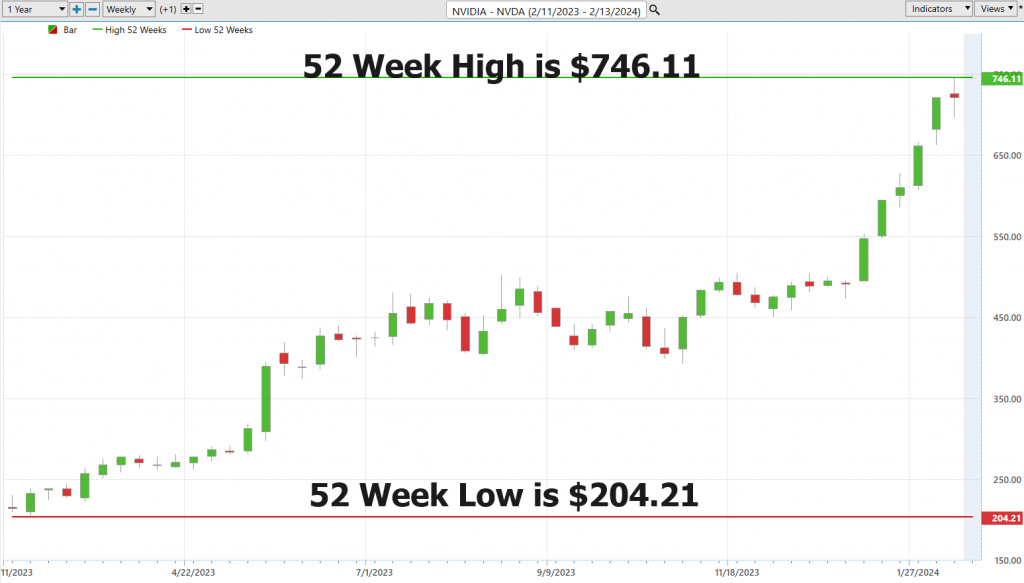
So, let this be etched in your mind: when you’re dissecting a stock, ALWAYS start with the 52-week boundaries – they’re the bedrock upon which you construct your investment blueprint, and they’ll serve as your North Star.
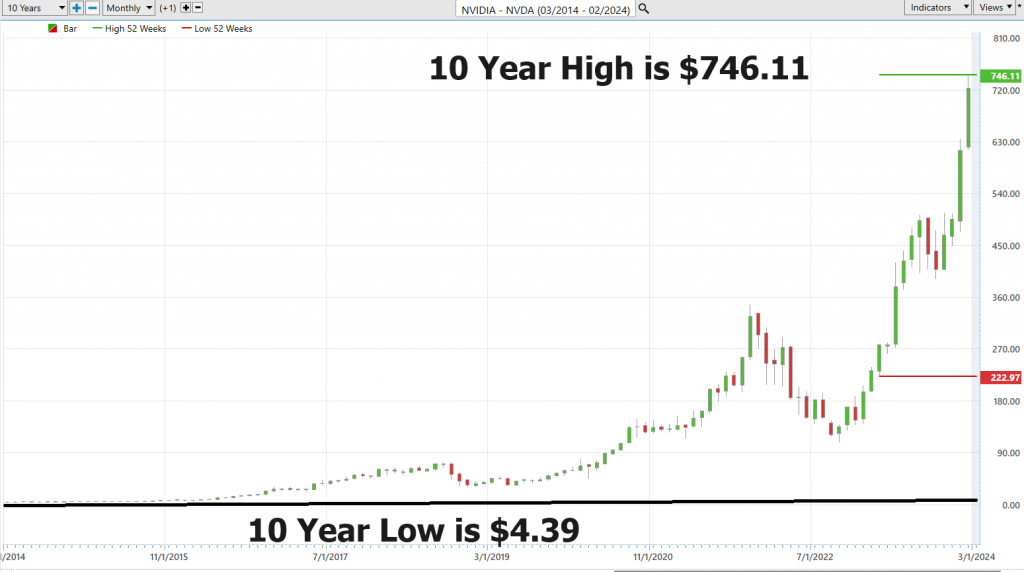
Next zoom out to the 10-year chart to get a better picture of the longer-term secular trend. These two actions are the foundation of a practical and useful analysis for any stock that you are looking to trade. $NVDA is clearly winning. Over the last 10 years $NVDA is 4592%!
As long time readers of our ai stock studies will concur, one of our all time technical trading setups is monitoring stocks that are making new 52 week highs and simultaneously making new 10 year highs. Whenever this occurs, the probabilities for trend continuation are extremely large. $NVDA has been in this “SETUP” for the last 4 months.
Best Case – Worst Case Scenario
Let’s delve into a critical tool that every savvy investor and trader should have in their arsenal – understanding the delicate balance between risk and reward. It’s not about complex strategies; it’s about a straightforward analysis that lays bare the best-case and worst-case scenarios. Imagine this: we’re charting the peaks and troughs of market movements over the past year, akin to navigating the tumultuous waves of a stormy sea. This is your key to unlocking the truth about risk and reward amidst real-world volatility.
Picture this scenario, folks: we’re connecting the dots between the strongest rallies and the strongest declines, akin to measuring the ebbs and flows of those waves. This isn’t just about market jargon; it’s about gaining a profound insight into the essence of risk and reward in the stock market. By doing this simple and practical exercise you can quickly understand the best case and worst-case scenarios.
So, here’s the crux of the matter: we need to carefully evaluate those bullish rallies against the bearish downturns. It’s like sailing through choppy waters, where understanding the stakes – risk and volatility – is paramount. But this isn’t just a fancy maneuver; it’s a strategic mindset. By dissecting both the peaks and valleys, we gain a comprehensive understanding of a stock’s potential. It’s not merely about projecting future gains; it’s about embracing the realities of risk as well. This approach acts as our guiding beacon through the turbulent seas of market fluctuations, revealing the true dynamics of assets.
So, don’t just skim through those charts; truly absorb them. This isn’t just about tactics; it’s about crafting a robust strategy that empowers you to make well-informed decisions, manage your exposure, and construct an investment plan that can weather any storm.
Now, let’s dive into the nitty-gritty. From this Dreamboot Wealth Institute, we can instantly grasp the potential rewards and risks of the past year for $NVDA.
Firstly, let’s outline the best-case scenario:
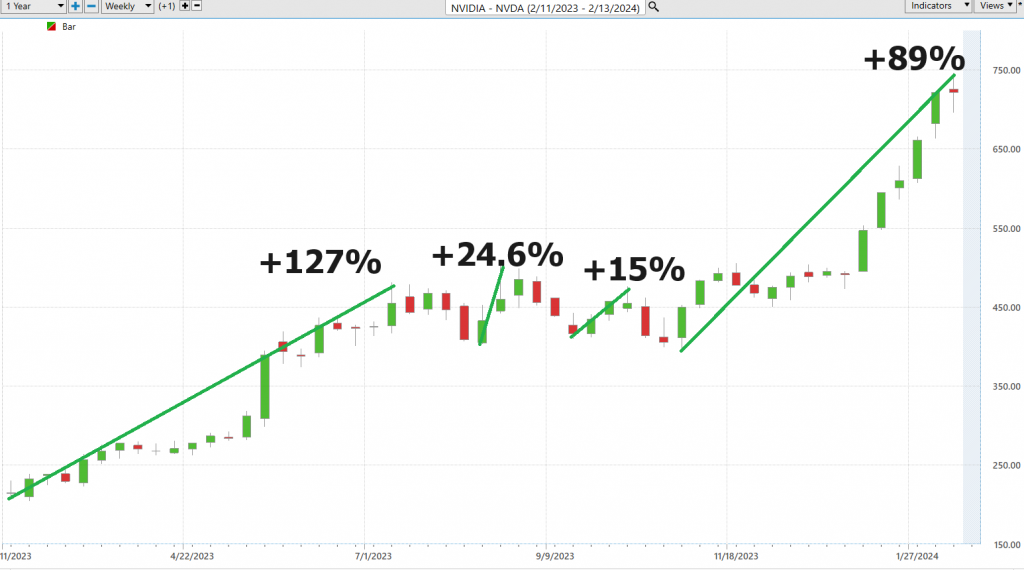
Now, onto the worst-case scenario:
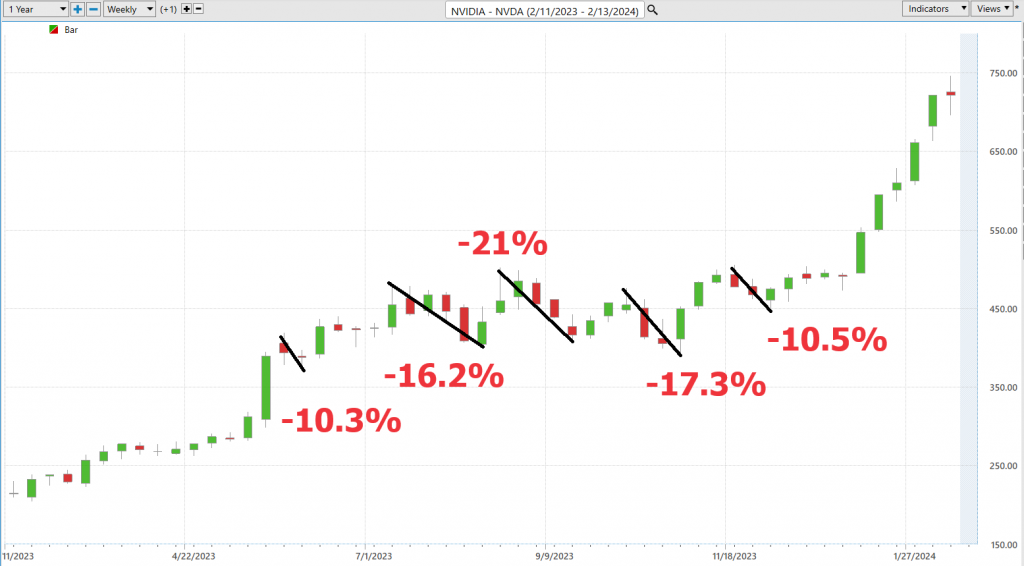
Viewed from this perspective we can immediately see the reward and risk of the past year for $NVDA and can quantitatively see what the rallies and declines have looked like. Clearly the bulls are in control and the declines have been quite mild in comparison.
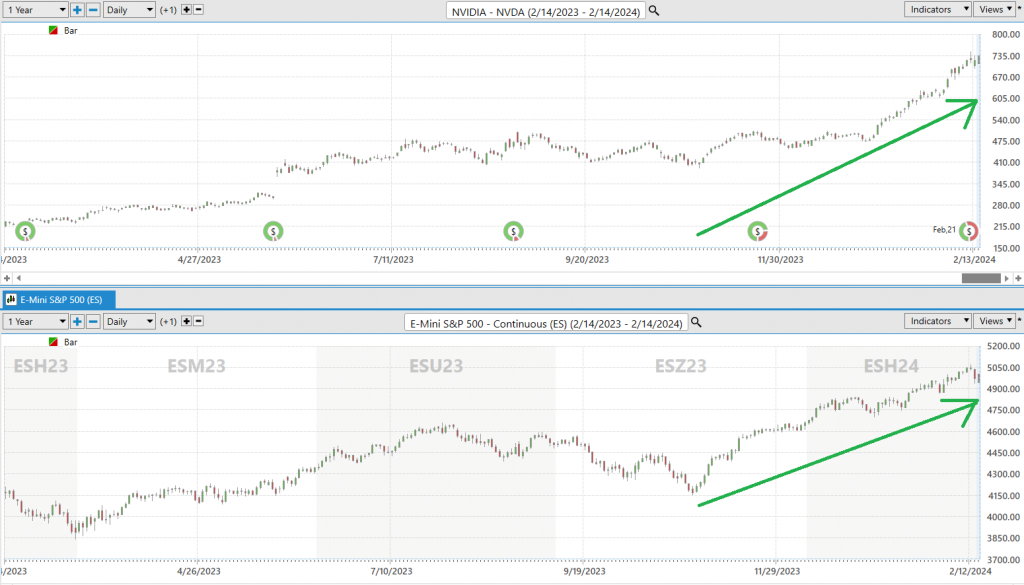
Next, we need to compare $NVDA to the broader stock market indices. By doing so we can immediately see that $NVDA has massively outperformed the broader market.

Clearly, $NVDA has massively outperformed the broader market.
Last but not least we need to compare the volatility of $NVDA to the broader market. This is done by looking at BETA. Beta is a measure of a stock’s volatility in relation to the overall market. A beta of 1 indicates the stock tends to move in line with the market, while a beta greater than 1 suggests higher volatility, and a beta less than 1 implies lower volatility compared to the market.
NVIDIA ($NVDA), over the past 5 years, exhibits a beta of 1.72, indicating it is 72% more volatile than the broader market . So in $NVDA we have a stock which has massively outperformed the broader market with 72% more volatility.
The Dreamboot Wealth Institute A.I. Predictive Blue Line
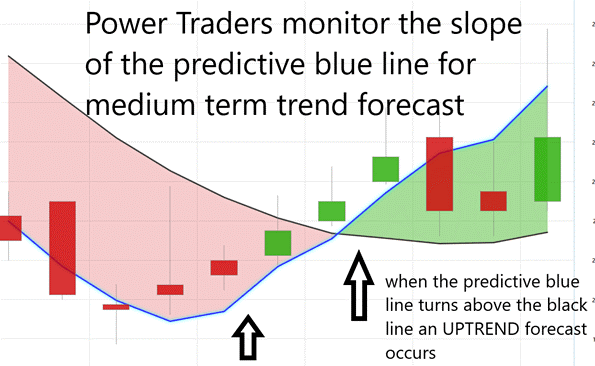
Our guiding principles are as follows:
– The trajectory of the predictive blue line dictates the trend forecast and overall trajectory of $NVDA.
– Ideally, the VALUE ZONE is determined to seek buying opportunities at or below the predictive blue line or selling opportunities above it during a downtrend.
– Naturally, as the predictive blue line slopes downward, traders anticipate lower prices, either retreating to the sidelines or hedging their positions.
Through Dreamboot Wealth Institute Software and its artificial intelligence, traders are apprised of trend forecasts by monitoring the slope of the predictive blue line.
In the swift currents of today’s market, traders seek effective tools and strategies to navigate this intricate financial landscape. Enter Dreamboot Wealth Institute Software, a pioneer in artificial intelligence, offering traders a precise lens into risk and reward analysis. At its core lies the predictive blue line, illuminating market trends with precision.
Envision this predictive blue line as your financial beacon, its slope a dependable guide to market direction. An upward slope signals a bullish market, inviting strategic buying opportunities. Conversely, a downward trend hints at a market downturn, signaling potential selling points.
The predictive blue line identifies the ‘value zone’ – a strategic realm for traders. In an uptrend, this zone, situated just below the blue line, beckons savvy investors. It represents a convergence of price and intrinsic value, revealing the asset’s true worth.
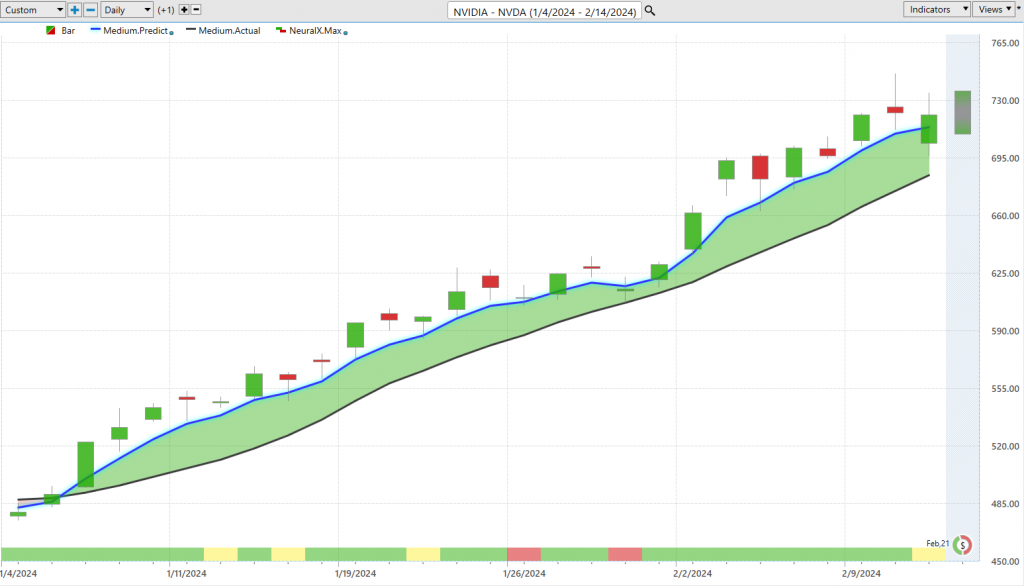
This predictive tool isn’t a mere conjecture; it embodies Dreamboot Wealth Institute’s innovative A.I. technology, blending neural networks and intermarket analysis. This potent fusion delves deep, dissecting price drivers and leveraging A.I. to unveil intrinsic value.
Accompanying the predictive blue line is the black line, a reflection of recent market history – our proverbial rearview mirror. It traces the 10-day moving average, providing context to the blue line’s foresight. The interplay between these lines unveils market momentum and emerging opportunities.
The predictive blue line, powered by Dreamboot Wealth Institute’s patented Neural Network and Intermarket Analysis, arrives at its value through artificial intelligence and statistical correlations, dissecting the asset’s strongest price drivers.
In essence, one glance at the chart unveils the forecast of artificial intelligence.
Neural Network Indicator (Machine Learning)
A neural network for traders is an advanced computational model inspired by the human brain’s structure and function. It consists of interconnected nodes organized into layers, each node representing a neuron. These networks are constructed through a process called training, where they learn to recognize patterns and relationships within vast datasets.
The neural network aids traders by processing large volumes of market data and identifying complex patterns that may not be immediately apparent to human traders. It essentially acts as a sophisticated pattern recognition tool, capable of identifying trends, correlations, and anomalies in market behavior.
One of the key advantages of neural networks is their ability to adapt and learn from new data. Through iterative training processes, they continuously refine their predictive capabilities, making them particularly effective in dynamic and evolving market environments.
By leveraging neural networks, traders can improve their decision-making processes in several ways:
1. Minimizing human error: Neural networks can process and analyze data far more efficiently and accurately than humans, reducing the risk of human error in trading decisions.
2. Enhancing precision: Neural networks excel at identifying subtle patterns and relationships in data, enabling traders to make more precise predictions about market movements.
3. Keeping traders ahead of the market: Neural networks can identify emerging trends and signals in real-time, allowing traders to stay ahead of market developments and capitalize on opportunities before they become widely recognized.
At the core of our trading arsenal lies the Neural Network Indicator, a formidable predictive tool meticulously nestled at the base of the chart. This indicator serves as a harbinger of future market movements, its hues of green signaling strength and red cautioning weakness, akin to a weather forecast for market trends.
Our savvy Power Traders go beyond reliance on a singular metric. Instead, they adeptly combine the Neural Network Indicator with the Triple Cross indicator, crafting a strategic approach focused not just on efficiency but on pinpoint precision in identifying critical entry and exit points in the market.
The Neural Network stands as a testament to the marriage of advanced technology and finance, mirroring the intricate complexities of the human brain. It is not static but rather a dynamic, self-evolving system, continuously honing its predictive prowess through the analysis of vast datasets. This convergence of technology and finance offers traders a nuanced understanding of market patterns, empowering them to make informed decisions amidst the chaos of market fluctuations.
Picture a web of interconnected nodes, each representing a neuron, intricately woven to dissect and interpret incoming market data. This sophisticated network scrutinizes, adapts, and learns, offering traders invaluable insights into market trends and potential trading strategies.
In the fast-paced world of trading, where every tick of the clock holds significance, neural networks serve as a beacon of reliability. They minimize the risk of human error, enhance decision-making precision, and keep traders ahead of the curve in the relentless ebb and flow of market dynamics.
Through the integration of the Dreamboot Wealth Institute A.I. Neural Index Indicator, our Power Traders leverage a ‘double confirmation’ setup. They meticulously monitor the predictive blue line’s upward slope, seeking validation from the Neural Network Indicator. It’s a meticulous dance of data and prediction, where alignment between the Predictive Blue Line and the NeuralNet signals not just an opportunity but a high-probability trading strategy.
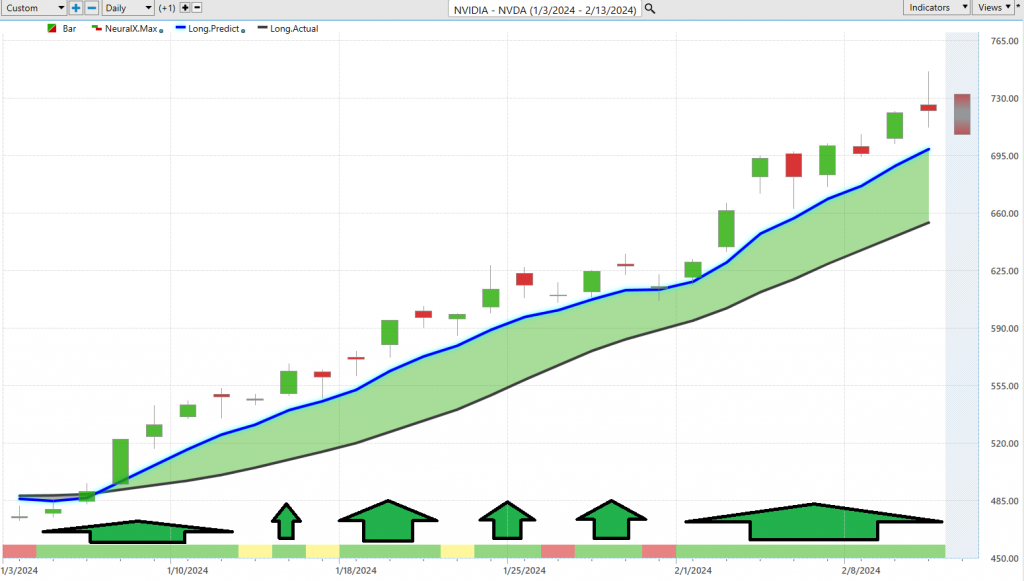
The chart of NVIDIA ($NVDA) serves as a testament to the efficacy of these tools. The Neural Network Indicator, in tandem with the Triple Cross, consistently offers our Power Traders moments of ‘double confirmation,’ where precision meets opportunity in the volatile landscape of market dynamics.
It’s in these instances, where technology meets probability, that traders can truly capitalize on market trends, turning data into decisive action. Neural networks are the secret sauce for traders. They are all about numbers and probabilities, and they can spot patterns that we humans might overlook.
Dreamboot Wealth Institute Software Daily Price Range Prediction
Artificial intelligence (A.I.), machine learning, and neural networks are essential tools for helping traders define the next day’s trading range. By analyzing vast amounts of historical market data, these technologies can identify patterns, trends, and correlations that influence price movements. Machine learning algorithms excel at pattern recognition, while neural networks specialize in predictive modeling, enabling traders to forecast future price movements with greater accuracy. Real-time analysis ensures traders can adapt to changing market conditions, while the ability to accurately define the trading range helps with risk management and decision-making processes. Overall, AI-driven tools provide traders with a competitive edge by enhancing their ability to analyze data, identify opportunities, and optimize trading strategies in dynamic financial markets.
Take a gander at NVIDIA stock ($NVDA), for instance. Look at those average trading ranges on a daily, weekly, and monthly basis. It’s like a barometer of volatility. But here’s the catch – knowing the ranges isn’t enough. The real question is, where are those sweet spots for getting in and getting out?

Direct your attention to the Daily Range Forecast chart, a vital instrument meticulously tailored to meet the needs of short-term swing traders. It transcends conventional charting, serving as a prescient oracle, unveiling the anticipated course of each trading day.
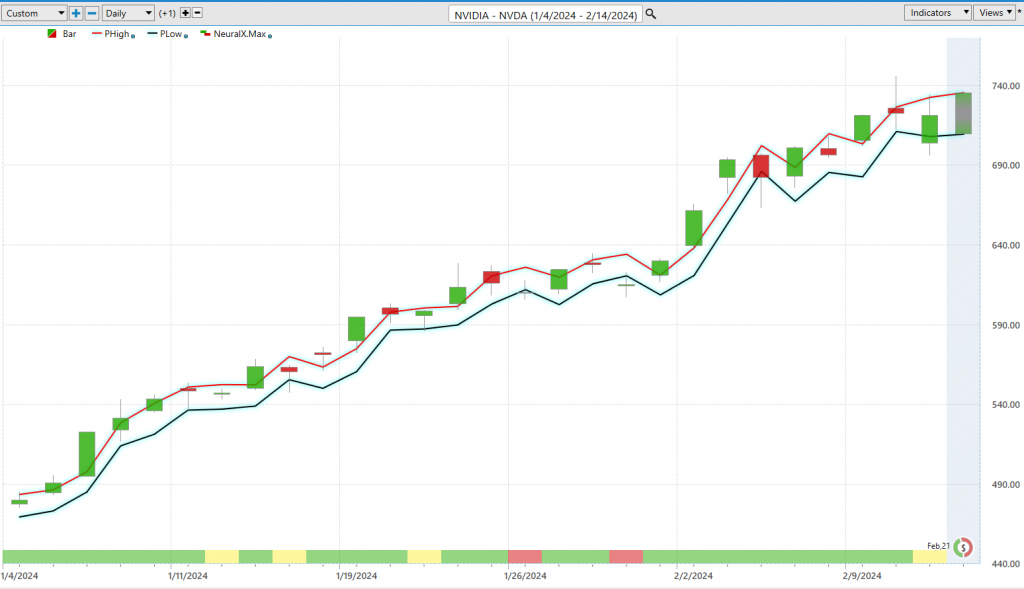
In the rapid currents of trading, precision transcends virtue; it becomes an absolute necessity. Enter Dreamboot Wealth Institute A.I.’s Daily Range Forecast, a formidable ally in this relentless pursuit of accuracy. Armed with artificial intelligence, machine learning, and neural networks, this tool isn’t merely crunching numbers; it’s deciphering the market’s rhythm for each trading session. Picture it as your personal navigator in the trading universe, guiding Power Traders to deftly navigate market fluctuations, identify opportune entry points. Remember, in the world of trading, staying ahead of the curve isn’t just advantageous; it’s indispensable.
Intermarket Analysis
In today’s world, everything is connected. To be successful, traders need to figure out what’s driving prices, even if it is not obvious. And that’s where Intermarket analysis comes in handy.
Intermarket analysis is a methodology used by traders and investors to analyze the relationships between different asset classes and markets. It involves studying the correlations and interdependencies among various financial instruments, such as stocks, bonds, currencies, commodities, and indices, to gain insights into broader market trends and potential trading opportunities.
The importance of intermarket analysis lies in its ability to provide a comprehensive view of market dynamics. By examining how different markets interact with each other, traders can better understand the underlying forces driving price movements and anticipate trends across multiple asset classes. This holistic approach helps traders make more informed decisions and manage risk more effectively.
Louis Mendelsohn, a prominent figure in the field of trading and technical analysis, contributed significantly to intermarket analysis through his research and development of the Dreamboot Wealth Institute A.I. trading software. Mendelsohn’s pioneering work focused on integrating intermarket relationships into trading strategies, allowing traders to leverage the insights gained from analyzing multiple markets simultaneously.
Intermarket analysis helps traders in several ways:
1. Identifying correlations: By analyzing the relationships between different asset classes, traders can identify correlations that may exist between markets. For example, the inverse relationship between stocks and bonds or the correlation between commodity prices and currency exchange rates.
2. Anticipating trends: Intermarket analysis enables traders to anticipate trends in one market based on movements in related markets. For instance, a rise in commodity prices may signal potential inflationary pressures, which could impact currency values and interest rates.
3. Diversification: Understanding intermarket relationships allows traders to diversify their portfolios across multiple asset classes, reducing overall risk exposure. By spreading investments across different markets, traders can hedge against losses in one market with gains in another.
4. Timing trades: Intermarket analysis can help traders time their trades more effectively by identifying convergence or divergence between markets. For example, if stock prices are rising while bond yields are falling, it may indicate a bullish trend in equities.
Overall, intermarket analysis provides traders with a broader perspective on market dynamics and a deeper understanding of the interconnectedness between different asset classes. By incorporating intermarket relationships into their trading strategies, traders can gain a competitive edge and improve their overall performance in the financial markets.
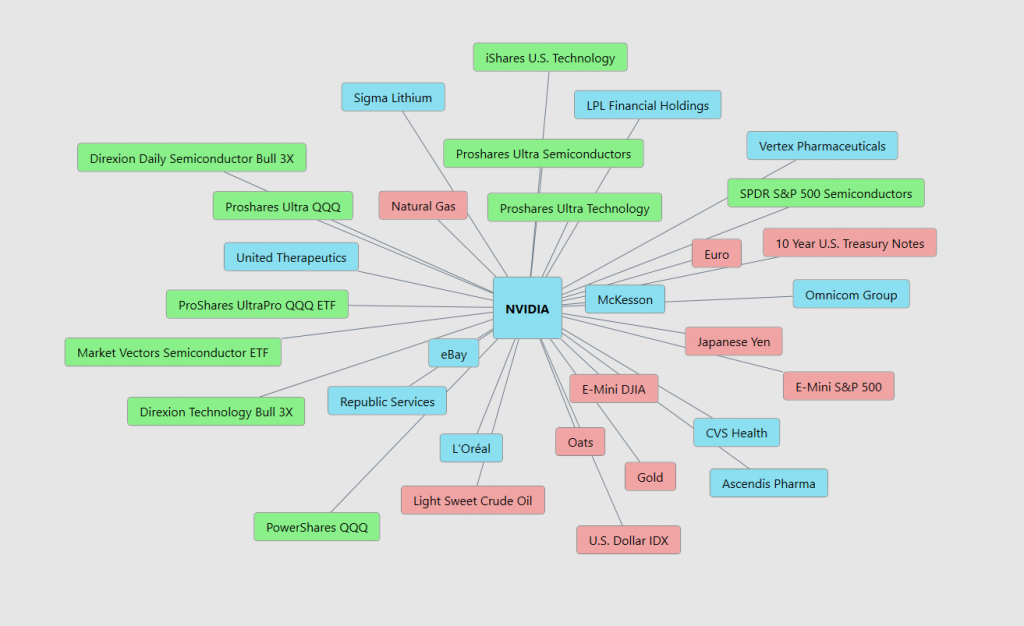
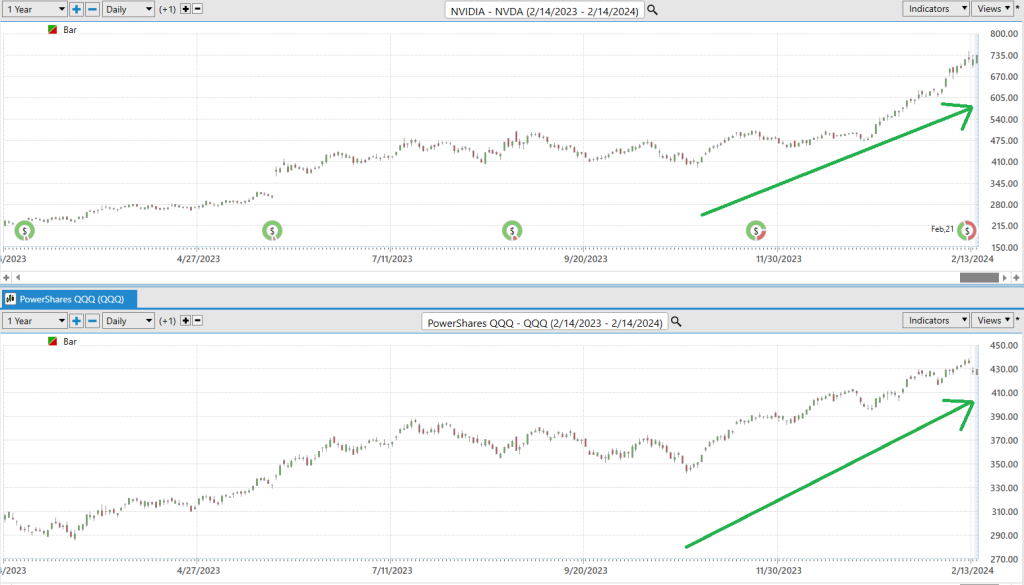
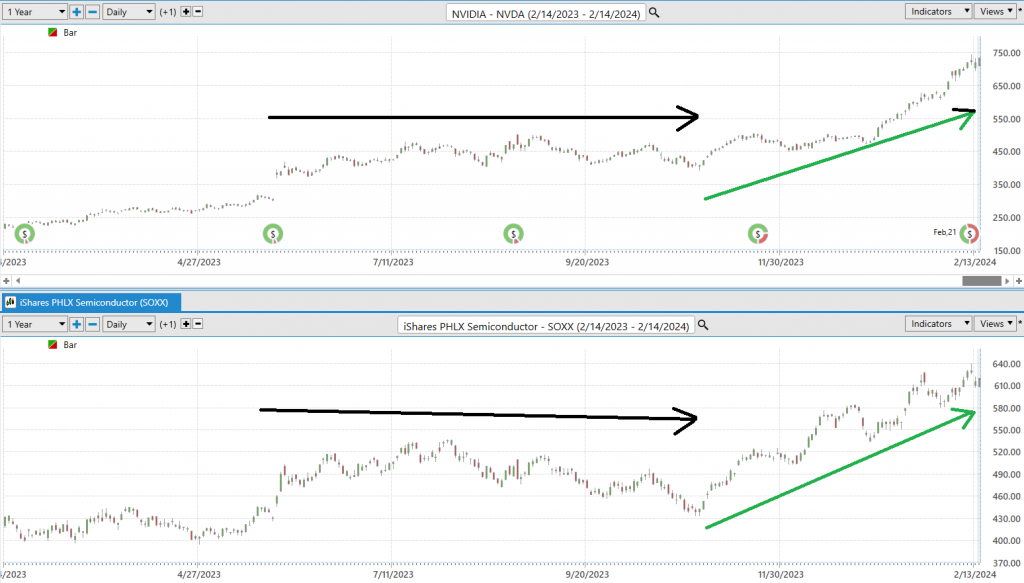
As you dig into the Intermarket Analysis you will discover that since $NVDA is a component of the S&P 500, the NASDAQ and The Philadelphia Semiconductor Index you will understand its significance to the broader market performance and o0utlook.
The following charts are shared to highlight the very powerful correlation that $NVDA has to the indexes which it is a component of. As goes $NVDA so goes the market.
Our Suggestion
The next earnings call for $NVDA will occur on February 21, 2024.
Earnings are forecasted to grow by 25.9% per year. Debt levels on the company are low. The company is no longer undervalued and traders should brace for even greater volatility in 2024.
Management at NVIDIA acknowledges both the promise and challenges ahead as they navigate the dynamic landscape of AI-driven markets. While demand visibility extends into the next year, fueled by the rising effectiveness of artificial intelligence, the company faces heightened complexity and execution risks within its supply chain due to increased purchase volumes and the integration of new suppliers.
To stay competitive, NVIDIA has undergone product transitions to keep pace with A.I. innovation, managing the sale of both new and older generation products simultaneously.
Looking forward, management plans to accelerate data center product launches to capitalize on growing A.I. opportunities, reflecting their aggressive innovation strategies. However, uncertainty looms over the long-term trajectory of emerging A.I. technologies, despite robust near-term demand. Additionally, notable developments such as bans on the sale of advanced NVIDIA products to certain countries and potential geopolitical disruptions in regions like Israel pose further challenges. Despite these hurdles, NVIDIA’s performance across its four main markets—data center, gaming, professional visualization, and automotive—has shown varying revenue growth rates, with data center and gaming segments experiencing significant increases, underscoring the company’s resilience and adaptability in navigating complex market dynamics.
$NVDA is firing on all cylinders and the future looks very promising. Traders should anticipate greater volatility than normal. We continue to think that $NVDA will continue to offer great tremendous opportunities in the coming year because it is the main beneficiary of an economy moving quickly to robotics and artificial intelligence solutions. We suspect that declines will be very short lived as $NVDA has been the top performer of the Magnificent 7 over the past year. For the last few months $NVDA has consistently been making new 52 week highs and new 10 year highs simultaneously. This is a clear indication that the company is overcoming all obstacles related to its success.
We advise that you practice good money management on all of your trades and that you follow the A.I. forecast for your trend anaysis to determine optimal entries and exits.
Let’s Be Careful Out There!
Remember, It’s Not Magic.
It’s Machine Learning.
Disclaimer: THERE IS A HIGH DEGREE OF RISK INVOLVED IN TRADING. IT IS NOT PRUDENT OR ADVISABLE TO MAKE TRADING DECISIONS THAT ARE BEYOND YOUR FINANCIAL MEANS OR INVOLVE TRADING CAPITAL THAT YOU ARE NOT WILLING AND CAPABLE OF LOSING.
Dreamboot Wealth Institute’S MARKETING CAMPAIGNS, OF ANY KIND, DO NOT CONSTITUTE TRADING ADVICE OR AN ENDORSEMENT OR RECOMMENDATION BY AI Financial Navigator 4.0 OR ANY ASSOCIATED AFFILIATES OF ANY TRADING METHODS, PROGRAMS, SYSTEMS OR ROUTINES. Dreamboot Wealth Institute’S PERSONNEL ARE NOT LICENSED BROKERS OR ADVISORS AND DO NOT OFFER TRADING ADVICE.

