Major Indices Technical Updates:
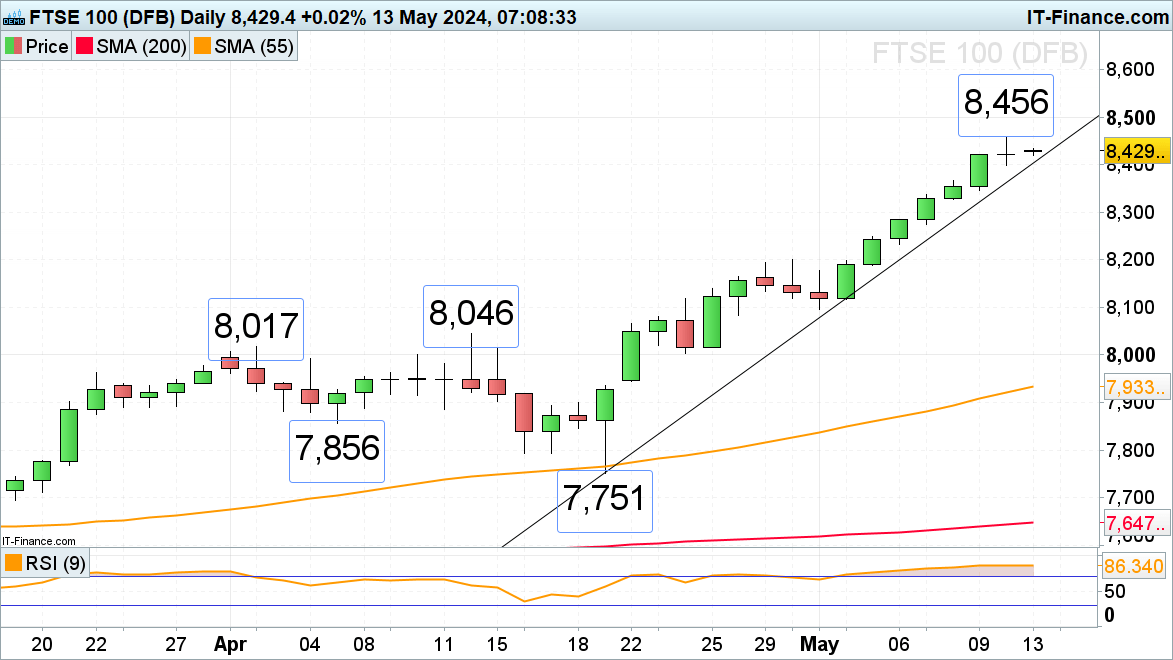
- FTSE 100 continues bullish run, spurred on by trendline support
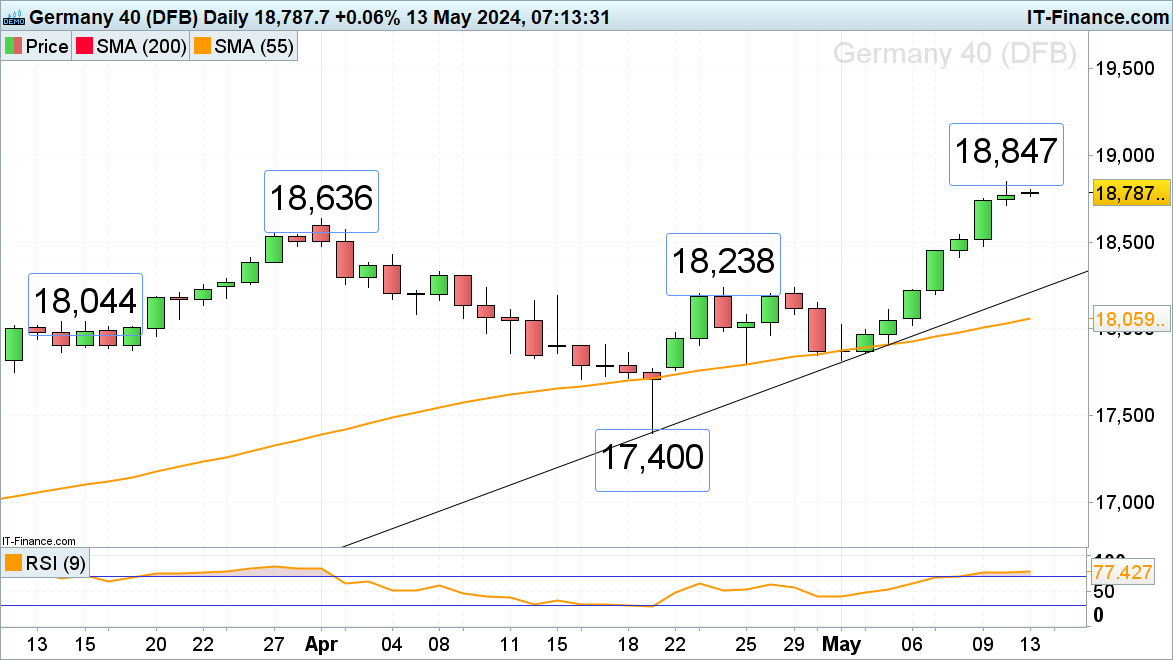
- DAX trades just shy of the all-time high
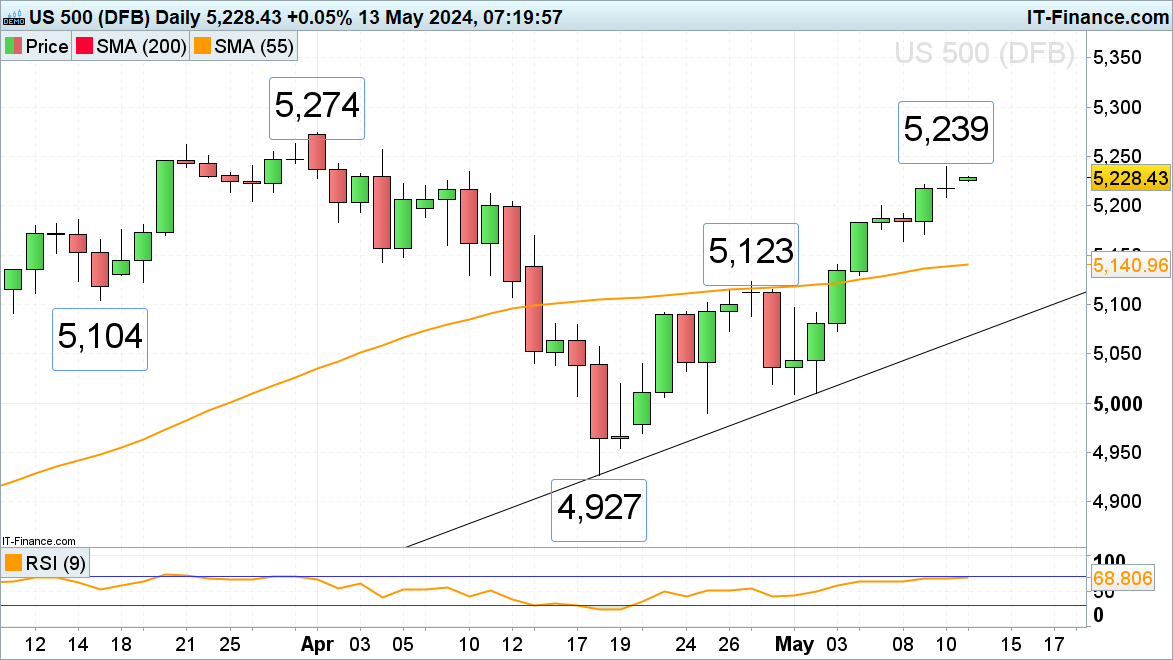
- S&P 500 within 1% of a retest of the all-time high
- Elevate your trading skills and gain a competitive edge. Get your hands on the Equities Q2 outlook today for exclusive insights into key market catalysts that should be on every trader's radar:
FTSE 100 Continues to Accumulate Record Highs
The FTSE 100 made a new record high each day over the past seven trading days as the UK exited its 2023 technical recession with the psychological 8,500 mark representing the next upside target. This will be the case while the April-to-May uptrend line at 8,404 underpins on a daily chart closing basis. This uptrend line is likely to be tested on Monday, though.
FTSE Daily Chart

DAX 40 Trades in Record Highs
The DAX 40 has so far risen on seven consecutive days and in doing so last week made a new record high whilst approaching the minor psychological 19,000 mark.
Minor support below Friday’s 18,712 low can be spotted at the previous record high, made in April at 18,636.
DAX Daily Chart

S&P 500 Trades Less Than 1% Away from its April Record High
The S&P 500’s 4% rally from its early May low has taken it marginally above its 10 April high at 5,234 on Friday, to 5,239 to be precise. Above it lies the April record high at 5,274. Potential slips may encounter support at the 5,200 mark, hit on Tuesday, and at Wednesday’s 5,164 low.
S&P 500 Daily Chart

Looking for actionable trading ideas? Download our top trading opportunities guide packed with insightful tips for the second quarter!

