FORECAST - GOLD, EUR/USD, NASDAQ 100
- The Fed held borrowing costs unchanged and continued to indicate it would deliver three rate cuts this year
- The dovish policy outlook weighed on the U.S. dollar and yields, boosting gold prices and the Nasdaq 100
- This article examines the technical outlook for XAU/ USD , EUR/USD and the NDX
Most Read: Fed Holds Rates Steady, 2024 Policy Outlook Unchanged – What Now?
U.S. stocks and gold prices rallied while the U.S. dollar skidded lower on Wednesday after the Federal Reserve stuck to the script and largely maintained the same policy outlook embraced three months ago in the previous Summary of Economic Projections, shrugging off firming price pressures in the economy.
For context, the FOMC kept borrowing costs at their current levels at its March gathering, reaffirming its intention to implement 75 basis points of easing in 2024 . Wall Street , fearing a hawkish outcome in the face of growing inflation risks, breathed a sigh of relief at the institution’s restrained response.
While there were some hawkish elements in the Fed’s guidance, such as the upward revision to the long-run equilibrium rate, traders chose to focus on the near-term future and the fact that the easing cycle is inching closer and looming on the horizon.
With all that said, the main takeaway from the FOMC meeting was this: nothing has really changed for the central bank; plans to cut rates this year remain on track and the process to slow the pace of quantitative tightening is rapidly approaching, with Powell saying tapering could start “fairly soon”.
Taking into account today’s developments, bond yields will struggle to move much higher in the near term, especially if incoming economic data starts cooperating with policymakers. This could prevent the U.S. dollar from extending its rebound in the coming days and weeks.
Meanwhile, risk assets and precious metals such as gold and silver could be better positioned to maintain upward momentum heading into the second quarter. This could potentially mean fresh all-time highs for both gold and the Nasdaq 100.
Eager to gain insights into gold's future path? Discover the answers in our complimentary quarterly trading guide. Request a copy now!
GOLD PRICE FORECAST - TECHNICAL ANALYSIS
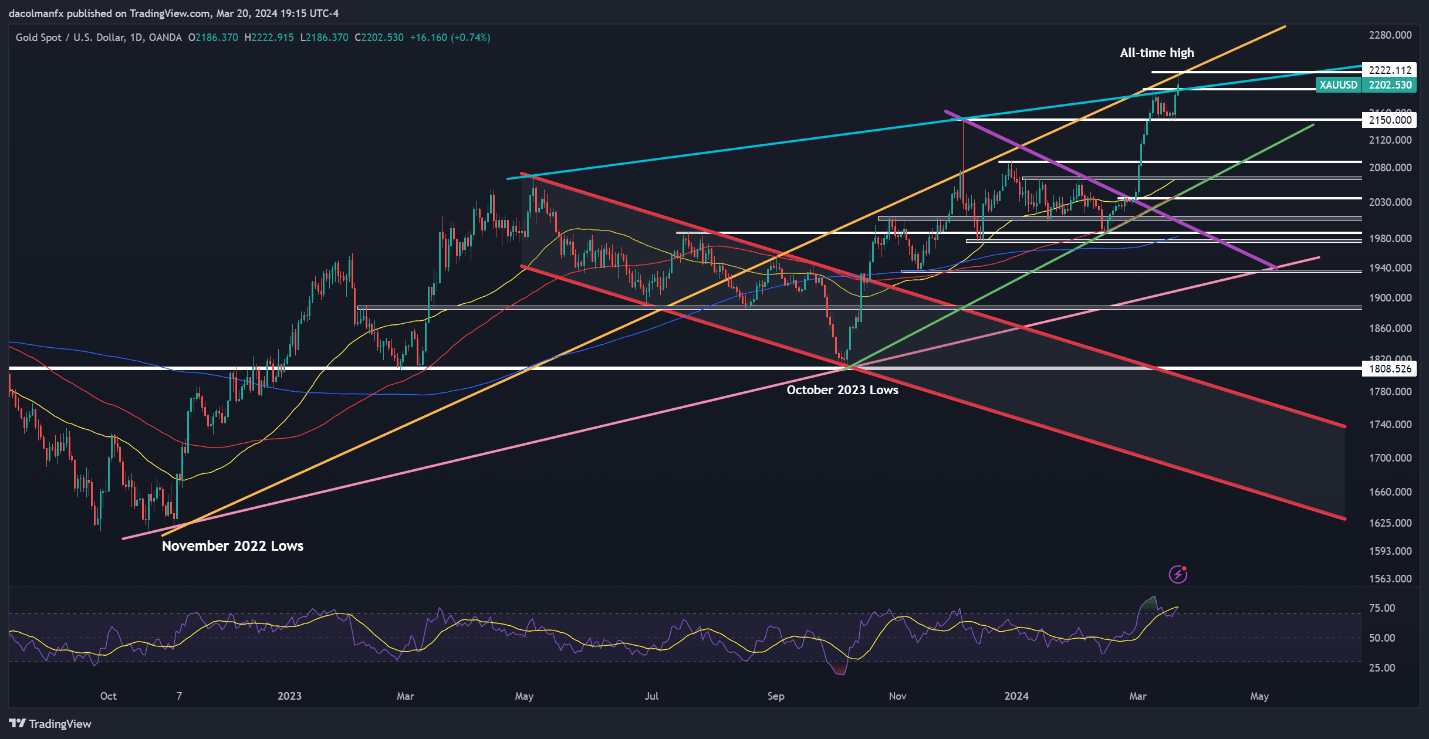
Gold surged on Wednesday, breaking past its previous record and notching a new all-time high above $2,220. With bulls seemingly in control of the market, a potential move towards trendline resistance at $2,225 is conceivable. On further strength, a rally above $2,250 cannot be ruled out.
Conversely, if sellers stage a comeback and pullback, support looms at $2,195, the swing high from early March. Below this level, attention will turn to $2,150, followed by $2,090. Bulls must vigorously defend this technical floor; failure to do so will expose the 50-day simple moving average at $2,065.
GOLD PRICE TECHNICAL CHART

Gold Price Chart Created Using TradingView
If you're looking for an in-depth analysis of U.S. equity indices, our first-quarter stock market trading forecast is packed with great fundamental and technical insights. Get it now!
NASDAQ 100 FORECAST - TECHNICAL ANALYSIS
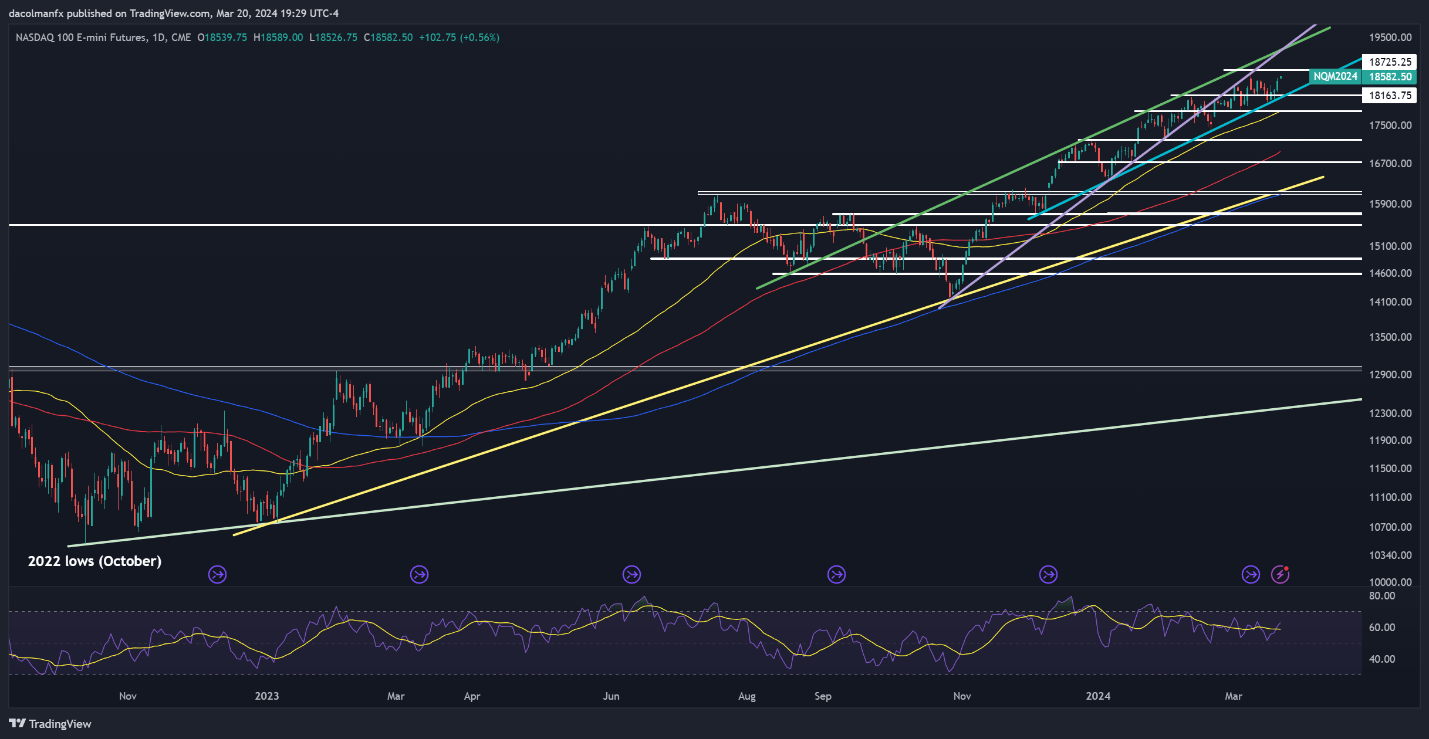
The Nasdaq 100 climbed sharply on Wednesday in response to the Fed’s dovish outlook, coming within striking distance from retesting its all-time high near 18,690. Traders should closely monitor this technical ceiling as a breakout could pave the way for a rally toward trendline resistance at 19,175.
On the flip side, if market sentiment shifts back in favor of sellers and prices begin to correct lower, initial support will emerge at 18,150. Below this threshold, the spotlight will be on 17,805, a key level that currently coincides with the 50-day simple moving average.
NASDAQ 100 CHART – TECHNICAL ANALYSIS

Nasdaq 100 Chart Created Using TradingView
For a complete overview of the EUR /USD’s technical and fundamental outlook, make sure to download our complimentary quarterly forecast!
| Change in | Longs | Shorts | OI |
| Daily | 2% | -12% | -3% |
| Weekly | -2% | 11% | 2% |
EUR/USD FORECAST - TECHNICAL ANALYSIS
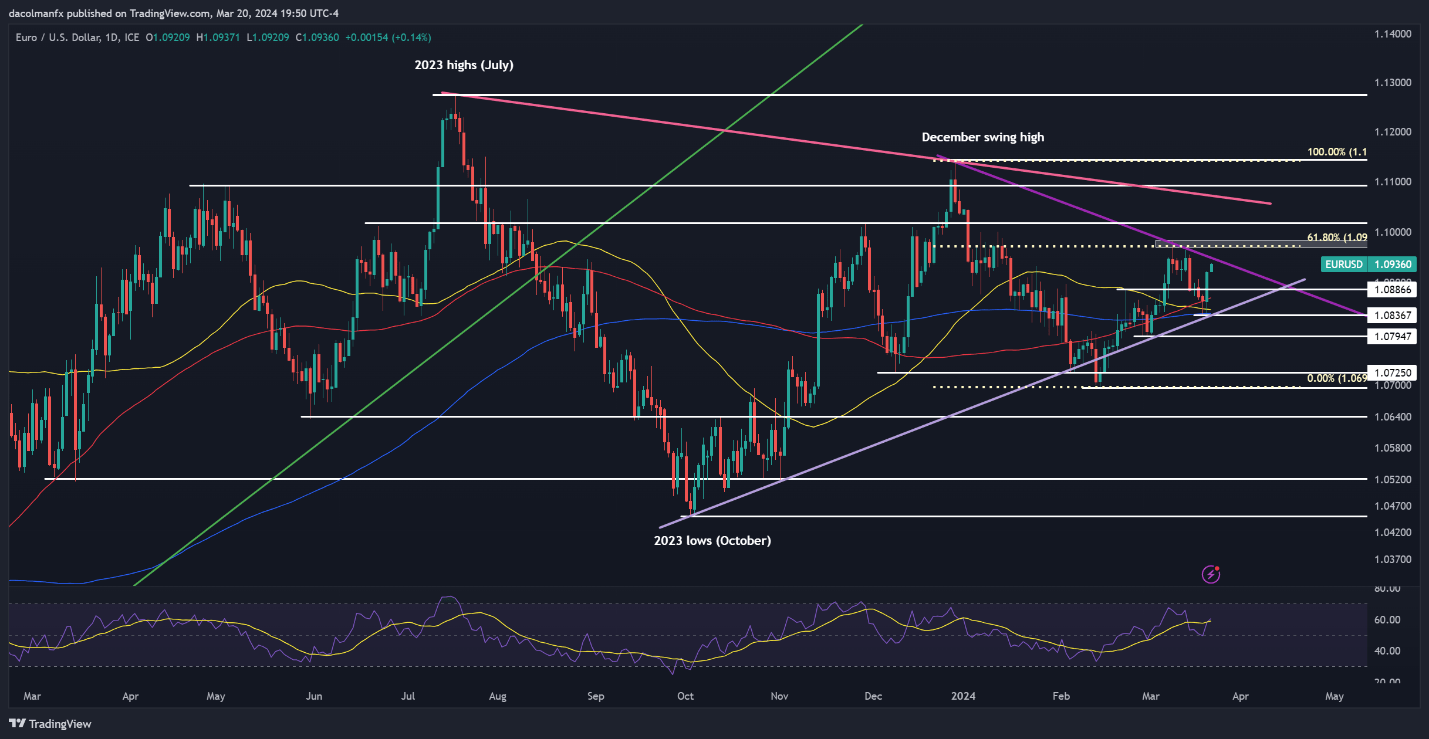
EUR/USD jumped on Wednesday, with bulls seemingly determined to challenge trendline resistance at 1.0950 after the FOMC announcement. In the event of a retest, sellers will need to fend off the advance; otherwise, there will be minimal obstacles to a rally towards 1.0970, a key Fibonacci level.
Alternatively, if upside pressure begins to fade and sellers spark a bearish reversal, support can be identified at 1.0890, followed by 1.0850, where an ascending trendline converges with the 50-day and 100-day moving averages.
EUR/USD PRICE ACTION CHART


