US Dollar Price, Analysis, and Charts
- Major central bank policy decisions next week.
- US dollar index nears a cluster of resistance points.
- British Pound edging lower ahead of UK inflation report.
The latest US PPI report showed that wholesale inflation remains sticky, denting the recent disinflation story. US y/y inflation rose 1.6% in February, above market expectations of 0.9% and a prior month’s revised 1.0%. According to the US Bureau of Labor Statistics,
'On an unadjusted basis, the final demand index advanced 1.6 percent for the 12 months ended in February, the largest rise since moving up 1.8 percent for the 12 months ended September 2023. In February, nearly two-thirds of the rise in final demand prices can be traced to the index for final demand goods, which advanced 1.2 percent. Prices for final demand services moved up 0.3 percent. The index for final demand less foods, energy, and trade services increased 0.4 percent in February after rising 0.6 percent in January. For the 12 months ended in February, prices for final demand less foods, energy, and trade services moved up 2.8 percent.’
These numbers will have been noted by the Fed ahead of next Wednesday’s FOMC policy meeting and rate decision. The Fed is fully expected to keep rates unchanged next week but any nod to higher inflation by Fed Chair Jerome Powell will keep traders attention. After yesterday’s data, the probabilities for a June rate fell further with the market now seeing a rough 60% chance of a 35bp rate at the end of H1.
For all economic data releases and events see the Economic Calendar
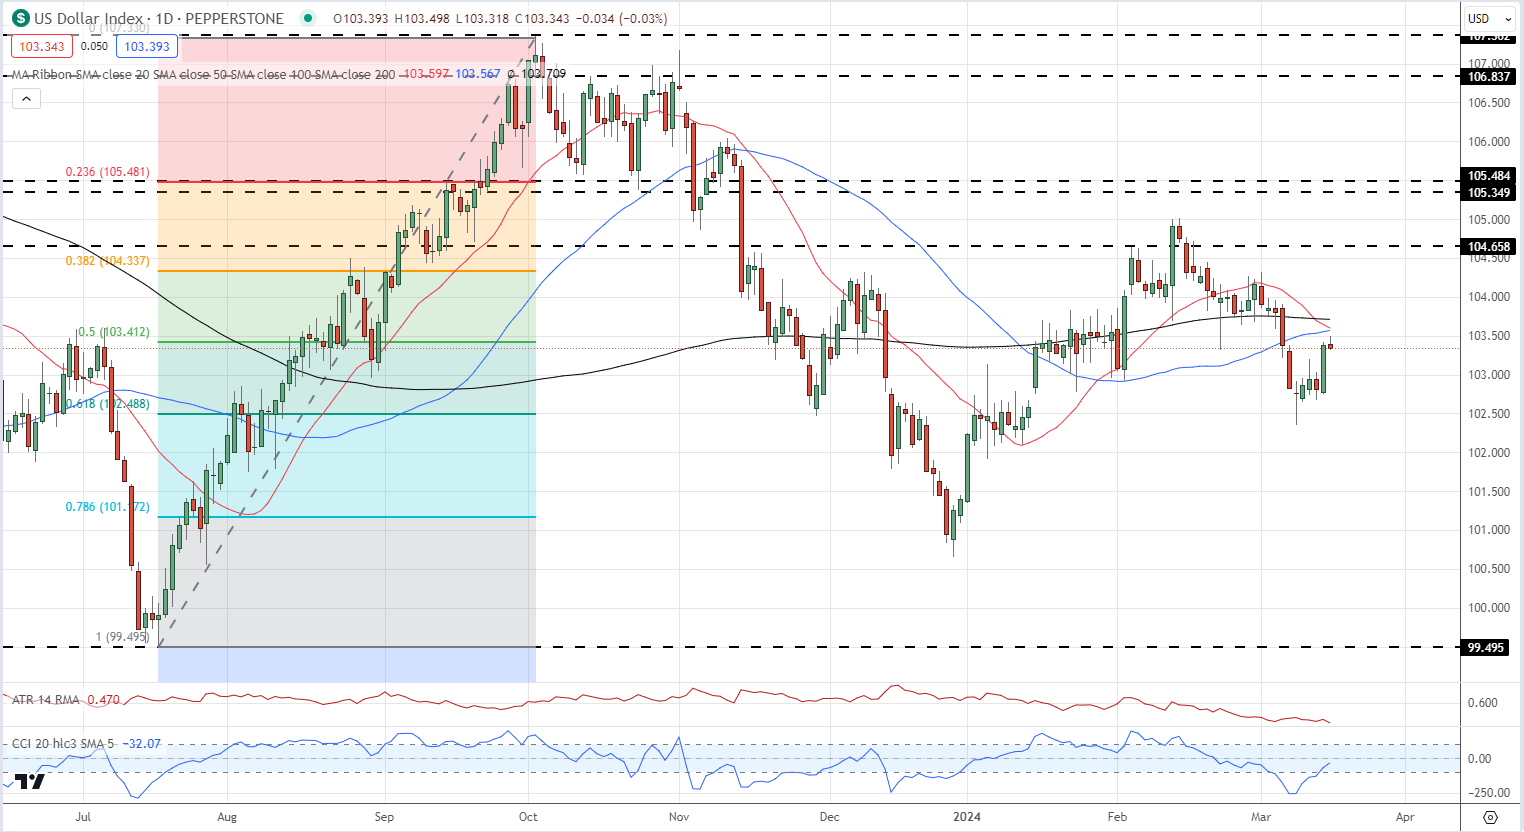
The US dollar index rallied after Thursday’s data, paring recent losses. The index now nears a zone of resistance made up of the 50% Fibonacci retracement at 103.41 and all three simple moving averages that currently sit between 103.57 and 103.71. This zone of resistance should hold ahead of the FOMC decision.
US Dollar Index Daily Price Chart

The Bank of England (BoE) will also announce its latest policy decision next week and the UK central bank is fully expected to leave all policy settings untouched. The main point of interest at the meeting will be the interest rate vote split. At the last meeting, six out of the nine members voted for rates to be left unchanged, two members voted for a hike, and one member voted for a rate cut. If this split is changed, markets will likely re-price Sterling in the short term.
For all major central bank meeting dates, see the Central Bank Calendar
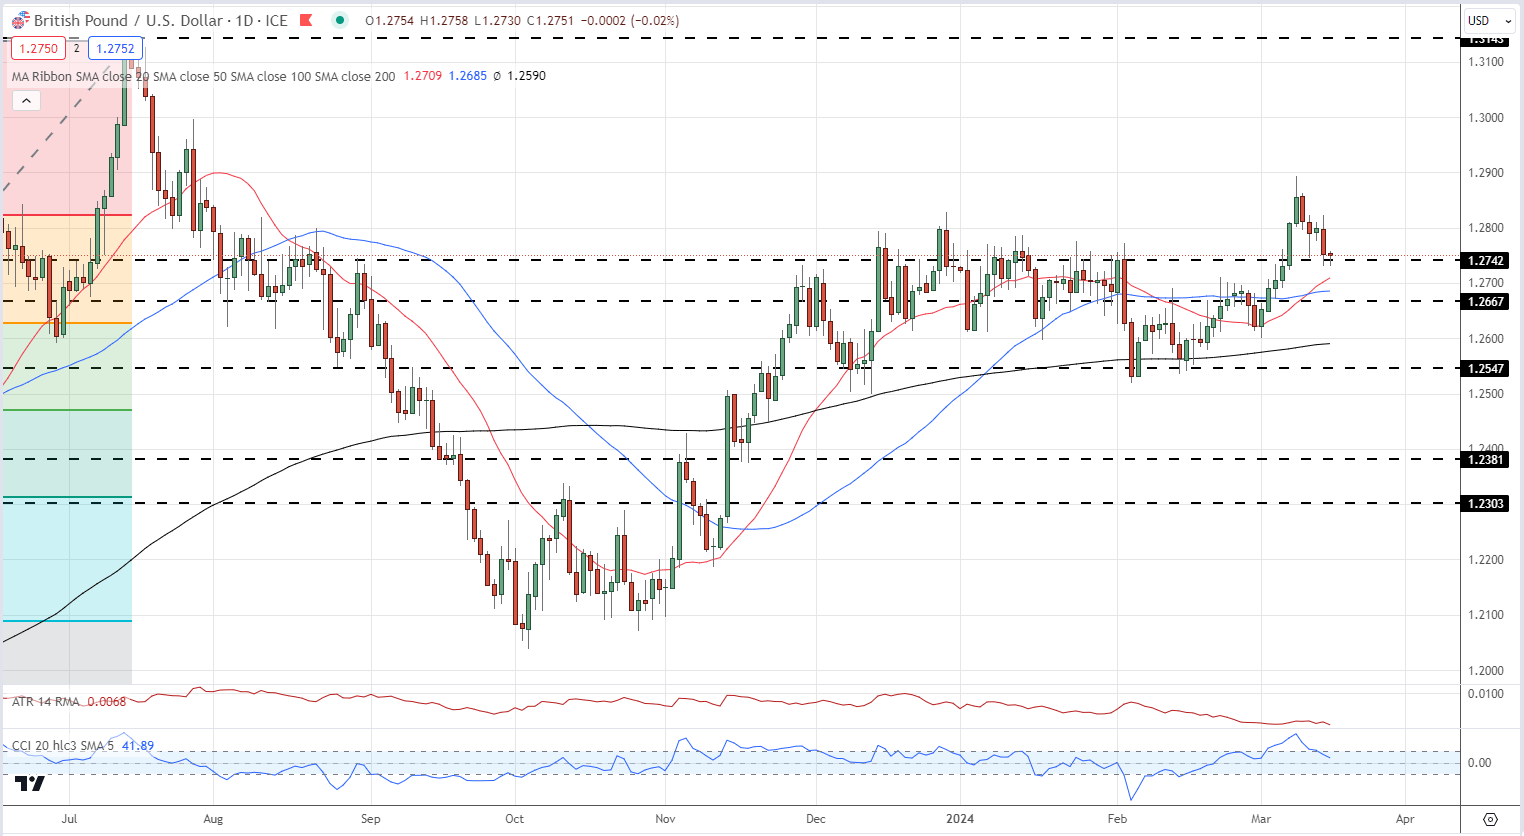
GBP/USD is currently trading on either side of 1.2742, a prior level of resistance. A block of prior daily candles and the 20- and 50-day simple moving averages guard the next level of support at 1.2667. This is likely to hold until next week’s central bank meetings. If not, 1.2600 and 1.2547 come into focus.
GBP/USD Daily Price Chart

All Charts via TradingView

