US Dollar Analysis and Charts
- US inflation nudges higher in February.
- US rate cut expectations remain the same with June the probable start date.
The latest US inflation report showed headline price pressures building in February while core inflation nudged lower. Both y/y readings came in 0.1% above market forecasts.

For all economic data releases and events see the Economic Calendar
According to the Bureau of Labor Statistics,
‘The index for shelter rose in February, as did the index for gasoline. Combined, these two indexes contributed over sixty percent of the monthly increase in the index for all items. The energy index rose 2.3 percent over the month, as all of its component indexes increased. The food index was unchanged in February, as was the food at home index. The food away from home index rose 0.1 percent over the month.’
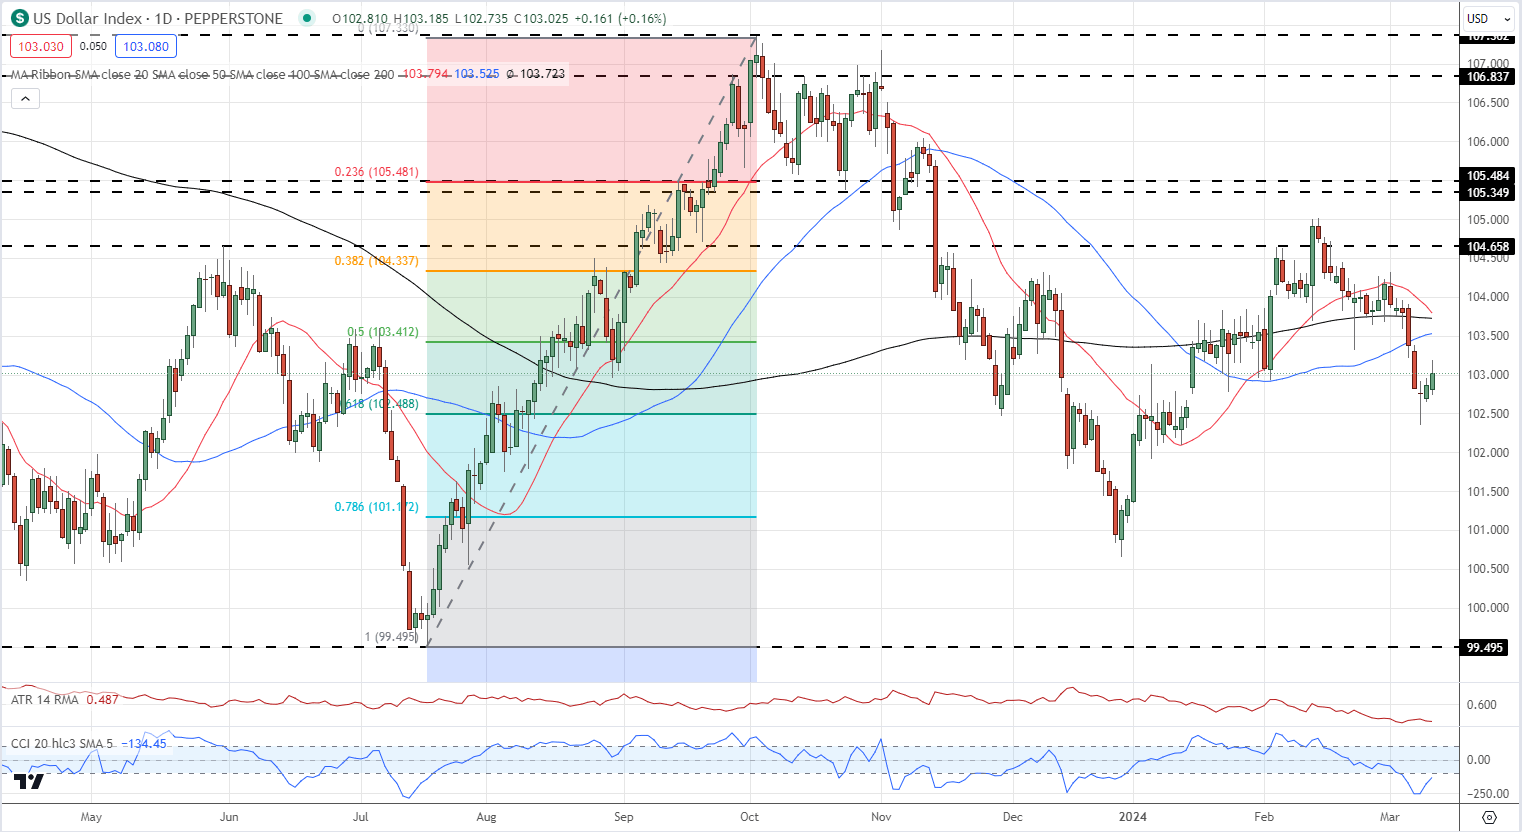
The US dollar picked up a small bid after the results with the US dollar index back above 103.00. Market probabilities for future US rate cuts however remained unchanged with the probability of a June rate cut still over 80%.
US Dollar Index Daily Chart

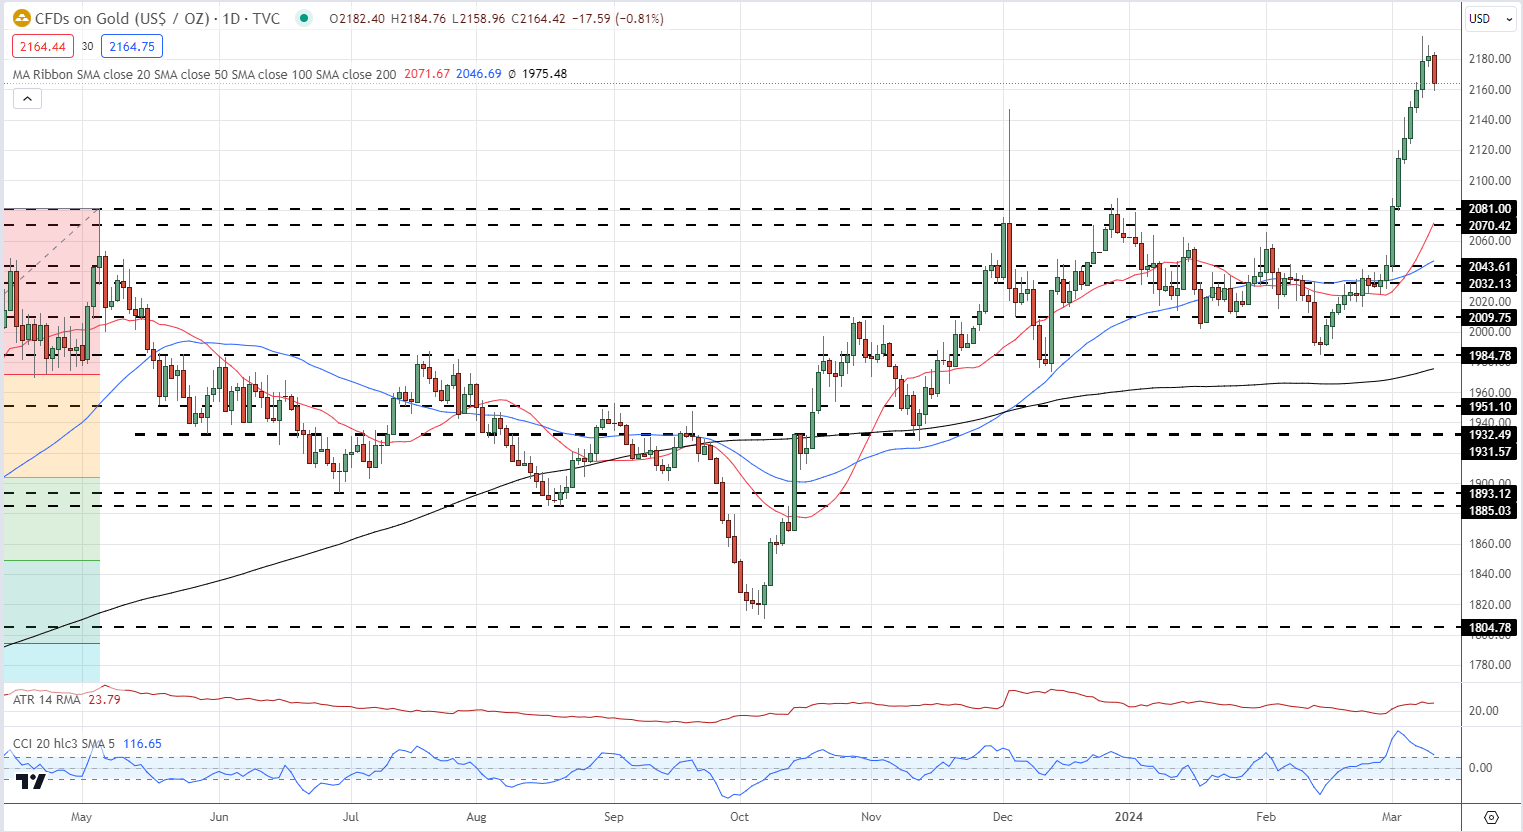
Gold is giving back some of its recent strong rally, but again the move is limited. The first level of support is seen on either side of the $2,050/oz. area before $2,120/oz. comes into focus.
Gold Daily Price Chart

Charts via TradingView

