US Dollar Latest – EUR/USD, GBP/USD, USD/JPY
- US data releases will direct the dollar’s short-term future.
- EUR/USD looking for a sub-1.0800 break
For all major central bank meeting dates, see the Central Bank Calendar
A potentially tricky end to the week with a slew of Bank Holidays on Friday and Monday leaving some markets open and some closed. Tomorrow also sees the release of this week’s data point of note, US PCE . The core reading y/y is seen holding steady at 2.8%, while the closely watched PCE Price Index y/y is seen nudging 0.1% higher to 2.5%. Any deviation from these figures will likely cause a US dollar reaction, especially in holiday-thinned markets. Today sees the release of the final look at US Q4 GDP (12:30 UK) and Michigan Consumer Sentiment for March (14:00 UK).


For all economic data releases and events see the Economic Calendar
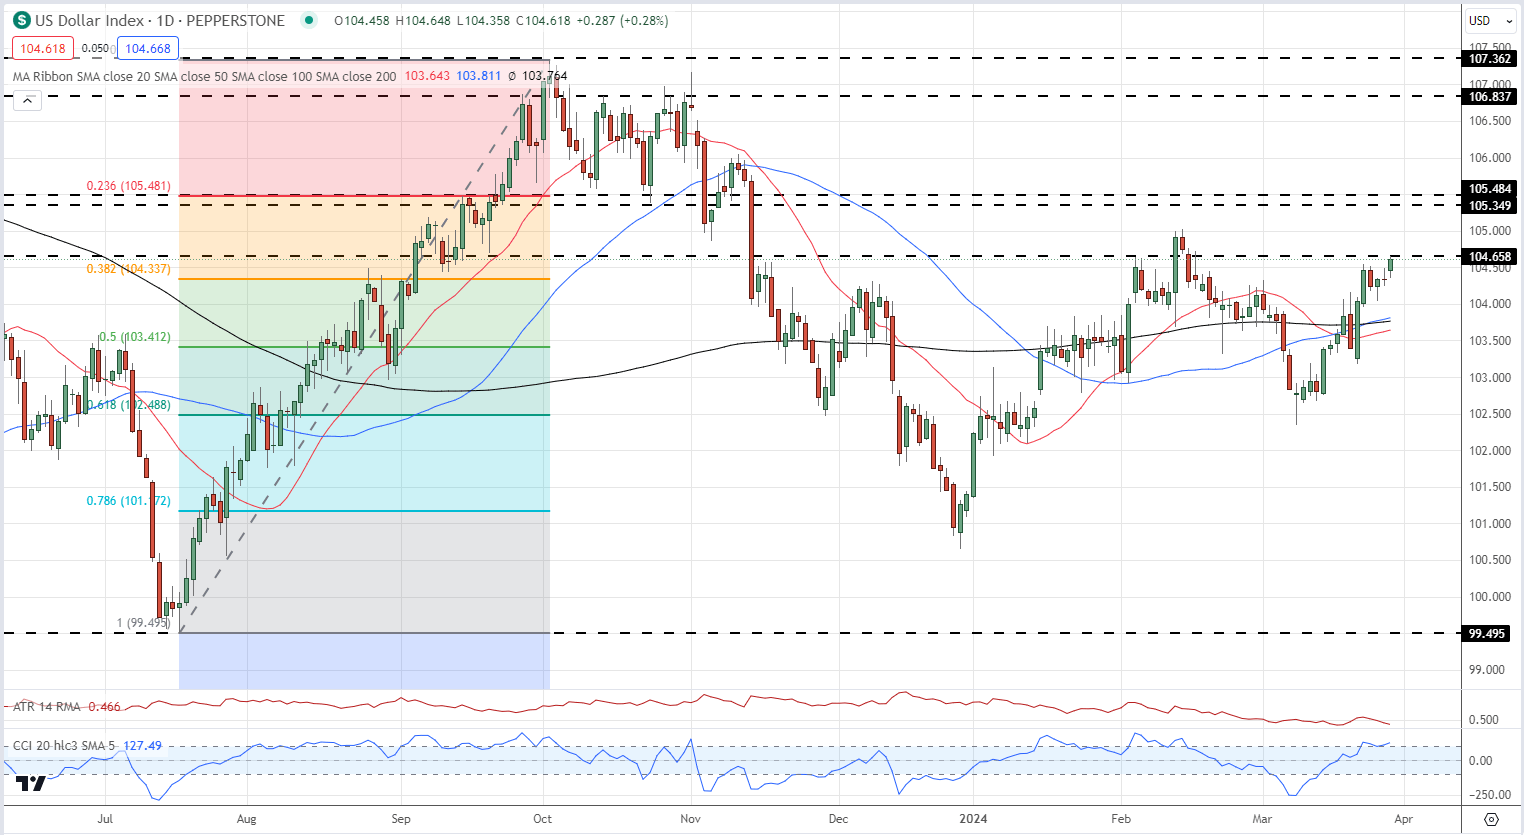
The US dollar is picking up a bid going into these data releases and the long weekend, helped by a softer Euro . The US dollar index is closing in on the mid-February swing high and a clear break above would leave the dollar back at highs last seen in November 2023.
US Dollar Index Daily Price Chart
Euro Latest – German GDP Seen at Just 0.1% in 2024, EUR/USD Under Pressure
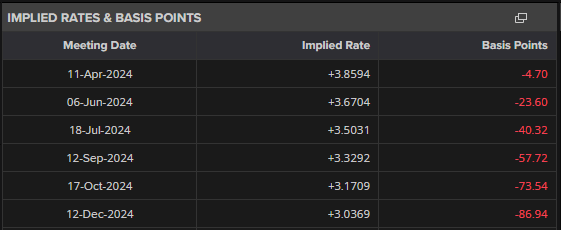
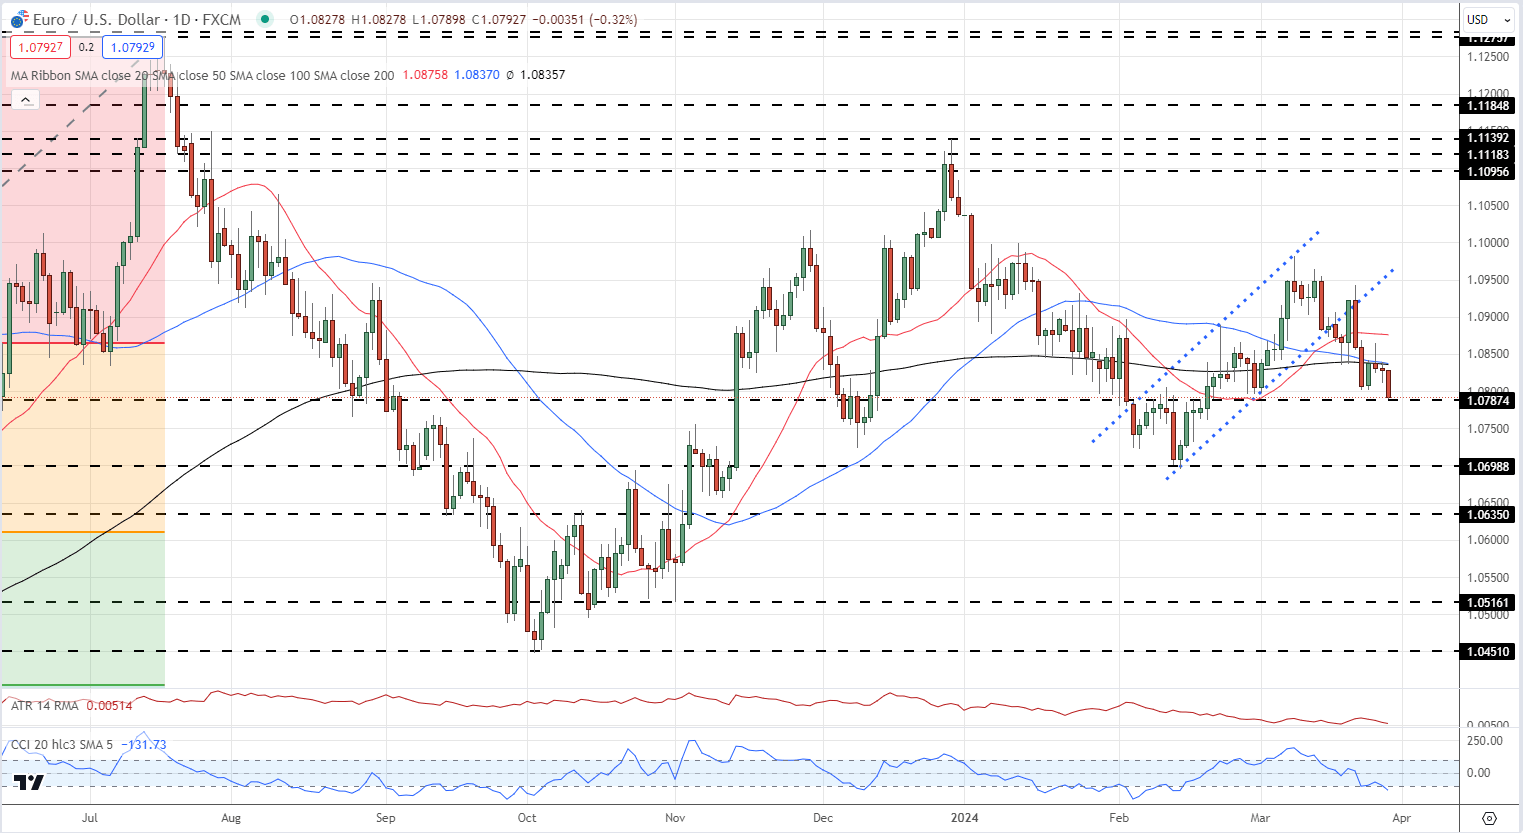
The Euro remains under pressure and is testing big figure support at 1.0800 against the US dollar. Recent market focus on the weakness of the German economy has triggered speculation that the European Central Bank may go for back-to-back rate cuts, starting at the June meeting, ahead of the August break. The latest market pricing shows an implied rate of 3.50% for the July meeting.
A break below 1.0787 would leave EUR/ USD vulnerable to a further sell-off with 1.0698 the next level of support. The pair have broken below all three simple moving averages and this leaves EUR/USD vulnerable to further losses.
EUR/USD Daily Price Chart
IG retail trader data shows 55.17% of traders are net-long with the ratio of traders long to short at 1.23 to 1.The number of traders net-long is 0.73% higher than yesterday and 43.72% higher than last week, while the number of traders net-short is 4.39% lower than yesterday and 21.98% lower than last week.
We typically take a contrarian view to crowd sentiment, and the fact traders are net-long suggests EUR/USD prices may continue to fall.
| Change in | Longs | Shorts | OI |
| Daily | 2% | -12% | -3% |
| Weekly | -2% | 11% | 2% |
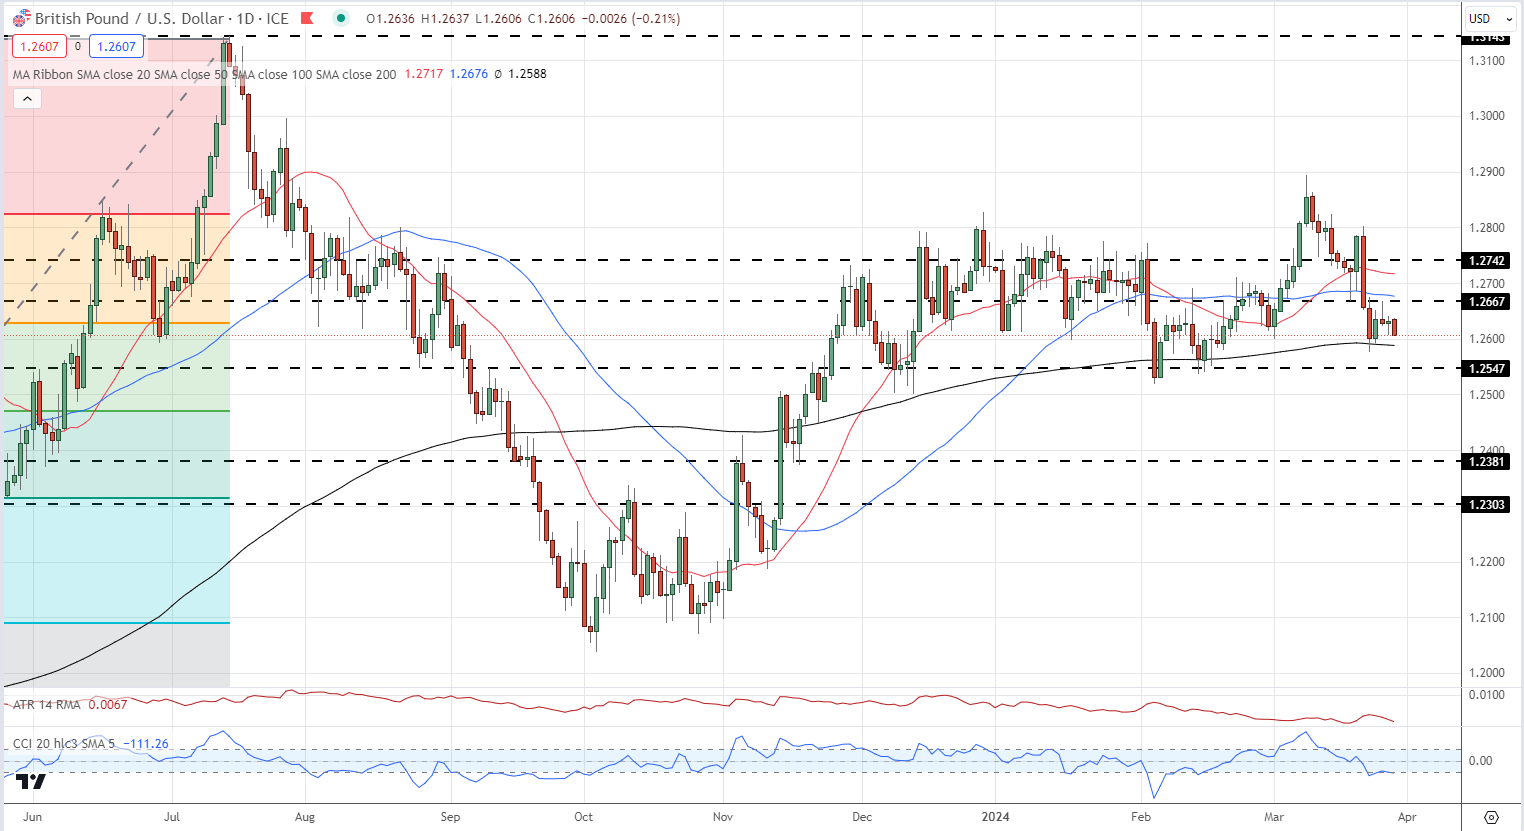
GBP/USD is just above1.2600 and is set to test the recently supportive 200-day simple moving average, currently at 1.2588. A break below would turn the chart further negative, with the 50% Fibonacci retracement at 1.2471 as the first line of support.
GBP/USD Daily Price Chart
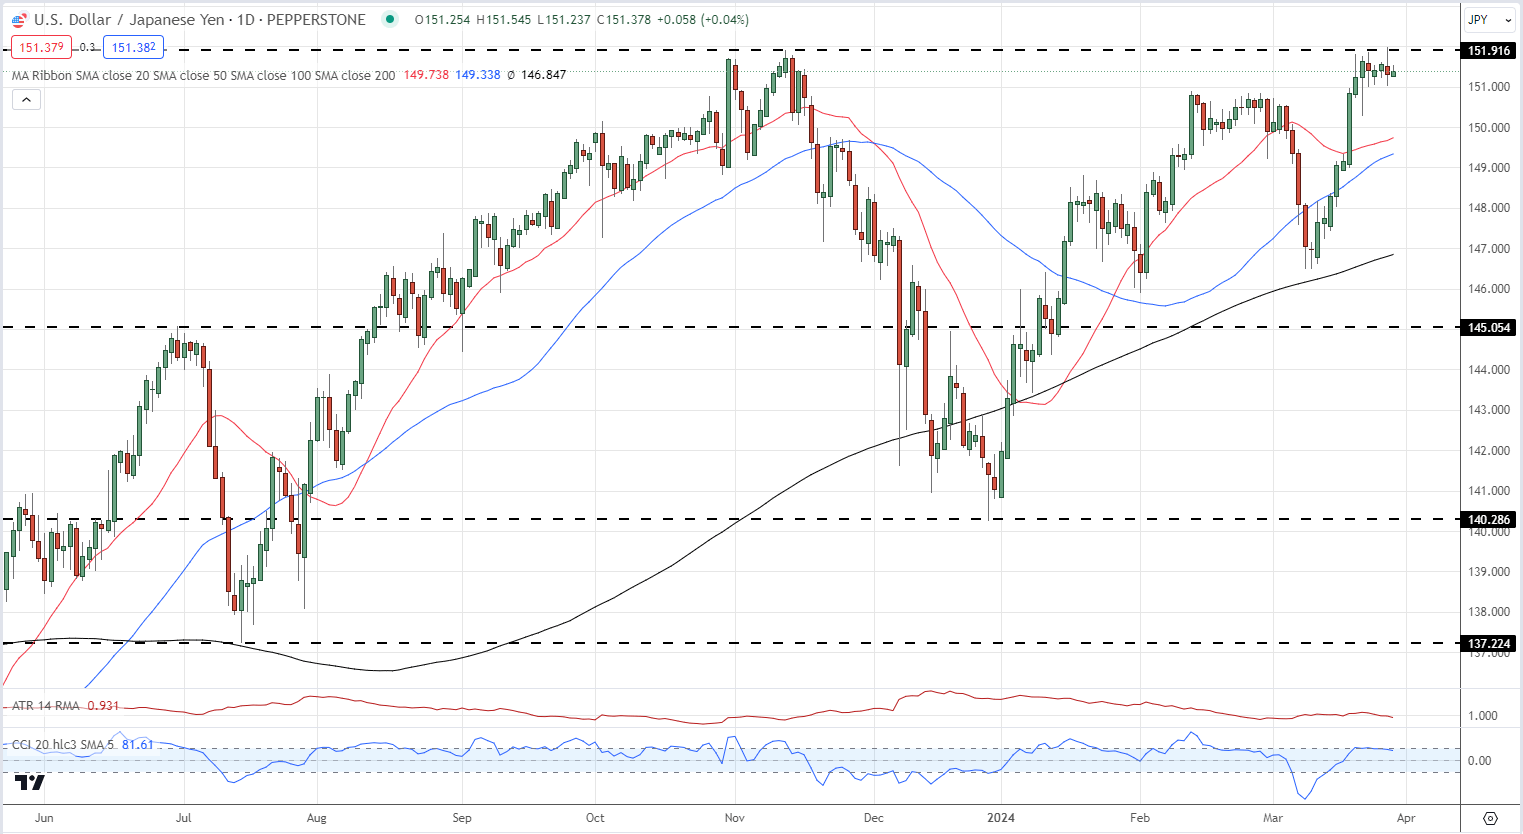
USD/JPY remains at levels that may provoke official intervention by the Japanese authorities. The BoJ recently moved interest rates out of negative territory as it began to unwind decades of ultra-loose monetary policy , but the Yen remains weak. Official talk yesterday produced a small sell-off in USD/JPY back to 151 but this is now being reversed. If Japanese officials ramp up the rhetoric, a long weekend with low liquidity could see USD/JPY move sharply.
FX Intervention Threat Steps up a Notch after USD/JPY Hits a Crucial Level
USD/JPY Daily Price Chart
All Charts via TradingView

