UK Inflation, GBP/USD Analysed
- GBP/USD remains just above 1.2700
- The UK’s April CPI numbers will dominate the ‘ GBP ’ side this week
- Gains have been impressive this month, have they gone too far?
- GBP/ USD is currently trending but market conditions change over time. Discover the main market conditions and how to approach them from a trader's perspective:
The British Pound held on near two-month highs against the United States Dollar on Tuesday ahead of important news on inflation in the former’s home country due in the next session.
Official Consumer Price Index data for April comes up for release from the United Kingdom on Wednesday, and, if market expectations are met, it’s sure to be a market mover for the Pound. The headline rate is tipped to relax to an annualized 2.1%, from the 3.2% seen in March. The ‘core’ rate has the volatile effects of food and fuel prices stripped out, and is expected to come in at 3.6%, from the previous month’s 4.2%.
Markets think UK rates could start to come down from their inflation-busting peaks quite soon, with a June move by no means off the table even if August is favorite. Expectation-matching numbers would probably keep that hope alive.
The Bank of England will next set rates on June 20, and will see May’s inflation figures only a day before.
Clearly any surprise price weakness on Wednesday could increase market certainty that June will be the month and might take some of the shine off Sterling.
The day will also bring the release of minutes from the Federal Reserve’s May 1 policy meet. However, there’ve been plentiful chances to hear from Fed rate-setters since, and there are many more coming up this week, so the minutes may have been overtaken by events as far as any use as a trading cue goes.
Sterling has gained on the Dollar steadily since April, thanks to some better news out of the UK economy and a general revival in risk appetite. Monetary policy comparisons still favor the greenback, however, with US borrowing costs likely to remain ‘higher for longer.’
It’s not a stretch to worry that Sterling might look a little overextended now.
GBP/USD Technical Analysis

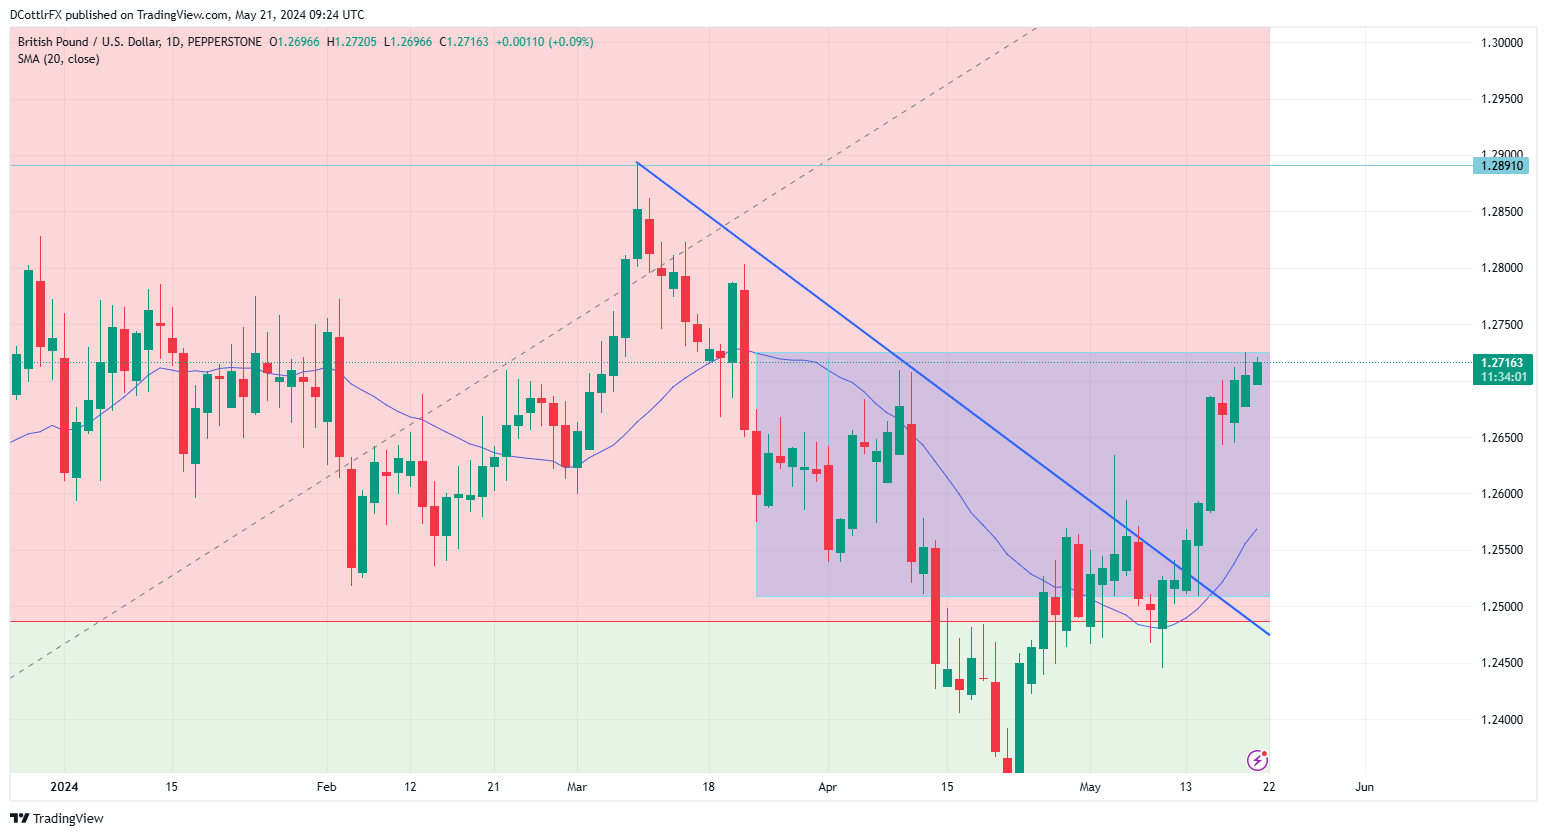
GBP/USD Daily Chart Compiled Using TradingView
Sterling has added nearly five US cents since it bounced back in late April. The previously dominant downtrend line from the peak of March 7 has been dealt with by Sterling bulls whose next hurdle is March 20’s peak of 1.27884. If they can consolidate around that then the psychological resistance of 1.28 will come into play.
Given GBP/USD’s sharp recent rise, it is perhaps a little surprising that the pair’s Relative Strength Index doesn’t more forcibly suggest overbuying. But it’s actually quite a long way below the 70.00 level which would ring alarm bells.
Still, the rally looks overextended nevertheless, and IG’s own data suggests most traders are bearish at current levels. This need not mean a new downtrend is coming, but it probably means that upside progress from current levels will be hard-won and subject to longer pauses for breath.
| Change in | Longs | Shorts | OI |
| Daily | -15% | 8% | -1% |
| Weekly | -10% | 9% | 2% |

