British Pound (GBP/USD) Analysis and Charts
- GBP/USD has slipped a little but remains above $1.25
- UK and US rates are now expected to start coming down in September
- Now it’s over to the BoE
The British Pound retraced some gains against the United States Dollar on Tuesday as local markets returned to fuller strength after a holiday Monday. Sterling cross rates are now likely to drift a little into Thursday’s session which will bring the Bank of England’s May monetary policy announcement.
Rates aren’t expected to go anywhere this month, with the key Bank Rate tipped to stay at 5.25%. So, assuming that expectation is met, the market focus will be on the voting split on the nine-member Monetary policy behind the decision and its accompanying commentary. The BoE has been known to produce the odd three-way split, with members voting for hikes, cuts, and no action.
However, this time we’ll likely get at most a two-way, with no one backing higher rates. Inflation in the United Kingdom remains well above the BoE’s government-set 2% target, but it is trending lower. The latest print, for March, came in at 3.2% , which was the lowest for well over two years. Monetary tightening already in place is clearly working, if slowly, and the UK’s sluggish economy certainly doesn’t need any more monetary braking.
At present futures markets think it likely that the first UK rate cut will come in September, which is also when they reckon the US Federal Reserve might make its first move. However, both forecasts are highly data-dependent. It was last week’s underwhelming US labor numbers that brought expectations of Fed action closer to date. Before that the markets were betting on a November move.
Sterling is likely to trade its current range into the decision and could struggle to gain if the BoE keeps rate-cut expectations where they are.
Learn how to trade GBP/ USD like an expert with our free guide
GBP/USD Technical Analysis

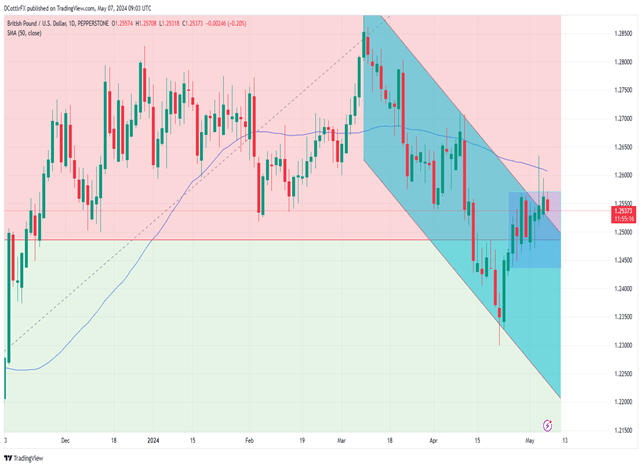
GBP/USD Daily Chart Compiled Using TradingView
Sterling has nosed above the broad downtrend channel formerly dominant since the peaks of mid-March. Still, the break higher doesn’t look hugely convincing yet and the bulls have more to do if they’re going to make it so.
For now, the range between April 29’s high of 1.25692 and April 24’s low of 1.24201 seems to be in play, with that downtrend channel offering support very close to the market at 1.25178.
Retracement support at 1.24859 looks pretty solid, with the 50-day moving average at 1.26067 providing a barrier should the range top give way.
The pair has spent most of this year above the first retracement of its rise up to the peaks of July last year from the lows of September 2022. It seems likely to remain there without some significant market shift.
| Change in | Longs | Shorts | OI |
| Daily | -15% | 8% | -1% |
| Weekly | -10% | 9% | 2% |
DailuFX

