- US jobs report (NFP) is highly anticipated, with market expectations for a 200k payroll figure. The unemployment rate is also a key focus, with a potential slight uptick to 4.2%.
- A print in line with expectations could lead to short-lived US Dollar reactions.
- Gold prices are currently range-bound between $2600-$2660, with the 2655-2660 zone being a key resistance area.
- Goldman analyst forecasts and impacts of the NFP report.
Market participants are waiting on today’s jobs report from the US in a week that has seen a lot of choppy price action and uncertainty. The exception being a US equity and Crypto rally which has given markets a wee bit of optimism as the Festive season approaches.
NFP Preview: What to Expect
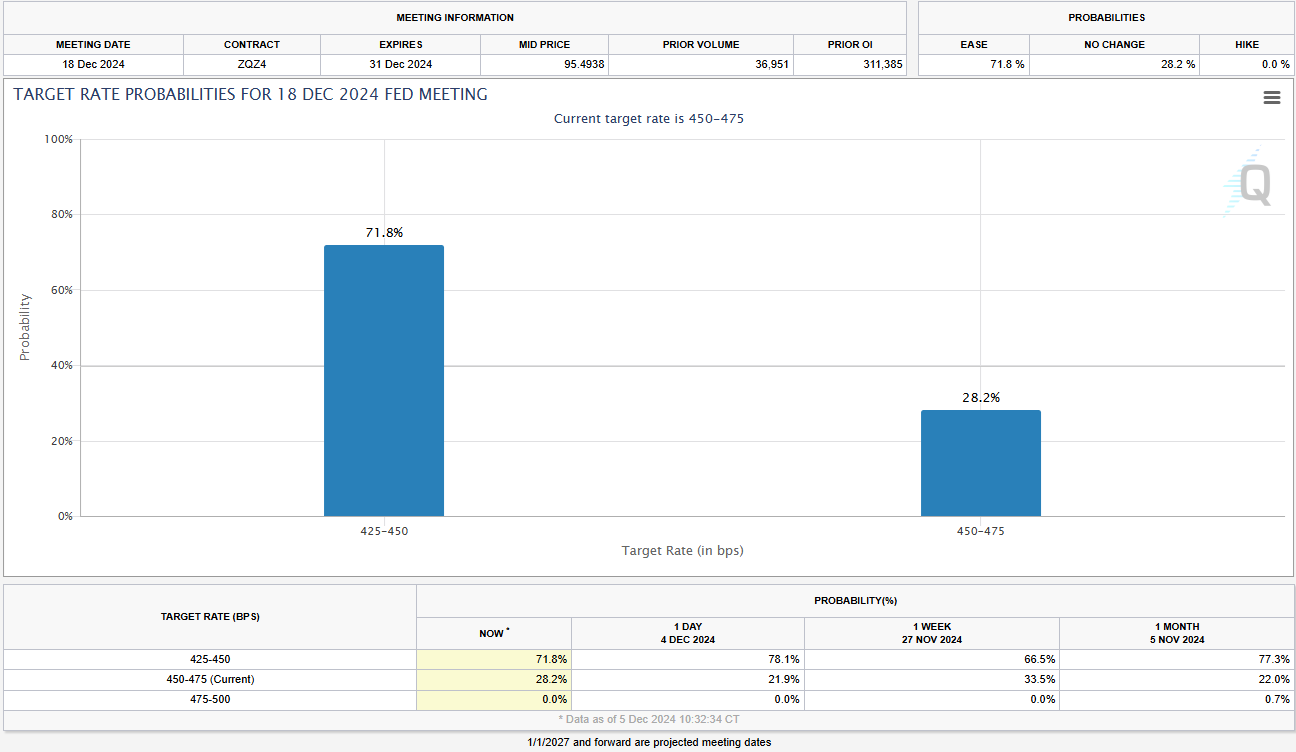
Heading into the jobs report and market expectations over US monetary policy have seen a significant shift over the past ten days. The probability of a 25 bps rate cut on December 18 has risen from 56% to a high yesterday of 78%, currently at 71%. Will the jobs data later today finally settle the matter?

The expected Non-farm payroll figure is 200k which would be a significant step up from last month’s disappointing print. Last month’s print was the worst in nearly four years, however, it is key to remember the impact of Hurricane Milton and the Boeing (NYSE: BA ) strikes. These all had a negative impact on job numbers and are all expected to reverse.
A job print above the 200k mark may prove to be less important than the unemployment rate which may be key. Markets are looking at a 4.1% print but I believe we could get a slight uptick toward 4.2%. Either way, should we get a print in the 4.1-4.2% range and a jobs number of 200k plus, I expect any immediate reaction by the US Dollar to prove short-lived. Similar to what we saw last month.
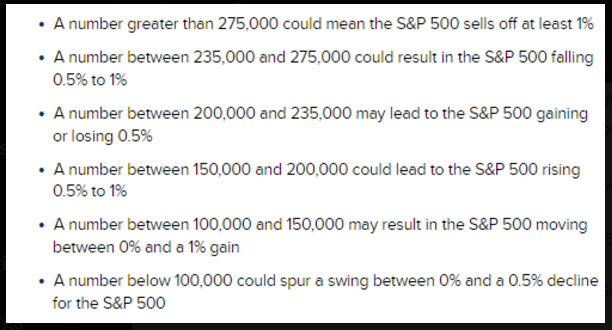
For interest’s sake I thought we could see what Goldman Sachs analysts are looking at from today’s report. Goldman’s analyst gives a scenario analysis for the NFP.
The “sweet spot” he says is 150k-200k which he expects will see a 0.5-1% rally. Worst case is >275k which may lead to a Dec FOMC rate cut skip. Notably every other scenario he sees less than a 1% move.

Impact on the US Dollar Index (DXY)
Such a print should keep the Fed on track for a 25 bps cut at the upcoming meeting and thus should not have any lasting impact on market moves. This could lead to steady US Dollar weakness heading into next week.
The US Dollar is historically weak in December, usually weighed down by portfolio rebalancing and a pivot to more risky assets. The recent rise in US Equities and slight US Dollar weakness may be a sign that this has already begun.
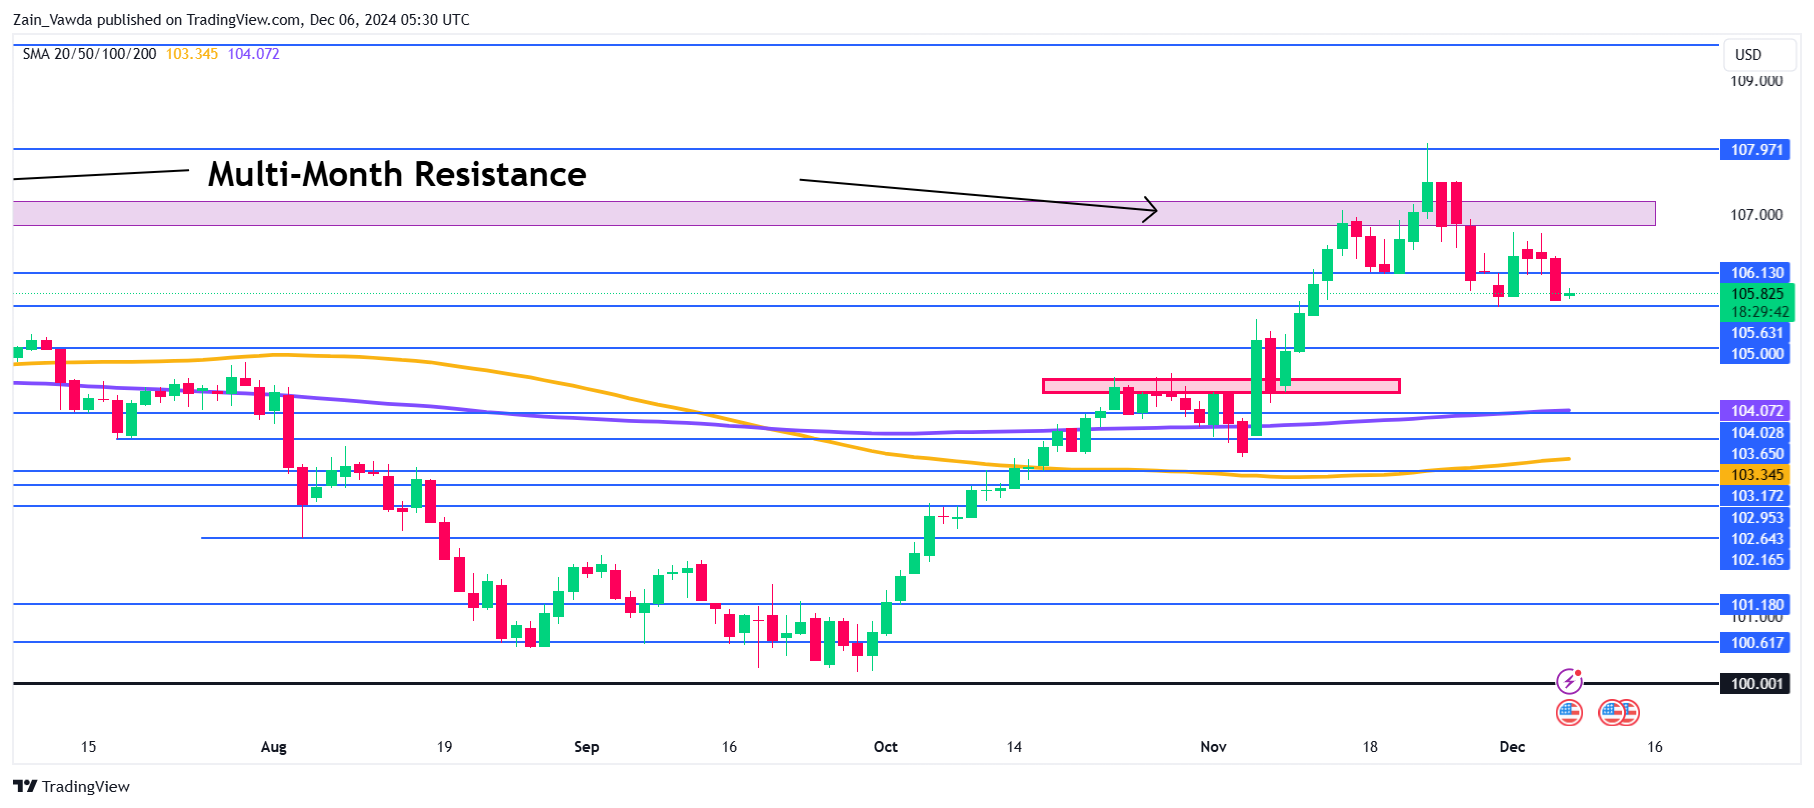
Yesterday saw the US Dollar Index print a bearish daily candle close which is a maubozu candlestick. No wick on either side suggests significant bearish pressure as the DXY is back at last week’s lows around 105.63.
A break lower brings the 105.00 handle into focus before the 104.50 handle.
The DXY needs to gain acceptance above the 107.00 handle if bulls are to continue their impressive run from the beginning of October.
US Dollar Index (DXY) Daily Chart, December 6, 2024

Technical Analysis Gold (XAU/USD)
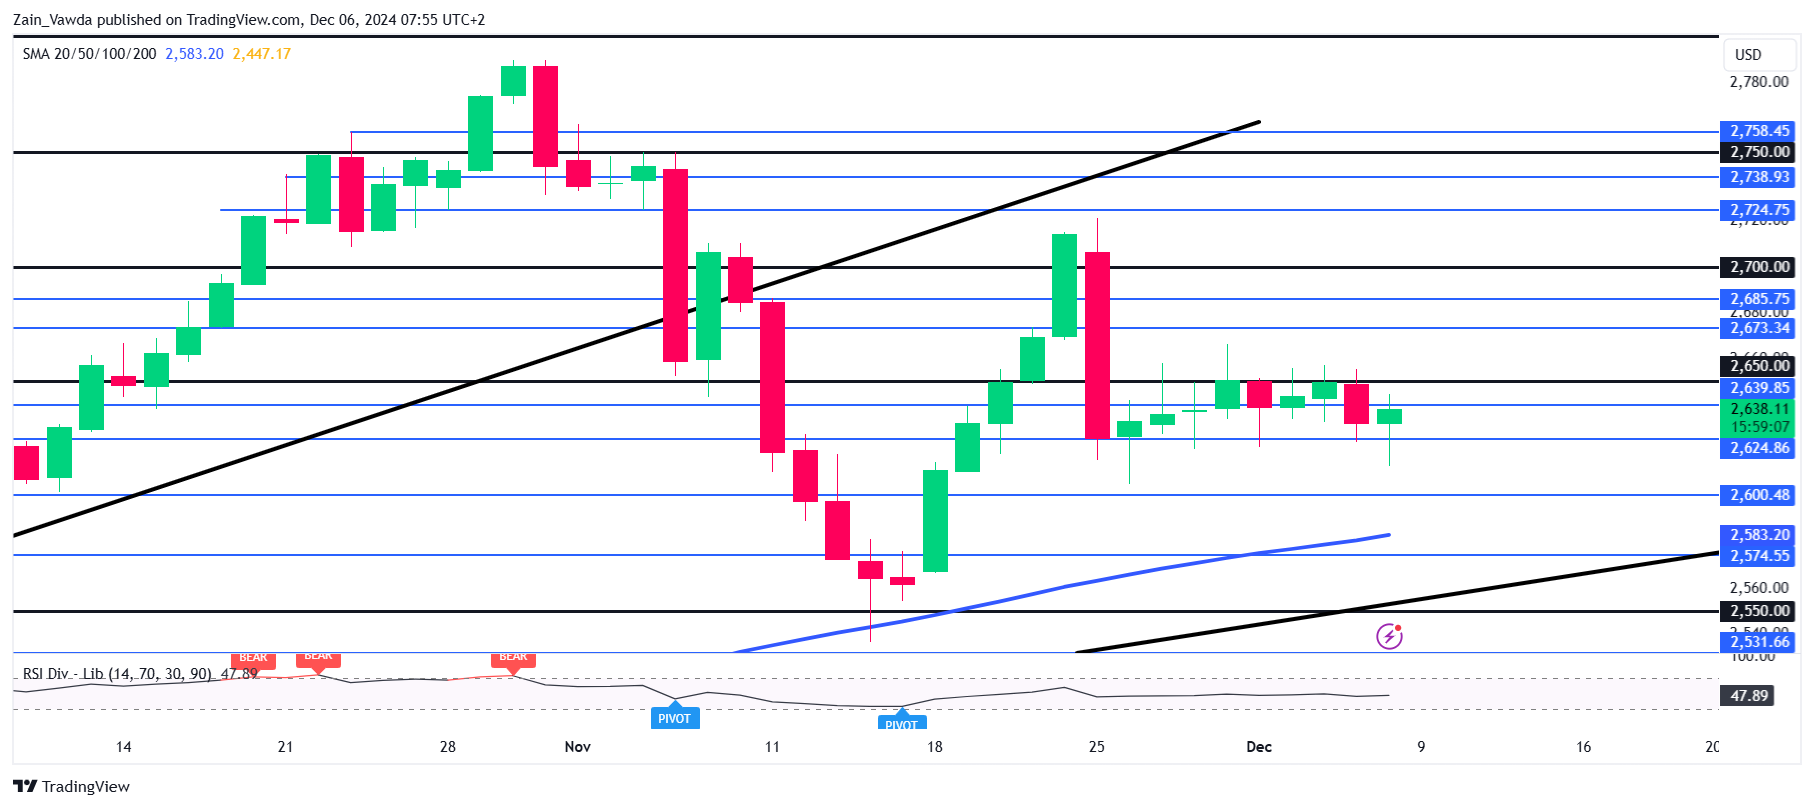
Looking at the Gold chart below, the range continues to hold between the $2600-$2660 area. The Asian session brought wild price swings for the precious metal with a low of 2612 before rallying toward the 2644 handle.
The one thing that has piqued my interest is the amount of rejections we have had in the 2655-2660 range suggesting this zone remains a key area. For not it appears that risks are tilted to the downside.
If the nobs data comes out largely in line with expectations and rate cut bets increase, I wonder whether bulls will be able to facilitate a breakout and acceptance above the 2660 handle.
A significant increase in the average hourly earnings and a jobs number closer to 300k could result in significant USD strength which could push Gold below the 2600 handle and beyond.
Gold (XAU/USD) Daily Chart, December 6, 2024

Support
- 2624
- 2612
- 2600
Resistance
- 2660
- 2675
- 2700
Original Post

