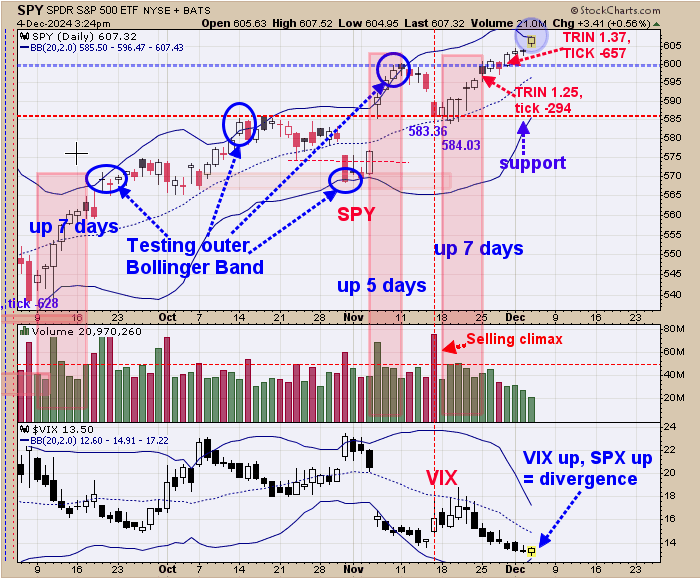
We are up 37%; SPX up 28% so far this year. Last Monday the TRIN closed at 1.25 and the tick at -294 and last Friday the TRIN closed at 1.37 and ticks at -657, both of which shows panic and bullish signs. At the top of the chart we shaded in blue where SPY is running to the outer Bollinger band and a resistance area. The bottom window is the VIX which was up on Thursday along with the SPY producing a bearish divergence. What may transpire short term is a consolidation for SPY (SPX) but larger trend remains up.

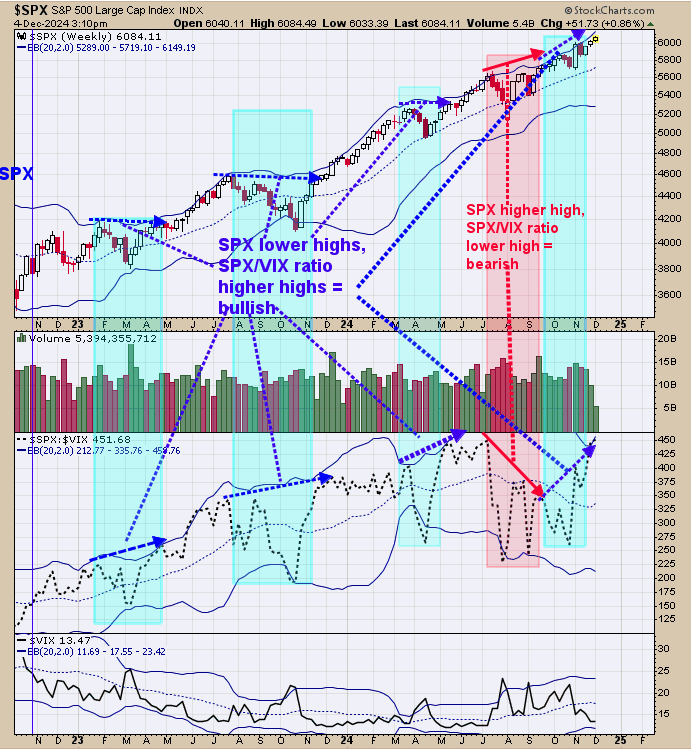
Above is a longer term view for the SPX. The top window is the weekly SPX and next lower window is the SPX/VIX ratio. Normally when the weekly SPX makes higher highs and the SPX/VIX ratio makes lower highs a bearish divergence is present. Also when the weekly SPX makes higher highs and the weekly SPX/VIX ratio also makes higher highs a bullish divergence is present. We noted in shaded pink the where a negative divergence present back in August September period. The SPX continue higher and the SPX/VIX ratio started to make higher highs negating the bearish divergence. We shaded in light green previous times when a bullish divergence was present and right now bullish divergence is present. Uptrend in SPX is intact.

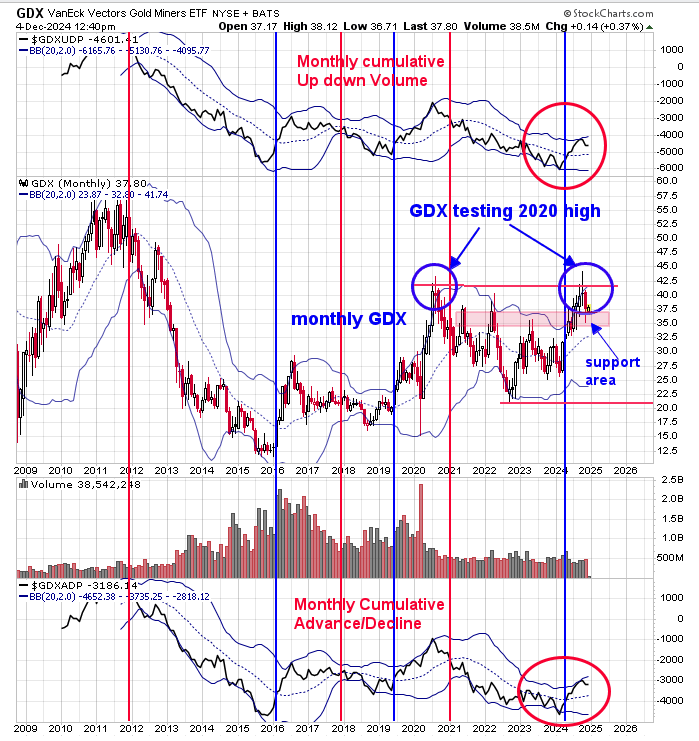
The top window is the monthly cumulative up down volume with its Bollinger band for GDX (NYSE: GDX ) and bottom window is the monthly cumulative advance/decline with it Bollinger band for GDX. You seen this chart meanly time before; it worth keeping an eye on as its defines the larger trend for GDX. Buy signals are trigged when both indicators close above their mid Bollinger bands (noted with blue lines). Last signal triggered was in May of this year. Signals last at a minimum of 1 ½ years suggesting the current signal should into November 2025 and maybe longer. Looking at the monthly GDX chart above; we shaded in pink the support area for GDX which GDX is currently testing. Monthly trend for GDX is up and GDX is at support.


