Over the past few weeks as I study charts and go about my daily life, I become consumed by the cost of living. I recently had a conversation with a friend where we were discussing what we were observing in the economy. The one commonality was that everything was becoming more expensive and that this is not normal nor is it healthy.
Readers of this blog will notice I often refer to August 15, 1971, as a pivotal day in economic history. That’s the day that President Richard Nixon took the US off of the gold standard, and ushered in the world of fiat currencies which we live in today. The results of this default are painfully obvious to everyone and after 53 years we can also conclude that they are painfully toxic.
I grew up in the 70’s. Looking back on that time frame I notice things today that I was completely unaware of at the time. In my neighborhood, my father supported a family of 6 and was the sole breadwinner. This was common and the standard. One worker paid for all the expenses of the household.
Today what I notice, and I’m not being extreme in this assessment, is two full-time breadwinners in a family often cannot afford to buy a house, healthcare, and food for their families. These two breadwinners are making substantially more income than my father made. The issue at hand is the currency we use to measure wealth has become debased. The end result is an affordability crisis that flies in the face of how we have traditionally defined financial success.
Let me share two charts which clearly show the nature of this problem.
Here is a chart from the Federal Reserve of Saint Louis on the Purchasing Power of the US Dollar since August 1971.
If a currency has lost 87% of its value over the last 53 years, this means that what you could buy with that currency 53 years ago now costs much more. To calculate how much more expensive life has become, we need to determine the factor by which prices have increased.

Here’s the step-by-step process to calculate this:
- Determine the remaining value of the currency: If the currency has lost 87% of its value, it retains 13% of its original value.

2. Calculate the price increase factor: To find out how much more expensive things have become; we take the inverse of the remaining value.

This means that, on average, life has become approximately 7.69 times more expensive for the users of that currency over the last 53 years. Therefore, if something cost 1 unit of currency 53 years ago, it would cost about 7.69 units of the same currency today.
This means that from August 15, 1971, till today the average price increase for goods and services is 769% higher! The implications of this metric are horrific and explain the volatility in our world today. While we should easily be able to admit that the fiat currency experiment has been a dismal failure our bureaucrats and political interests are unwilling and incapable of admitting defeat.
Next, here is a long-term chart of the S&P 500 Index from August 1971 to present. In August 1971, the S&P 500 was trading at 762.26. Today it is at 5360.
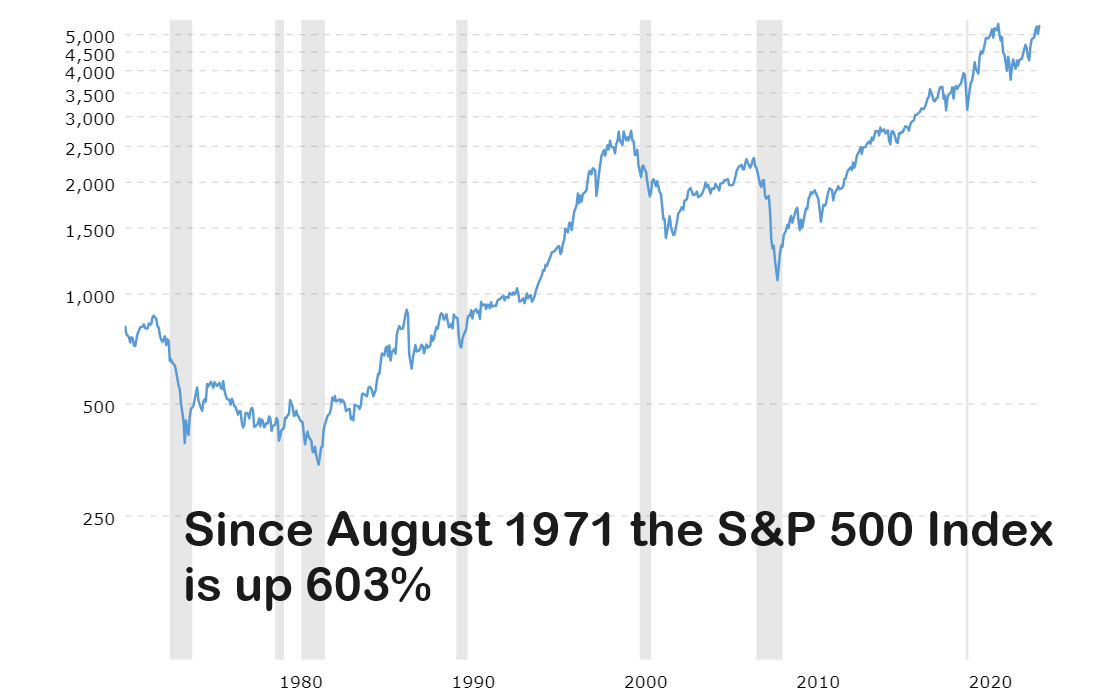
The majority of analysts focus on the 603% increase without looking at the corresponding decrease in the purchasing power of the US dollar . I refer to this as Economic Gaslighting.
What I find very disturbing about that reality is that it communicates that with August 1971 as a start if you invested in the top 500 stocks in the market you did not keep up with the cost of living. However, if you stayed in cash, you lost 87% of your purchasing power.
Here are the prices of a handful of Goods services in 1971 and today. You’ll notice that from this broad basket of goods some prices are more than 7.69 x higher and some are a bit lower, but overall, the general price increase in definitive.
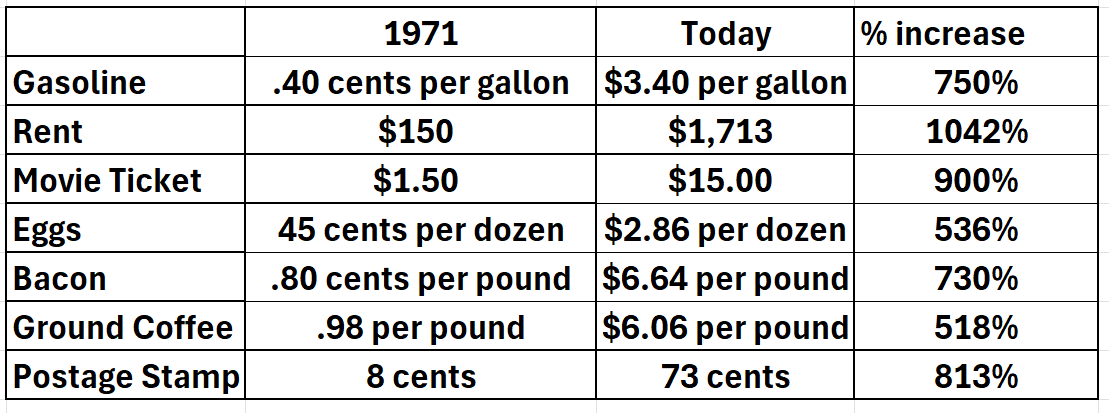
Note: the price of a postage stamp will increase to 73 cents a stamp on July 14, 2024. I reflected the future price of a postage stamp in my calculation.
The purpose of this article is not to complain about the rising general price level of goods and services. It unfortunately is the way things are and will continue to be. The purpose of this article is to alert the reader as to the implications of these price increases. What does it say about the health of an economy or an individual when they are greatly challenged to keep up with the general cost of living? This is why I refer to this as gaslighting.
In 1944, actress Ingrid Bergman won an Academy award for her performance in the movie “Gaslight.” The plot centers on a husband who manipulates his wife into thinking she is losing her sanity. He achieves this by subtly altering their surroundings, such as dimming the gas lights, and then denying that any changes occurred, thereby making her doubt her perceptions and sanity.
The term “gaslighting” originates from this film. It describes a specific kind of psychological manipulation where the abuser makes the victim question their reality by continuously denying the truth and altering elements of the environment. This insidious form of abuse aims to make the victim doubt their own memory, perception, and sanity.
The reason everything is so much more expensive is that the US dollar is perpetually being debased. Most people are unaware of this reality. Yet, it is and will continue to be the normal monetary policy.
What most people simply see is prices increasing and their first thought is that the manufacturer of that item is trying to exploit them by charging more. I reflect on this reality to compare the differences of my youth where one breadwinner could easily support a family of 6, and the economic reality today where two breadwinners cannot get even close to the same bang for the buck.
Personally, I think it speaks volumes about the level of currency debasement that has occurred when the S&P 500 is not keeping pace with the cost of living over the last 53 years.
The calculation that I made is based off the Relative Strength Performance formula. From this perspective, I am looking at the relative decrease in purchasing power of the US Dollar over the last 53 years and claiming that its value in 1971 is parity.

Traders use the Relative Strength Performance formula to find top performing assets. The Relative Strength Performance (RSP) formula compares the performance of one asset to a benchmark, where a value greater than 1 indicates outperformance and less than 1 indicates underperformance. It is important because it helps investors identify strong performing stocks relative to the market, aiding in better investment decisions. This metric has become a standard tool, leading to a world where money managers routinely compare their performance against an index like the S&P 500 to gauge success. By doing so, they can objectively assess their investment strategies and make necessary adjustments to improve returns. The reason I found this analysis so disruptive, and disturbing is that 80% of top money managers do not outperform the S&P 500 Index. Shouldn’t we be benchmarking against a better gauge that reflects the true cost of living increase?
The obvious question to ask is what is the source of the currency debasement? Milton Friedman, a renowned economist, famously asserted that inflation is always and everywhere a monetary phenomenon. According to Friedman, the primary cause of inflation is an increase in the money supply that outpaces economic growth. He argued that when a government prints more money, it leads to more money chasing the same amount of goods and services, which drives up prices. This perspective is rooted in the quantity theory of money, which posits that the general price level of goods and services is directly proportional to the amount of money in circulation. Friedman emphasized that while various factors, such as supply shocks or changes in demand, can influence short-term price levels, sustained inflation over the long term can only occur through continuous increases in the money supply. He advocated for monetary policies that control the growth rate of the money supply to manage inflation effectively.
What infuriates me about financial media and reporting is that no one wants to address the source of the currency debasement which is always the Federal Reserve and the US Treasury. Instead, we receive these pronouncements from the media about how strong and resilient the economy is, particularly after an important economic report is released. It always has me scratching my head and asking the most basic of questions.
Since I am highly skeptical of almost all government reports, recently I have been asking myself the question of, how do you define a healthy economy? That question has led me down some very interesting rabbit holes which I will explore in future articles.
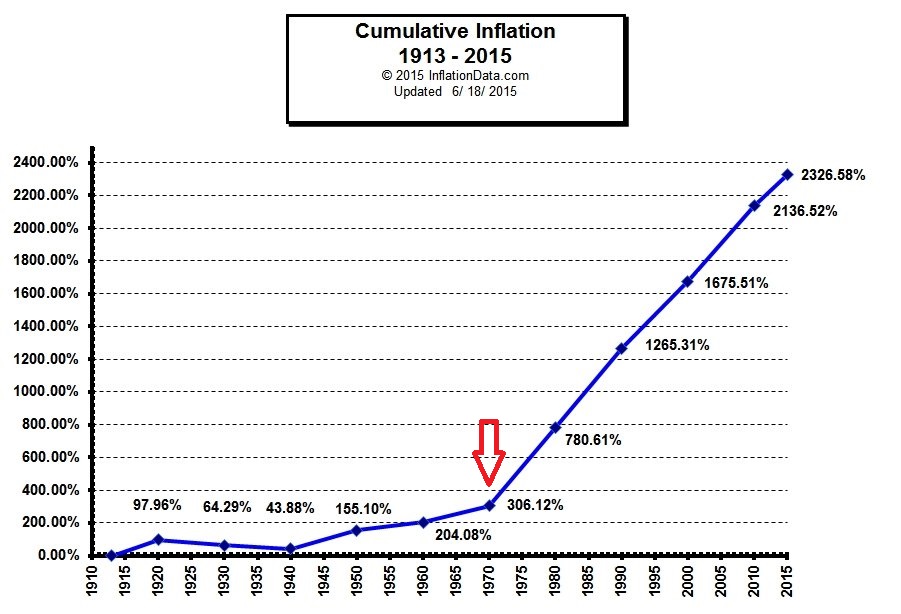
The chart below shows the cumulative inflation in the economy from 1913, when the Federal Reserve Act was passed to present. The red arrow on the chart is August 1971 when the US came off of the gold standard. Inflation is the norm, not the exception.
Several months ago, I began to read stories of numerous restaurants facing bankruptcy or permanent closure. I consider this noteworthy, because often the first expense that people cut back on when the money is short is going out to eat. When restaurants start closing it is not a good economic indicator. Here is a graphic of many of the brands which shut down a huge number of locations of are closing their doors for good.
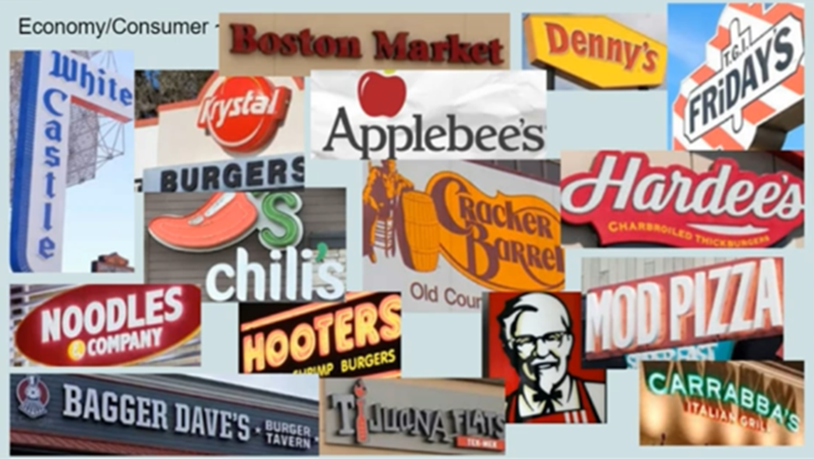
In 2024, several restaurant chains filed for bankruptcy or closed down, largely due to inflationary pressures. Notable examples include:
– **Red Lobster**: Filed for Chapter 11 bankruptcy in May, planning significant location reductions and searching for a new buyer.
– **Tijuana Flats**: Declared bankruptcy in April, closing numerous locations due to rising costs and changing consumer habits.
– **Boxer Ramen**: Closed all locations in May after filing for Chapter 11 bankruptcy in February, along with its sister chain SuperDeluxe.
– **Sticky’s Finger Joint**: Filed for bankruptcy in April, affected by pandemic-related issues and legal troubles.
– **Popeyes (RRG franchisee) **: A 17-unit franchisee filed for Chapter 11 bankruptcy in January due to underperforming locations and financial burdens from unpaid leases.
These instances highlight the broader challenges in the restaurant industry and how they are also adversely affected by affordability issues which are also reflective of the massive currency debasement/inflation that has occurred over the last few years.
One of my ongoing playful economic metrics that I use to gauge the health of a market and the economy is the price of cheesecake, Before the pandemic my favorite cheesecake cost $7.49. Today that same product costs $11.99. This represents a 60% increase in 4 years. This 60% price hike is far above what the Consumer Price Index (CPI) reports, leading me to question its accuracy and what it truly measures. Despite my ability to afford it, I refuse to pay such an inflated price, which seems disproportionately higher than most investments over the past four years.
Over the last 4 years the S&P 500 is up 64% and the NASDAQ is up 76%. Once again this sounds impressive. But what does it say about these indexes when they barely outpace the price of cheesecake?
If you are a mainstream economist, you will blame the cheesecake baker for gauging customers. However, I can’t even imagine a healthy economic environment where the price of a dessert is rising as quickly as the broader stock market.
I was reminded of this recently when I stumbled across similar metrics from some well-known and popular fast-food restaurants.
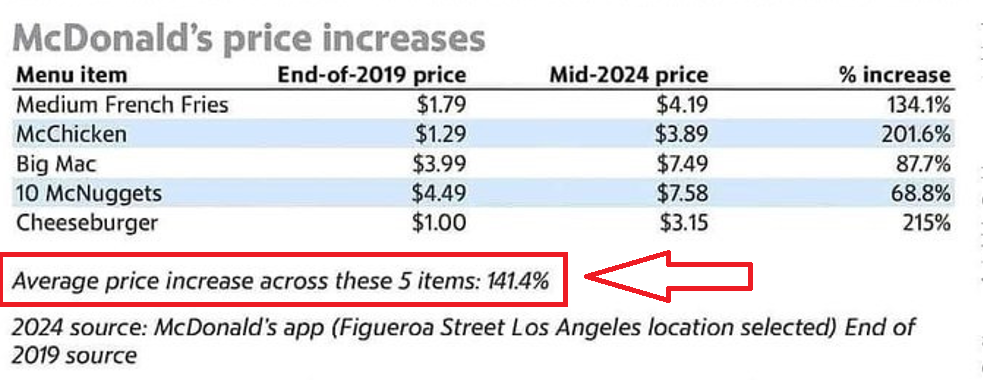
The average price increase at McDonalds over the past 5 years has been 141.4%!
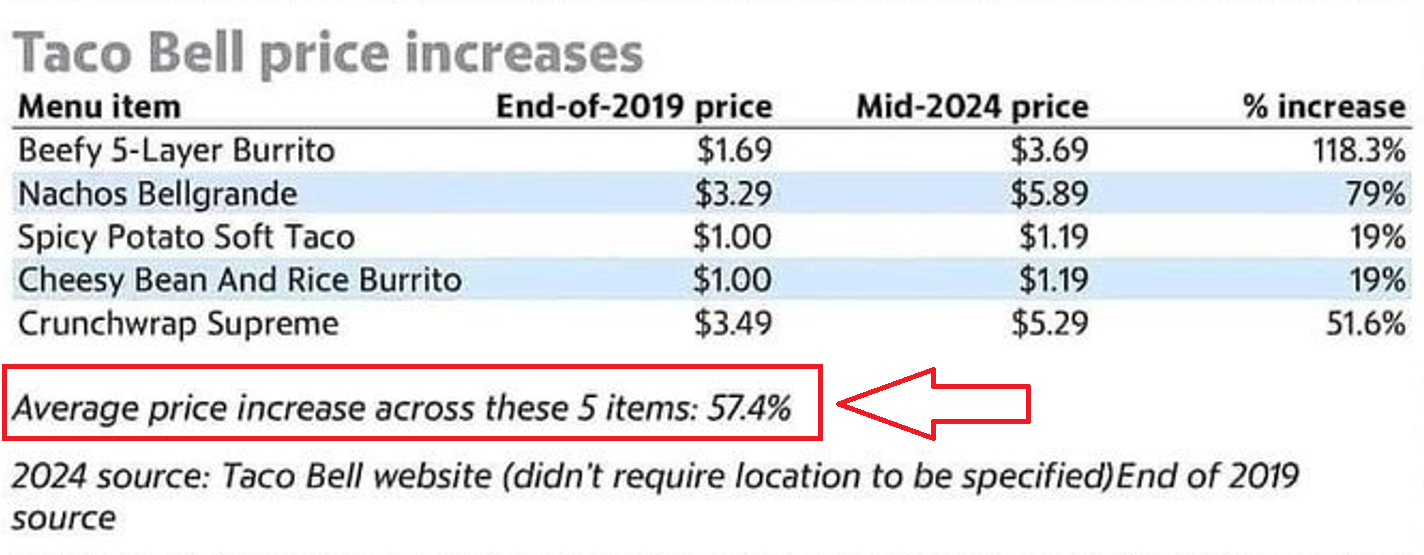
The average price increase at a Taco Bell over the last 5 years has been 57.4%.
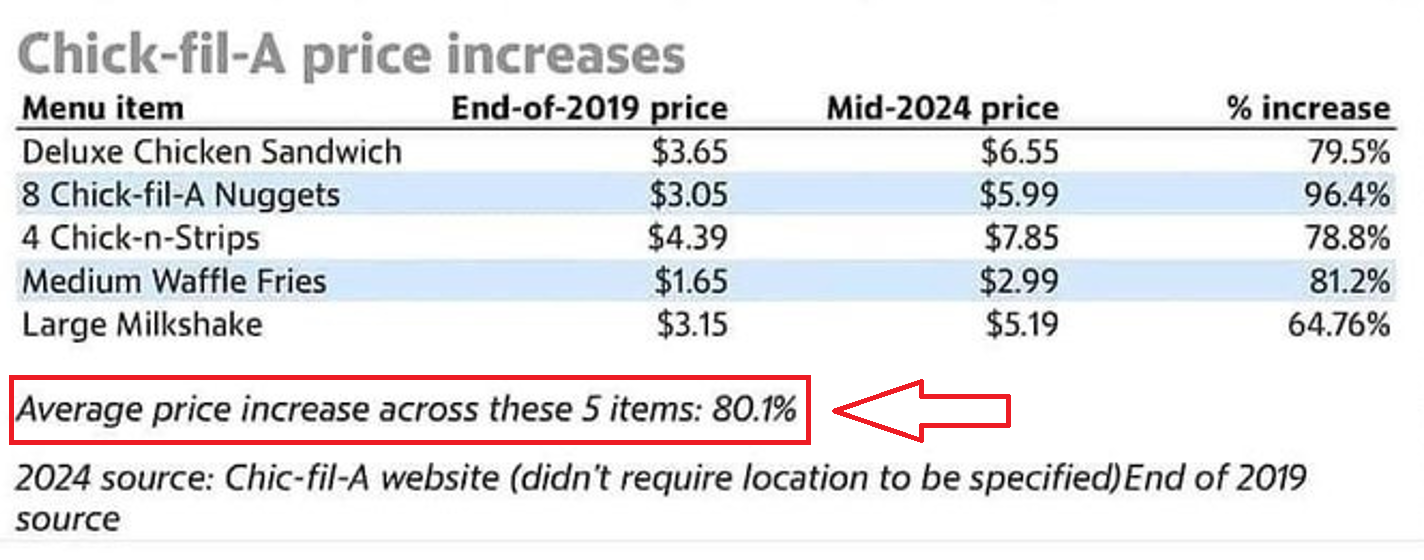
The average price increase at a Chick-fil-A is 80.1%.
What do you call an economic environment when the broader stock market indexes do not keep pace with the price increases of fast food? It certainly explains why restaurants are having hard times. Not exactly a “Happy Meal” environment.
I hope these facts and figures are creating some dissonance in your current perspective. Why? Because at VantagePoint we teach traders that to be successful in trading the markets your only loyalty has to always be to the trend.
Let me explain.
If you turn on the financial media, you will hear an abundance of the following perspectives. Neither which will help you keep pace with the level of currency debasement which is occurring.
The most bullish case for the US markets involves strong economic growth, driven by consumer spending, business investment, and government stimulus. Corporate earnings are expected to grow, particularly in sectors like technology and green energy, while accommodative monetary policy and low interest rates provide liquidity and encourage investment. The fact that it is an election year also suggests increased government spending and fiscal stimulus, as the administration seeks to boost economic performance and market confidence to enhance re-election prospects.
Conversely, the most bearish case centers on persistent high inflation, which could erode purchasing power and lead to aggressive interest rate hikes by the Federal Reserve, increasing borrowing costs and dampening economic activity. Geopolitical risks and high levels of corporate debt add to market uncertainty and potential instability. Overvalued stock prices may also correct if economic fundamentals do not support current valuations. While election year dynamics might temporarily boost market performance through increased spending and regulatory easing, the long-term sustainability of these measures is uncertain.
Let me be perfectly clear. We do not have a healthy and vibrant economy. The facts and figures I have provided clearly show the problems of persistent inflation. Yet I am wildly bullish the stock market at the present moment. Why? Because it is making new 52-week highs and new 10-year highs simultaneously. This is one of the strongest trend setups you will ever find in the world of trading. But you must also understand that it is completely disconnected from what is happening in the economy. That may be a hard pill to swallow.
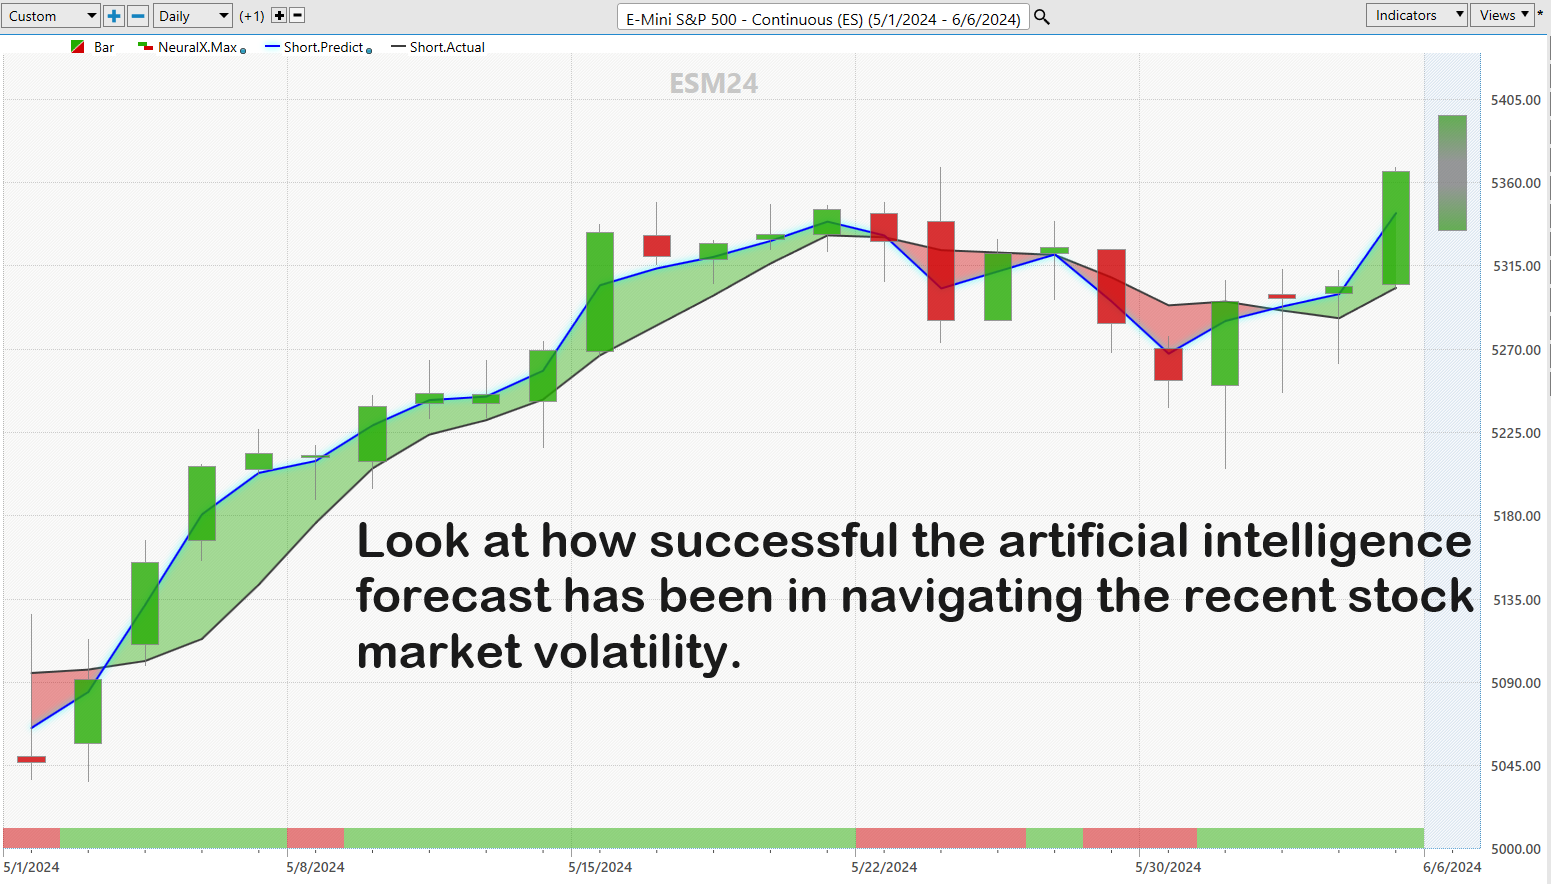
More importantly, the artificial intelligence forecast is bullish and that will always be my North Star.
Here is a 52-week chart of the S&P 500 Index. Look at it breaking to new highs.
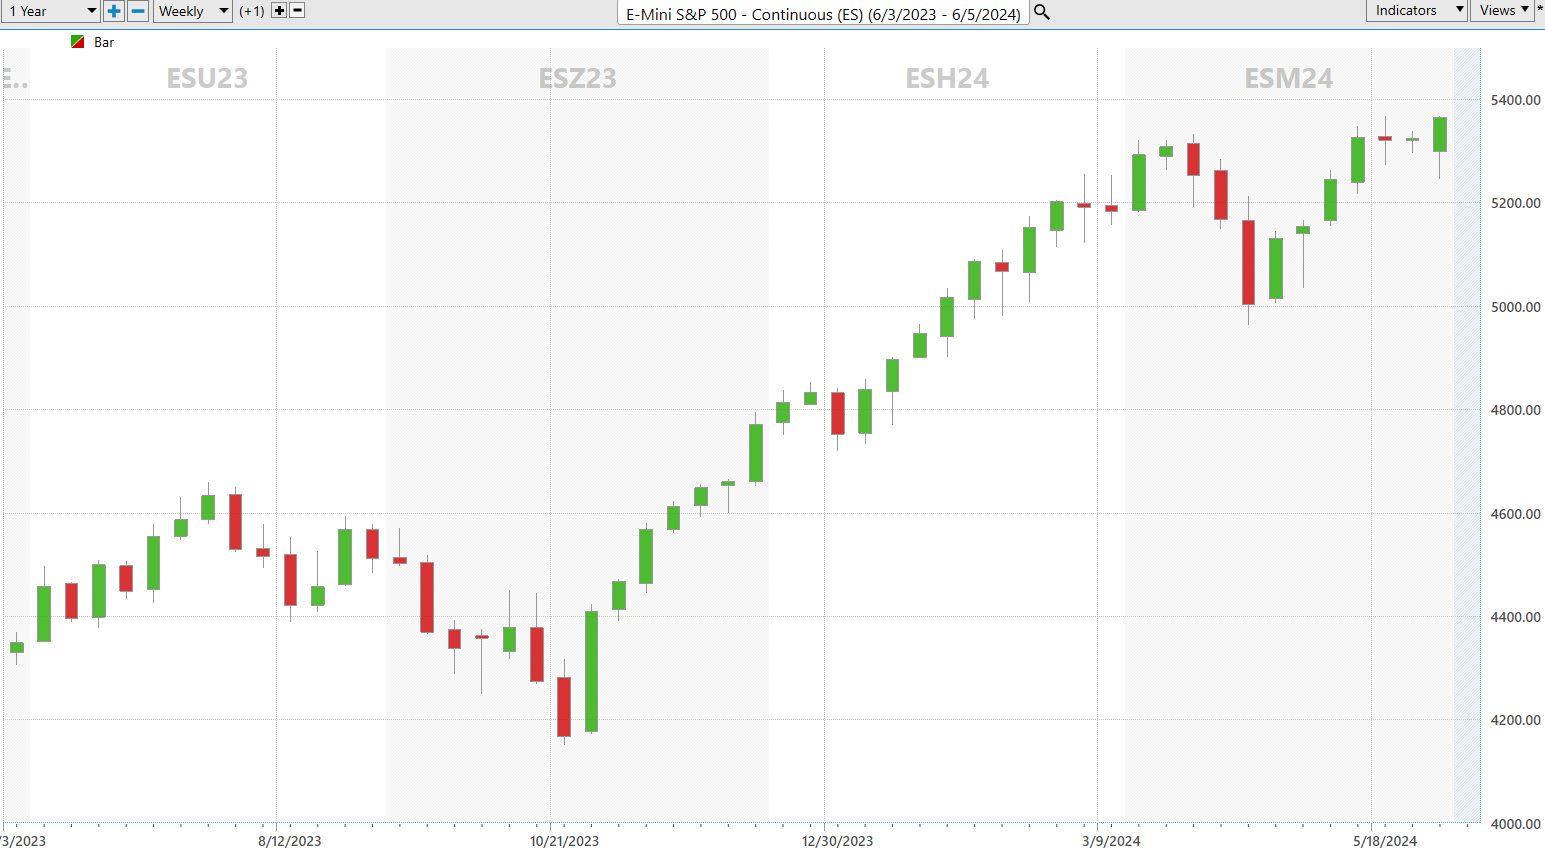
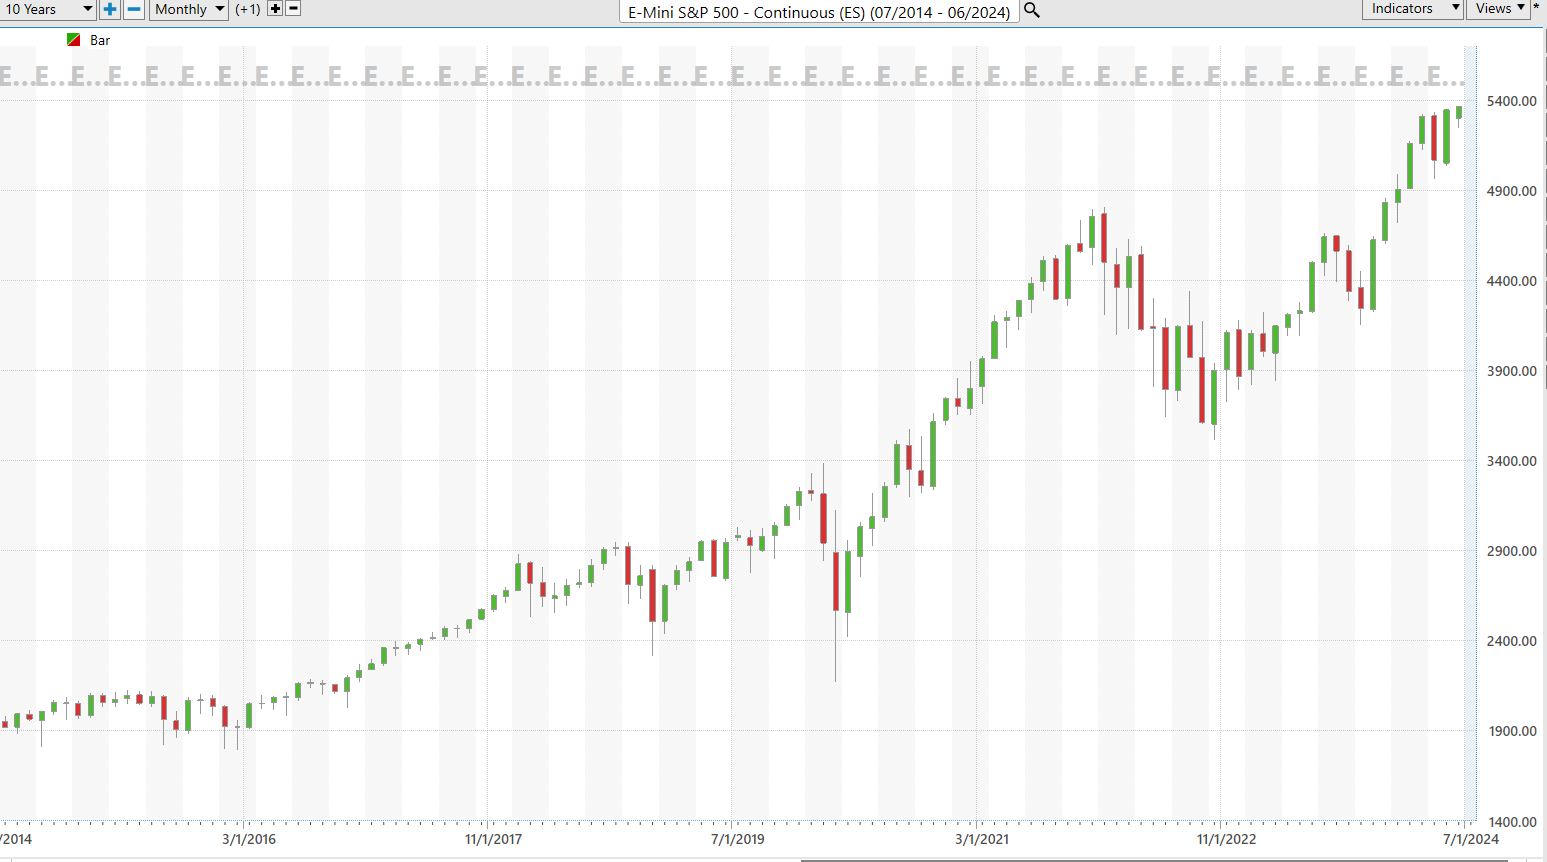
Here is the 10-year chart of the S&P 500 Index. Observe how it too is simultaneously breaking to new all-time highs. Whenever any market is doing this, you may not agree with it, but don’t stand in its way.
Remember when I said that if you want to be successful, your only loyalty needed to be to the trend?
What has your experience with inflation been?
Has your rent/housing only increased by 3.5% over the past year?
How about groceries?
Clothing?
Medical Care?
Insurance?
Gasoline?
Entertainment?
The Bureau of Labor Statistics will never be held accountable for the reality that CPI bears very little value to what occurs in the real world.
Since CPI is already down from its all-time highs, watch closely these new CPI reports moving forward. Those are the talking points in the financial media.
You will not hear anyone discuss the reality that the stock market indexes are not keeping pace with the cost of fast food in America. Your only concern has to be how do you stay ahead of the massive currency debasement that is occurring.
I learned long ago that markets can remain irrational far longer than I can remain solvent.
This is the primary reason why I trade with artificial intelligence . When the a.i. turns I pay attention. When it aligns with my fundamental reasoning, I pay extra close attention and look to exploit the short side of the market.
Great trading is never about how much you make when you are right, but rather by how little you lose when you are wrong.
Everybody has had horrible trades. The difference between the winners and losers in life is that the winners learned immensely powerful lessons from their losses.
Artificial intelligence trading software is so powerful because it learns what doesn’t work, remembers it, and then focuses on other paths to find a solution. This is the Feedback Loop that is responsible for building the fortunes of every successful trader I know.
Artificial Intelligence applies mistake prevention as a continual process 24 hours a day, 365 days a year towards whatever problem it is looking to solve.
That should get you pretty excited because it is a game-changer.
Find the trend.
Scrutinize the 1–3-day forecast.
Lather. Rinse. Repeat.
The answer A.I. offers may surprise you.
This is how small traders grow their accounts by taking small bites out of the market consistently.
Today Artificial Intelligence, Machine Learning and Neural Networks are an absolute necessity in protecting your portfolio.
I, like everybody else, have my opinions about what will happen next. But I never let my opinion get in the way of what the artificial intelligence is forecasting.
Intrigued? Visit with us and check out the a.i. at our Next Live Training.
We’ll discuss strategies like this one and show you at least three stocks that have been identified by the A.I. that are poised for big movement.
Discover why artificial intelligence is the solution professional traders go-to for less risk, more rewards, and guaranteed peace of mind.
It’s not magic. It’s machine learning.
Make it count!
THERE IS A SUBSTANTIAL RISK OF LOSS ASSOCIATED WITH TRADING. ONLY RISK CAPITAL SHOULD BE USED TO TRADE. TRADING STOCKS, FUTURES, OPTIONS, FOREX, AND ETFs IS NOT SUITABLE FOR EVERYONE.IMPORTANT NOTICE!
DISCLAIMER: STOCKS, FUTURES, OPTIONS, ETFs AND CURRENCY TRADING ALL HAVE LARGE POTENTIAL REWARDS, BUT THEY ALSO HAVE LARGE POTENTIAL RISK. YOU MUST BE AWARE OF THE RISKS AND BE WILLING TO ACCEPT THEM IN ORDER TO INVEST IN THESE MARKETS. DON’T TRADE WITH MONEY YOU CAN’T AFFORD TO LOSE. THIS ARTICLE AND WEBSITE IS NEITHER A SOLICITATION NOR AN OFFER TO BUY/SELL FUTURES, OPTIONS, STOCKS, OR CURRENCIES. NO REPRESENTATION IS BEING MADE THAT ANY ACCOUNT WILL OR IS LIKELY TO ACHIEVE PROFITS OR LOSSES SIMILAR TO THOSE DISCUSSED ON THIS ARTICLE OR WEBSITE. THE PAST PERFORMANCE OF ANY TRADING SYSTEM OR METHODOLOGY IS NOT NECESSARILY INDICATIVE OF FUTURE RESULTS. CFTC RULE 4.41 – HYPOTHETICAL OR SIMULATED PERFORMANCE RESULTS HAVE CERTAIN LIMITATIONS. UNLIKE AN ACTUAL PERFORMANCE RECORD, SIMULATED RESULTS DO NOT REPRESENT ACTUAL TRADING. ALSO, SINCE THE TRADES HAVE NOT BEEN EXECUTED, THE RESULTS MAY HAVE UNDER-OR-OVER COMPENSATED FOR THE IMPACT, IF ANY, OF CERTAIN MARKET FACTORS, SUCH AS LACK OF LIQUIDITY. SIMULATED TRADING PROGRAMS IN GENERAL ARE ALSO SUBJECT TO THE FACT THAT THEY ARE DESIGNED WITH THE BENEFIT OF HINDSIGHT. NO REPRESENTATION IS BEING MADE THAT ANY ACCOUNT WILL OR IS LIKELY TO ACHIEVE PROFIT OR LOSSES SIMILAR TO THOSE SHOWN.

