Markets and the information they disperse can be incredibly overwhelming. Trading in the financial markets can be a complex endeavor, often likened to navigating a vast ocean of data, tools, and strategies. One of the greatest challenges for traders, whether novices or seasoned professionals, is sifting through the almost unlimited amount of information available to them. This includes real-time market data, historical trends, analytical tools, and myriad expert opinions. The key difficulty lies not in accessing this information but in differentiating what is essential from what is merely noise. In such an environment, the ability to ask the right questions becomes crucial. It is not just about having the right tools or the most data but knowing which questions will reveal the most pertinent insights for making informed decisions.
Moreover, a deep and nuanced understanding of risk is fundamental. Trading is inherently risky, and successful traders are those who not only seek to maximize returns but also meticulously manage the risks associated with their strategies. In this article we will dive deep into the questions that successful traders ask when they are analyzing opportunities.
Every week we here at VantagePoint A.I. do a weekly stock study analysis where we apply these commonsense fundamentals to one stock. I invite you to visit our website and dig in and develop your nuanced understanding of risk and reward.
Every trader wants to know what assets are going to increase in price and which assets are going to decrease in price. While this question is important, a better question is what causes assets to increase or decrease in price?
How can I effectively define the trend?
How can I effectively define risk in any market condition?
How do I define the word normal for each asset that I am trading?
These questions are the questions that allow trading mastery to occur.
Do you remember the children’s game, Simon Says? “Simon Says” is a popular children’s game that involves one player, known as “Simon,” giving commands to the other players. To successfully follow the rules, participants must only obey the commands that are prefaced with the phrase “Simon says.” If Simon issues a command without this key phrase and a player follows it, they are out of the game. I think that great trading is often very similar to playing “Simon Says.”
Many traders complicate trading by trying to predict what SIMON is going to do next and think that is what the trading activity is all about. However, if you trade for any period of time, you will spend an immense amount of energy understanding what the word “follow” means.
Let me explain.
If you do what the market does, you will make money.
If you do the opposite of what the market does you will lose money.
If these premises are true then the key question that we must always ask when analyzing an opportunity is, what is the market doing?
This initial question is very broad but vitally important.
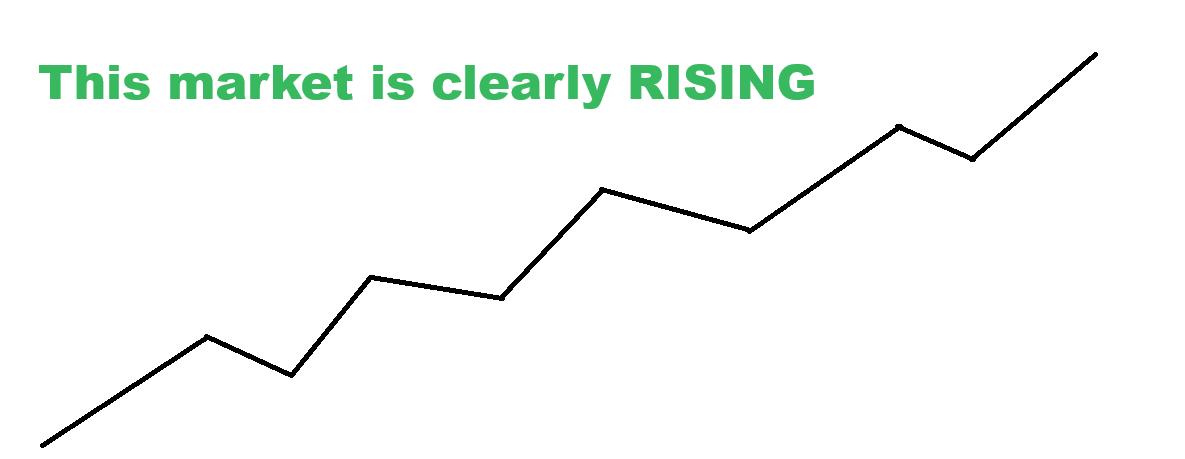
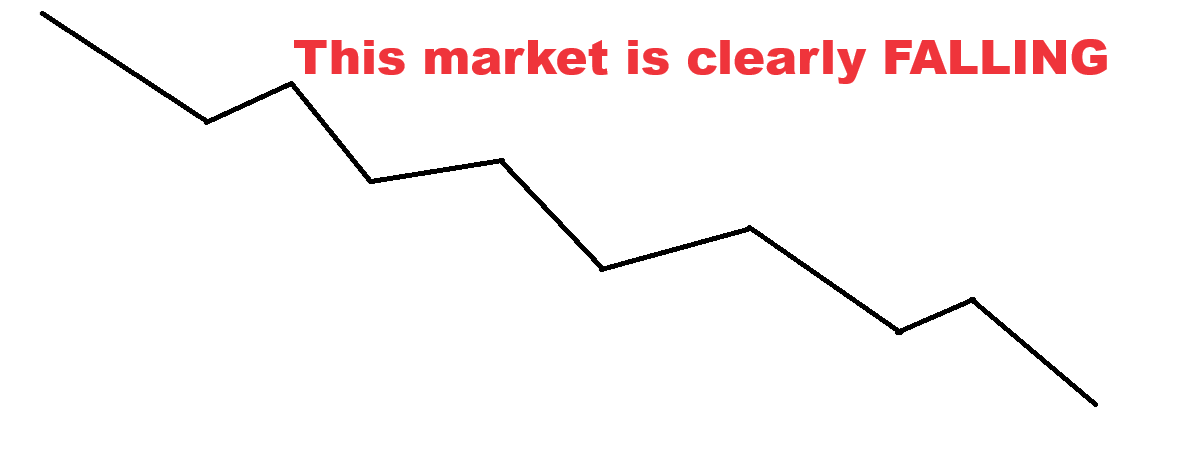
There are times when it is obvious what the market is doing and incredibly easy to profit from its price action.
For example, the market is clearly rising in the graphic below.
The market is clearly falling in the following graphic.
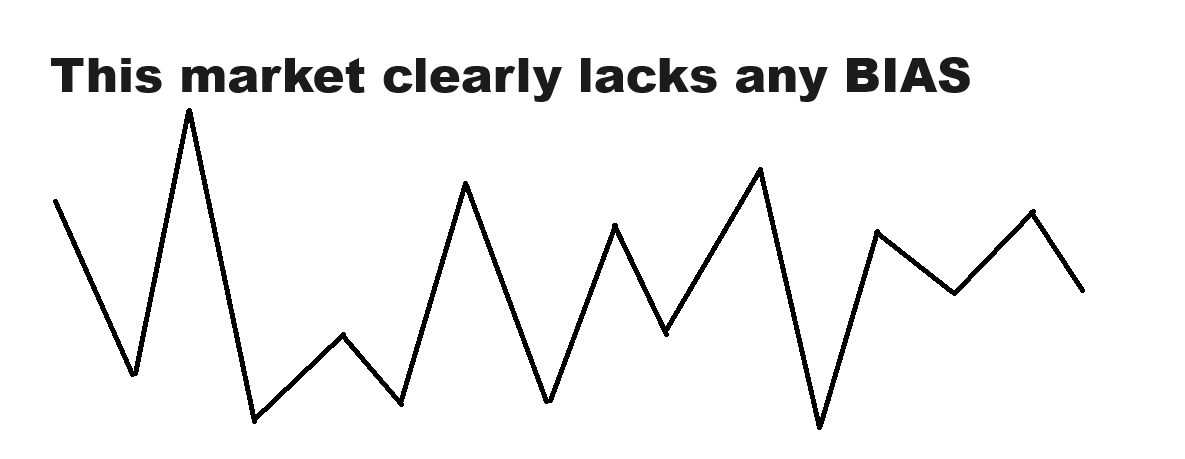
Then there are times when it is almost impossible to understand what the market is doing. In these instances, a smart trader is wise when they choose not to participate.
To understand what a market is doing we always advise a trader to understand what we refer to as “market structure.”
In the context of financial markets, “structure” based on price performance history across various time frames refers to the patterns and trends that emerge from the analysis of price movements over multiple time periods. This is very simple to do.
The purpose of examining market structure through this lens is to distill complex market data into a coherent answer to the simple question: “What is the market doing?” By analyzing price performance over short, medium, and long-term time frames, traders and investors try to gauge the market’s current state—whether it’s trending up, down, or sideways.
Market structure allows us to quickly SEE and understand the trend and where it might be fractured.
All markets can be viewed and studied from an infinite number of time frames.
So first off, we must look at performance of a market over numerous time frames to attempt to answer the question: “what is the market doing?” Often, the answer to this simple question can be very nuanced, and appreciating the subtleties of the nuance is vital for traders in understanding opportunity and risk.
For example, in The VantagePoint Hot Stocks Outlook we begin our weekly video analysis with a multi time frame analysis of the SPY SPDR ETF ($ETF) and look at its performance from a one year, 6-month, year to date, one month and 5-day performance. Here is what the multi time frame analysis graphic looked like on July 26, 2024 .

It is this level nuance that traders are confronted with daily and must always address. Evaluating the graphic above we can see that the $SPY was UP on the longer time frames and down on the shorter time frames.
I refer to this as a fractured market structure which simply means that the longer-term trends were up, but the shorter-term trends were down.
So, step one of trading is to always define the trend using a multi time frame analysis approach.
Next, measure the performance on multiple time frames to determine the strength and consistency of the trend.
Next, if the market structure is fractured, highlight those time frames on the charts and look for evidence for which trend will prevail over the time frames where the market is fractured.
Here is what a chart of the $SPY during this time frame looked like.
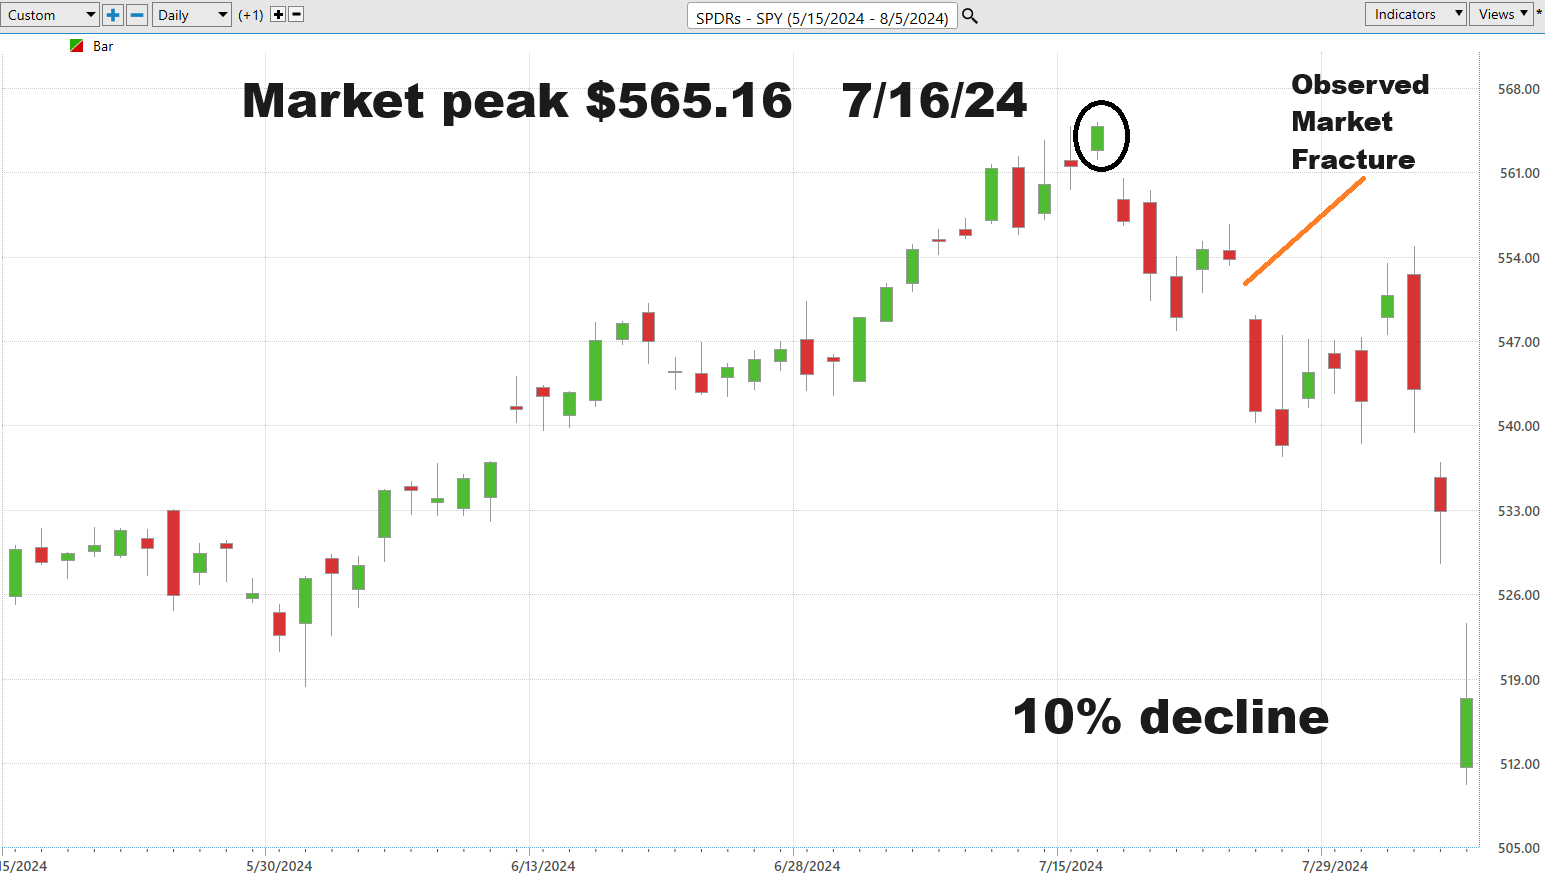
In other words, the BEARS were in control over the shorter term and the BULLS were in control over the longer term. What is vital for success in this type of market environment is careful position sizing and prudent risk management.
In other words, what if you are right, and what if you are wrong?
The market at this juncture is simultaneously UP in the long term and DOWN over the shorter term which means that traders are uncertain, and volatility is rising.
It is critical for traders to have this type of nuanced understanding of the trend.
Here is what the market structure looks like on the $SPY as I write this article:

The market is still slightly fractured, but the condition has improved. If you were a doctor and that performance metric was your patient, you would focus your attention on trying to understand the negative performance over the past month of –1.75%.
The reasons for that decline could be very basic, or very complicated. But the repair of that fracture is going to be necessary if the uptrend is going to continue.
Once we build a nuanced understanding of market structure using multi-time frame analysis, we then must try and define “what is normal?”
Newbie traders think of UP as Good and Down as Bad.
As you develop more experience as a trader you understand that long term survival in the markets occurs when traders successfully comprehend and learn to navigate risk and volatility.
Risk and volatility simply can be defined as amount of motion.
In our Weekly Stock Studies, the very heart of our analysis boils down to measuring how much upward and downward motion has occurred. We refer to this as the best-case and worst-case analysis. The purpose of the analysis is to “try” and define risk and motion from a very practical real-world perspective.
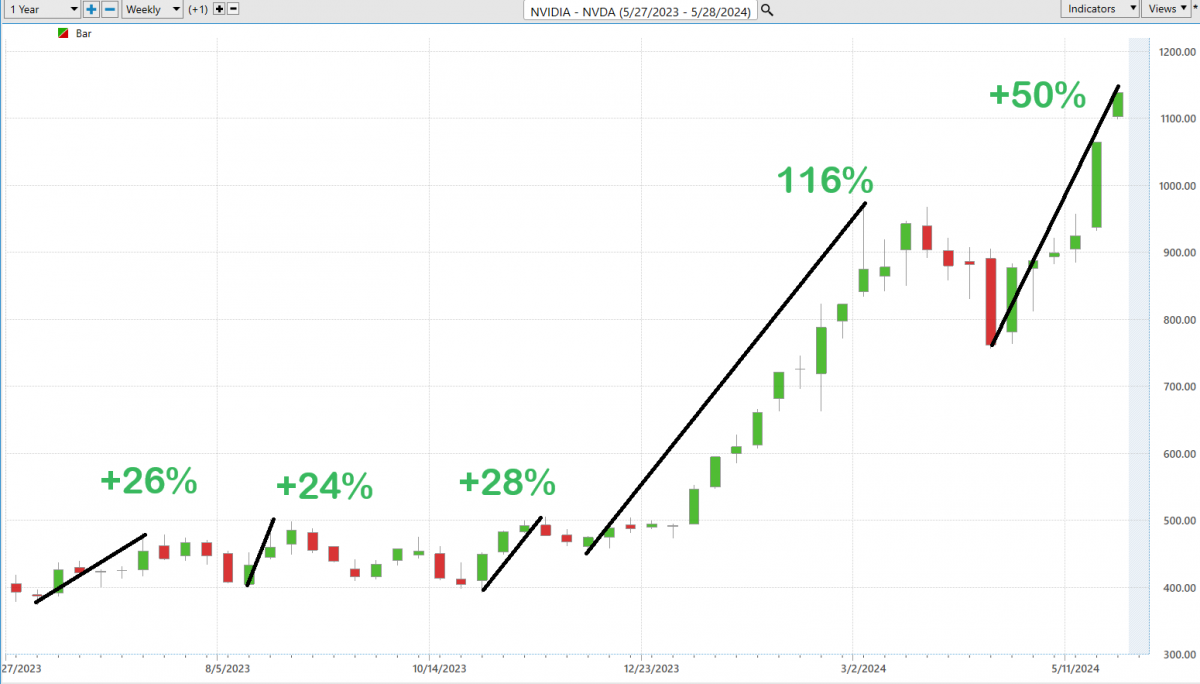
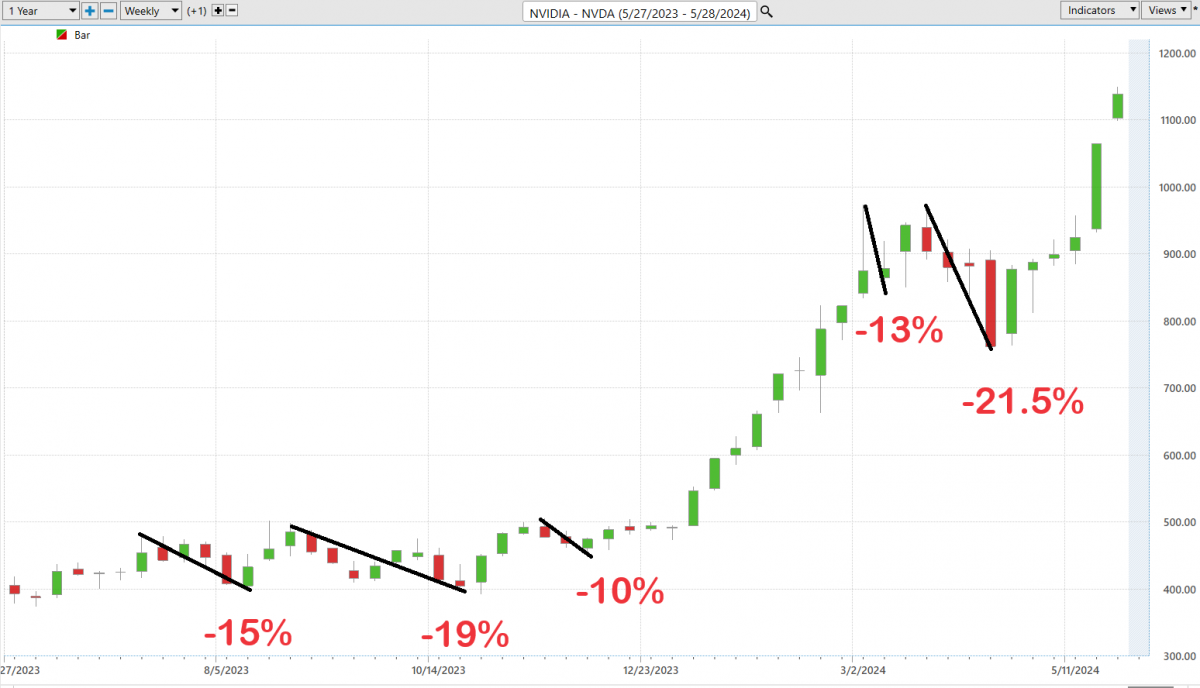
For example, here is what is considered normal for NVIDIA stock over the past year.
Firstly, let’s outline the best-case scenario which measures the strength of the uninterrupted rallies.
Next, we do the inverse and look at the worst-case scenario which measures the magnitude of the declines.
We do this practical exercise with every asset that we study to try and define normal.
What is the size of a normal uninterrupted rally?
What is the size of a normal uninterrupted decline?
We can learn vast amounts from this simple understanding. Over the past year, declines in $NVDA were very mild in comparison to the rallies. If you believed that the future was going to be the like the recent past you would certainly look for similar levels of volatility to embrace opportunity moving forward. Any decline of 20% or more from its recent highs would have you studying the chart very closely looking for evidence that the down move was approaching extreme levels.
Recently $NVDA pulled back 34% from its all-time highs before rebounding. A trader who had been trying to define a normal decline would certainly been aware that the motion that had occurred was “not normal and excessive.”
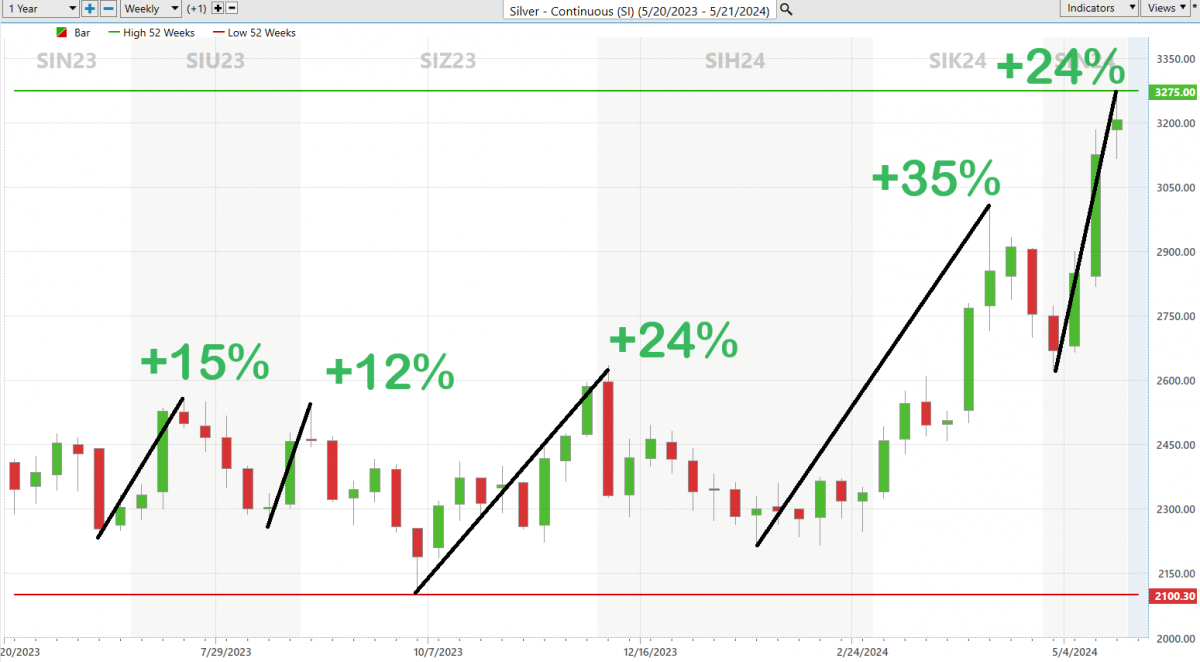
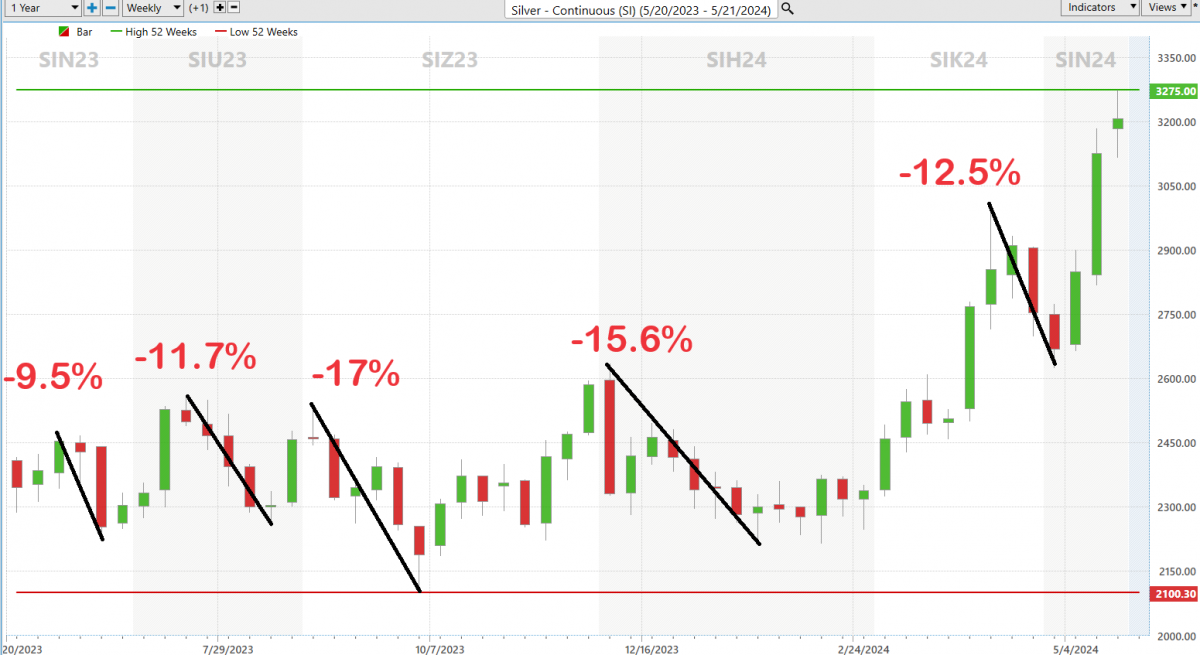
Here is another perspective on the Silver market. Observe how vastly different the levels of volatility are.
First the best-case scenario for silver over the past 52 weeks.
Followed by the worst-case scenario for Silver over the same time frame:
A great trader approaches the concept of risk and opportunity with the understanding that “normal” is not a static benchmark but a dynamic one, continuously shaped by ongoing market conditions and historical data.
In SIlver we had declines of between 10% to 17%. Rallies ranged from 12% to 35%.
This practical understanding is invaluable in determining how long you want to be in the market.
Imagine you are driving your car on the interstate. The speed limit is 70 miles per hour. That is the driving definition of normal. But you observe several drivers driving over 100 mph and even a handful of cars driving less than 40 miles per hour. Both of those outliers are considered risky for different reasons.
In trading. great traders recognize that what constitutes a “normal” move in the market will change as volatility and market conditions evolve. Traders constantly reassess what are “normal” expectations of price performance by analyzing trends, momentum indicators, and the frequency of price reaching new highs or lows. This ongoing evaluation aids in setting realistic targets and stop-loss points based on current market behavior rather than static historical averages.
Let me elaborate on this a little further.
Every asset that trades has a historical volatility which I refer to as common sense metrics. The way you can assess what the market is telling you about the future is simply look at the trading range for the asset you are studying over the past year. For example, if the 52-week high is $100 and the 52-week low is $60 the annual trading range is $40. If the stock is trading at $80 right now, that annual trading range of $40 is telling you loud and clear that the historical volatility is 50%. Simply divide the annual trading range by the current price to give you a very meaningful estimate of expected motion over the next 52 weeks.
The higher the annual trading range as a percentage the greater the volatility we can expect from an asset moving forward.
Traders who grasp the fluid nature of normalcy can identify opportunities that others might miss. They understand that an unusually large move based on current volatility could signal a potential trend change or a significant event, providing a strategic entry or exit point.
Traders plan their trades by considering possible deviations from normal movements. They ask questions like, “If the market moves beyond what is currently considered normal, what would be my response?” This prepares them to act swiftly and decisively.
In essence, great traders navigate the markets by maintaining a flexible outlook on what is considered normal, constantly updating their strategies in response to shifting market dynamics. This approach enables them to manage risks more effectively and capitalize on opportunities that arise from unexpected changes in market behavior.
Another very popular framework which I use regularly is I apply multi-time frame analysis to numerous popular assets to determine who is the fastest horse in the race. There are literally tens of thousands of potential trading opportunities that exist at any given moment. Whenever I discover that I am riding a dead horse, the best strategy is probably to dismount.
Let me explain. Here is a multi-time frame analysis comparing the performance of Gold, Bitcoin and the S&P 500 going out 10 years.
The performance tells the entire story far better than I could ever put into words.

Whenever I do this simple analysis, I find questions for further research. It’s fascinating to me how Gold is outperforming the stock market across the shorter time frames.
What I have outlined in this article so far are the important questions that lead to understanding market price action, understanding trends and minimizing risk. These methods are all very practical. I highly recommend you do this for any asset you are looking to trade.
In stock trading, the practice of multi-time frame analysis stands out as a critical tool for discerning traders. By evaluating a stock’s performance across annual, quarterly, monthly, and weekly intervals, and juxtaposing it against broader market indices, an investor gains a precise understanding of the stock’s volatility relative to the market at large. This method transcends mere number-crunching; it serves as a clear, narrative-free lens through which the relative success or failure of a stock is discerned—stripped of excuses, narratives, or the often-subjective interpretations of Wall Street analysts. Indeed, employing a multi-time frame analysis not only highlights the volatility and performance of a stock but also clearly highlights the market leaders and laggards, presenting a factual, unvarnished tableau of the market.
The only problem with these methods is that they can be very time-consuming to do manually.
This is why artificial intelligence trading software is vital for tackling today’s markets. The purpose of artificial intelligence is to keep you as a trader on the right side, of the right trend, at the right time.
In the relentless pursuit of excellence in trading, the fundamental objective remains: to outperform the broader market indices. This necessitates a discerning eye for assets that consistently demonstrate superior performance metrics compared to their peers.
Leveraging the cutting-edge capabilities of artificial intelligence, tools like VantagePoint’s Intelliscan have become indispensable. These powerful resources equip the astute Power Traders with the ability to pinpoint both burgeoning opportunities and fading prospects daily.
Success in these fiercely competitive markets hinges crucially on the arsenal at one’s disposal. The question becomes: How swiftly can you identify the strongest and weakest trends to capitalize on?
Are you aware of which stocks are decisively outpacing the broader market?
Let’s address the reality unflinchingly:
The market is brutally honest. It separates the winners from the losers every day.
It operates in clear-cut terms.
It’s very black and white.
If you need a friend, get a dog.
If you are going to win, someone else must lose.
If survival of the fittest makes you uneasy, stay out of the financial markets.
Alright, let’s cut through the fluff and get to the meat of why artificial intelligence (AI) trading software is reshaping the trading landscape like a hurricane tearing through a coastal town. A.I. is the ultimate feedback loop champion, learning tirelessly what bombs and then smartly sidestepping those landmines to march towards victory. This isn’t just neat; it’s the backbone of how the most successful traders I’ve ever rubbed shoulders with build their empires.
Now, chew on this: A.I. is like the world’s best mistake-avoidance system, running at full throttle 24/7, every single day of the year, finding what works and ditching what doesn’t. This should have you sitting up in your chair because it’s a game-changer, my friend.
Sounds simple, right? Yet, it’s this simple stuff that so many traders blissfully ignore, and guess what? Their portfolios bleed for it. It’s downright tragic—and utterly unnecessary with the kind of tech we’ve got at our fingertips today.
Consider this: a stock can have the sexiest story, a rock-star management team, jaw-dropping earnings, and more bells and whistles than a New Year’s parade. But if none of that sizzle is baked into the stock price, you’re just daydreaming about what “should” happen. And let me tell you, “should” is the most expensive word in a trader’s vocabulary.
The worst traders are stuck in “Should-ville.” Every other word they spit is about what “should” happen. Ever listened to a trader moaning about why they’re heavy on a plummeting stock because of some tantalizing tale? It’s like listening to a heartbreak song on repeat—painful and utterly avoidable.
Listen up, because here’s a cold, hard truth: most folks can’t learn from their screw-ups.
Why? That pesky ego always steps in the way.
But here’s a kicker: A.I. has whipped human butt in every brain game out there—Poker, Chess, Jeopardy, Go. Think trading’s gonna be any different?
What A.I. brings to the table isn’t just knowledge—it’s the kind of gold you can actually use.
Curious? You ought to be. Why not join us for a FREE Live Training ?
We’re not just blowing smoke here; we’ll show you three stocks that A.I. has pegged for big moves. And remember, in the trading world, any movement spells opportunity.
Get the scoop on why the sharpest traders are betting big on artificial intelligence for lower risks, higher rewards, and, yes, some sweet peace of mind.
Intrigued yet? Drop by our next Live Training to see this A.I. wizardry in action .
It’s not magic, folks. It’s machine learning.
So, make it count.
THERE IS A SUBSTANTIAL RISK OF LOSS ASSOCIATED WITH TRADING. ONLY RISK CAPITAL SHOULD BE USED TO TRADE. TRADING STOCKS, FUTURES, OPTIONS, FOREX, AND ETFs IS NOT SUITABLE FOR EVERYONE.IMPORTANT NOTICE!
DISCLAIMER: STOCKS, FUTURES, OPTIONS, ETFs AND CURRENCY TRADING ALL HAVE LARGE POTENTIAL REWARDS, BUT THEY ALSO HAVE LARGE POTENTIAL RISK. YOU MUST BE AWARE OF THE RISKS AND BE WILLING TO ACCEPT THEM IN ORDER TO INVEST IN THESE MARKETS. DON’T TRADE WITH MONEY YOU CAN’T AFFORD TO LOSE. THIS ARTICLE AND WEBSITE IS NEITHER A SOLICITATION NOR AN OFFER TO BUY/SELL FUTURES, OPTIONS, STOCKS, OR CURRENCIES. NO REPRESENTATION IS BEING MADE THAT ANY ACCOUNT WILL OR IS LIKELY TO ACHIEVE PROFITS OR LOSSES SIMILAR TO THOSE DISCUSSED ON THIS ARTICLE OR WEBSITE. THE PAST PERFORMANCE OF ANY TRADING SYSTEM OR METHODOLOGY IS NOT NECESSARILY INDICATIVE OF FUTURE RESULTS. CFTC RULE 4.41 – HYPOTHETICAL OR SIMULATED PERFORMANCE RESULTS HAVE CERTAIN LIMITATIONS. UNLIKE AN ACTUAL PERFORMANCE RECORD, SIMULATED RESULTS DO NOT REPRESENT ACTUAL TRADING. ALSO, SINCE THE TRADES HAVE NOT BEEN EXECUTED, THE RESULTS MAY HAVE UNDER-OR-OVER COMPENSATED FOR THE IMPACT, IF ANY, OF CERTAIN MARKET FACTORS, SUCH AS LACK OF LIQUIDITY. SIMULATED TRADING PROGRAMS IN GENERAL ARE ALSO SUBJECT TO THE FACT THAT THEY ARE DESIGNED WITH THE BENEFIT OF HINDSIGHT. NO REPRESENTATION IS BEING MADE THAT ANY ACCOUNT WILL OR IS LIKELY TO ACHIEVE PROFIT OR LOSSES SIMILAR TO THOSE SHOWN.

