Trading can be both incredibly hard and surprisingly simple, depending on one’s level of awareness. The difficulty lies in the constant bombardment of market noise, emotions, and the sheer amount of data, which can overwhelm even the most seasoned traders. Many traders get caught up in the complexities of technical indicators, economic reports, and market predictions, leading to analysis paralysis and costly mistakes. On the other hand, trading becomes remarkably simple when a trader cultivates the right kind of awareness. This awareness involves understanding when markets are trending and have a clear bias, recognizing when they lack direction and are range-bound, and most critically, listening to the voice of volume. Volume often speaks the loudest, signaling when something significant is happening beneath the surface. By developing an acute sense of awareness, traders can cut through the noise, focus on the key signals, and make more informed, confident trading decisions. Awareness, therefore, is not just a tool—it is the most powerful and essential characteristic for success in both trading and life.
Volume analysis offers traders profound insights that price action alone cannot provide. One of the key insights is the confirmation of price trends. When a price movement is accompanied by high trading volume, it signals strong market conviction, suggesting the trend is likely to continue. Conversely, price moves on low volume may indicate a lack of conviction, often warning traders that a trend may be weak or unsustainable. High volume at market tops or bottoms can also signal reversals, as it often indicates a climax where buying or selling pressure has peaked, followed by a potential shift in direction. Thus, by analyzing volume, traders gain a deeper understanding of the true strength and sustainability of market movements.
Throughout history, many great traders have relied heavily on volume analysis to inform their trading decisions. One such trader is Richard Wyckoff, a pioneer of technical analysis who developed the Wyckoff Method , which emphasized the importance of volume in understanding market behavior. Wyckoff taught that volume patterns could reveal the intentions of large institutional traders and that discerning these patterns could provide an edge. Another notable figure is Paul Tudor Jones, a hedge fund manager who famously used volume analysis to predict and profit from the 1987 stock market crash. These traders understood that volume is the lifeblood of the market, and by focusing on it, they could align themselves with the market’s underlying forces.
Technical indicators such as the Market Profile by Peter Steidlmayer and On-Balance Volume (OBV) by Joseph Granville offer traders practical tools to incorporate volume analysis into their strategies.
Market Profile organizes price and volume data into a distribution graph, revealing where the majority of trading has occurred at specific price levels. This helps traders identify areas of high activity, known as value areas, and potential support and resistance zones. Every day, week, month, quarter, and year, the market sets up a trading range for that specific time frame, along with a value area where most of the action happens. This value zone is like the battleground between buyers and sellers, the sweet spot where supply and demand find their balance. Think of the market profile as a bell curve, with this value area marking the point where around 70% of the trading takes place.
The following graphic is a solid and realistic representation of what Market Profile tries to accomplish on whatever time frame you are trying to analyze.
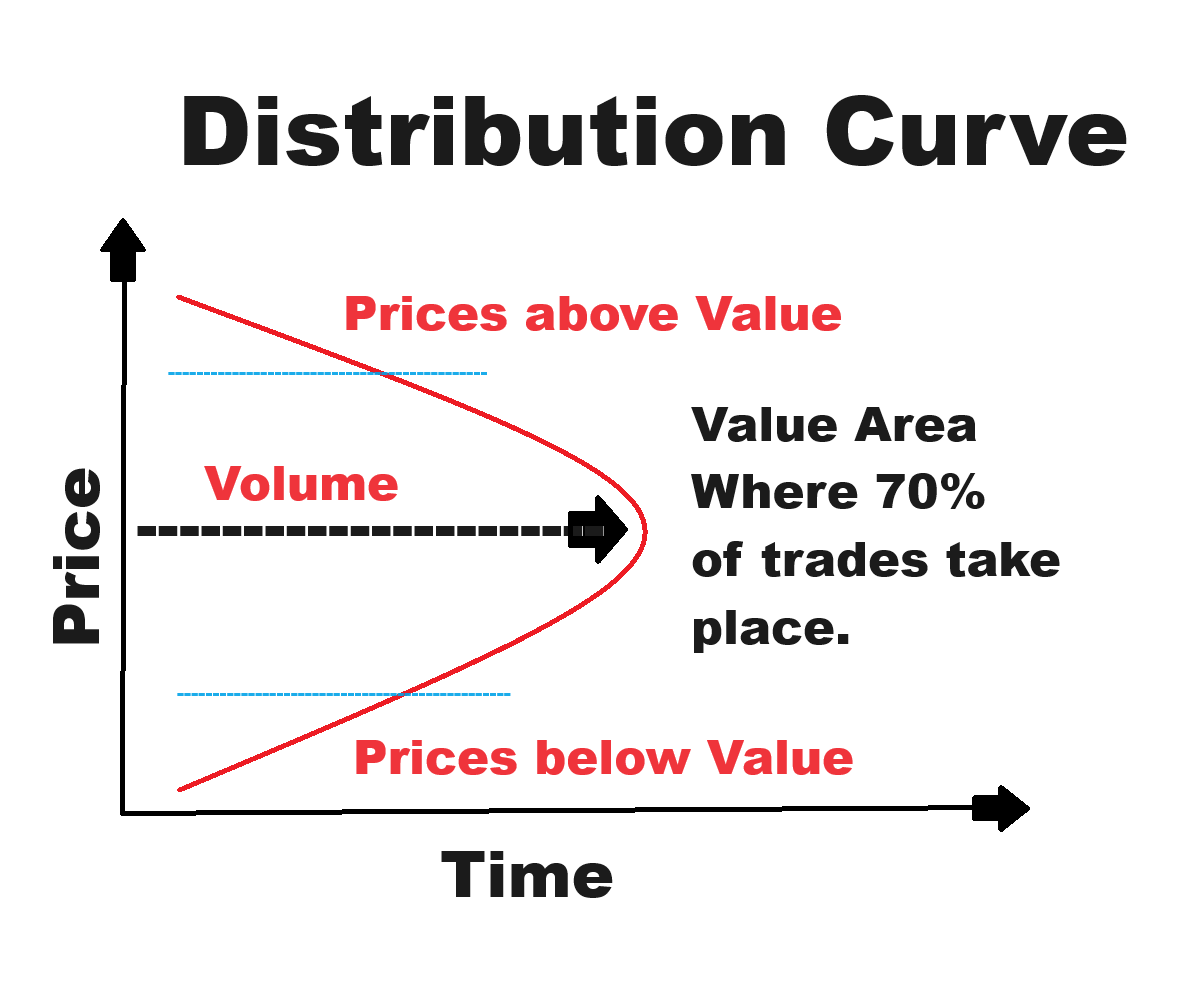
Now, here’s the kicker: volume is the secret sauce that makes sense of the market profile. When prices drift away from this equilibrium point and volume starts to fade, it’s usually a red flag that the market will snap back into its value zone. It’s like a rubber band stretching—eventually, it’s going to spring back to where it belongs.
But, if we see prices breaking out of their comfort zone on heavy volume, that’s a whole different ball game. This signals that traders are rethinking what the current value should be, a clear shift in market sentiment. When big money starts pushing prices away from equilibrium with conviction, you better believe something big is brewing.
On-Balance Volume, on the other hand, is a cumulative indicator that adds or subtracts volume based on price movements, offering insights into whether volume is flowing in or out of a security. When OBV trends upward, it suggests accumulation and buying pressure, while a downward trend indicates distribution and selling pressure. Both tools provide traders with a clearer picture of market dynamics, helping them to make more informed decisions by focusing on the volume-driven aspects of trading.
On-Balance Volume (OBV) is a simple yet powerful momentum indicator that measures buying and selling pressure by adding or subtracting volume based on price movements. The calculation is straightforward: if the closing price of a security is higher than the previous close, the day’s volume is added to the OBV total. Conversely, if the closing price is lower, the volume is subtracted. This running total creates a cumulative volume line that reflects the flow of volume into and out of a security, providing insight into the underlying strength or weakness of a price trend.
Traders use OBV to confirm trends and anticipate potential reversals. A rising OBV line indicates that volume is heavier on days when prices are up, suggesting strong buying interest, which can be a bullish signal. Conversely, a falling OBV line shows that volume is greater on down days, indicating selling pressure and a bearish outlook. Divergences between OBV and price can also be telling: if prices are rising but OBV is flat or falling, it may signal that the rally lacks conviction and could be due for a reversal. In this way, OBV helps traders make more informed decisions by providing a deeper look at market sentiment beyond price alone.
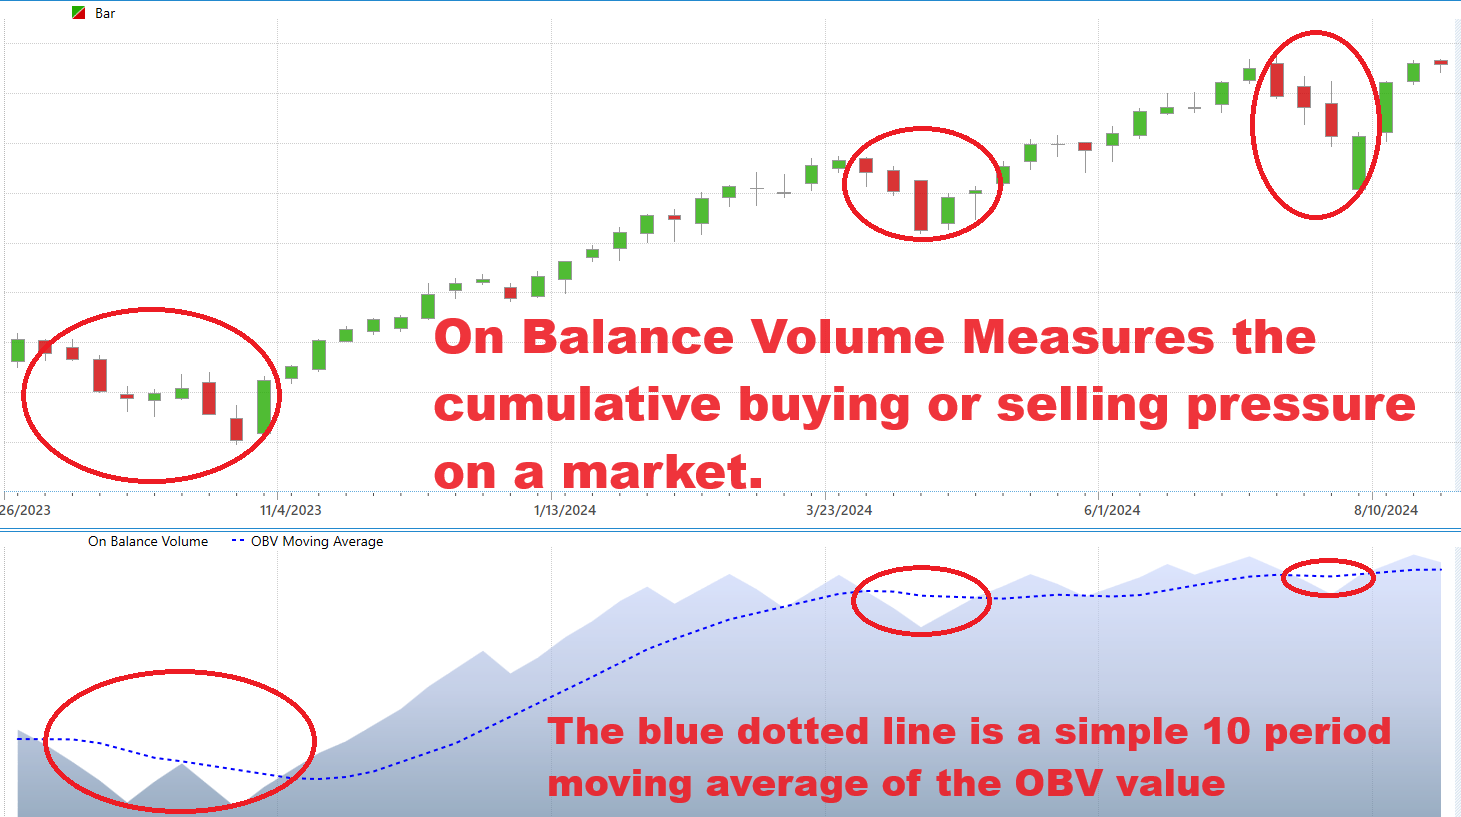
On-Balance Volume, or OBV, is a powerful tool that gauges the pulse of the market by measuring buying and selling pressure. It’s a cumulative indicator that tells the story of market sentiment: on days when a stock closes higher than its previous close, all of the day’s volume is added to the OBV. This signifies buying strength. On the flip side, when the stock closes lower, all of that day’s volume is subtracted, reflecting selling pressure. It’s a straightforward yet insightful way to see where the market’s conviction truly lies.
When someone says, “volume precedes price,” they’re highlighting the crucial role that trading volume plays as a leading indicator in the markets. Before a significant price move can occur, there must be a noticeable shift in volume. If you expect prices to go higher, it’s not just a matter of wishful thinking; someone, somewhere, has to be buying that asset to back up that belief. This increased buying interest is reflected in rising volume levels, which can often be observed before the actual price move materializes. By paying attention to these volume shifts, traders can anticipate and position themselves ahead of major price movements.
The same principle applies in reverse. If the market is poised for a downturn, volume will likely surge as selling pressure builds up, signaling that traders are starting to offload their positions. By monitoring volume and understanding what constitutes normal trading levels, traders can identify these extremes where the market is potentially overbought or oversold. These extremes are where analytical tools become most valuable, allowing traders to gain an edge by recognizing early signs of a trend reversal or continuation. In essence, volume analysis acts like a radar, picking up signals that price alone might miss, guiding traders to more informed decisions.
Let me bring this concept to life with a real-world example which occurred recently in the markets. I am referring to Vector Group ($VGR).
First let’s look at the chart as $VGR was making 52-week lows on May 2, 2024, at a price of $9.28.
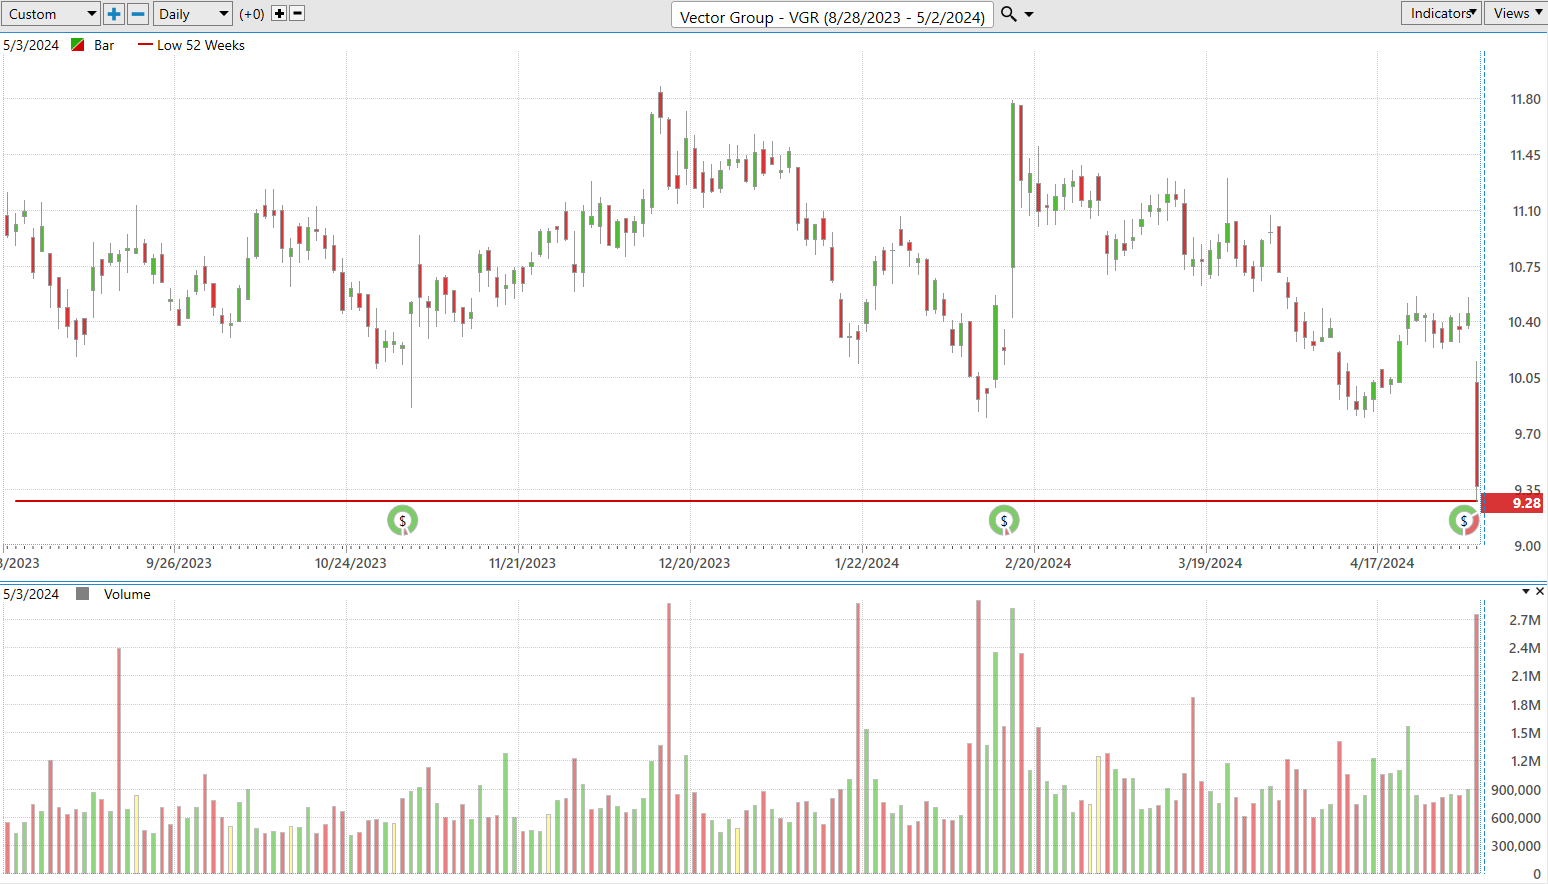
You can see that for the entire previous year this stock has been in consolidation. A very straightforward pattern. However, as it was making new 52-week lows volume spiked heavier than normal. Traditionally this is a warning sign. But there was no follow through to the downside. As a matter of fact, price rebounded nicely and rebounded 15% in the following 2 weeks.
A trader who was aware of this would certainly place $VGR on their radar and start trying to figure out what was occurring in the stock.
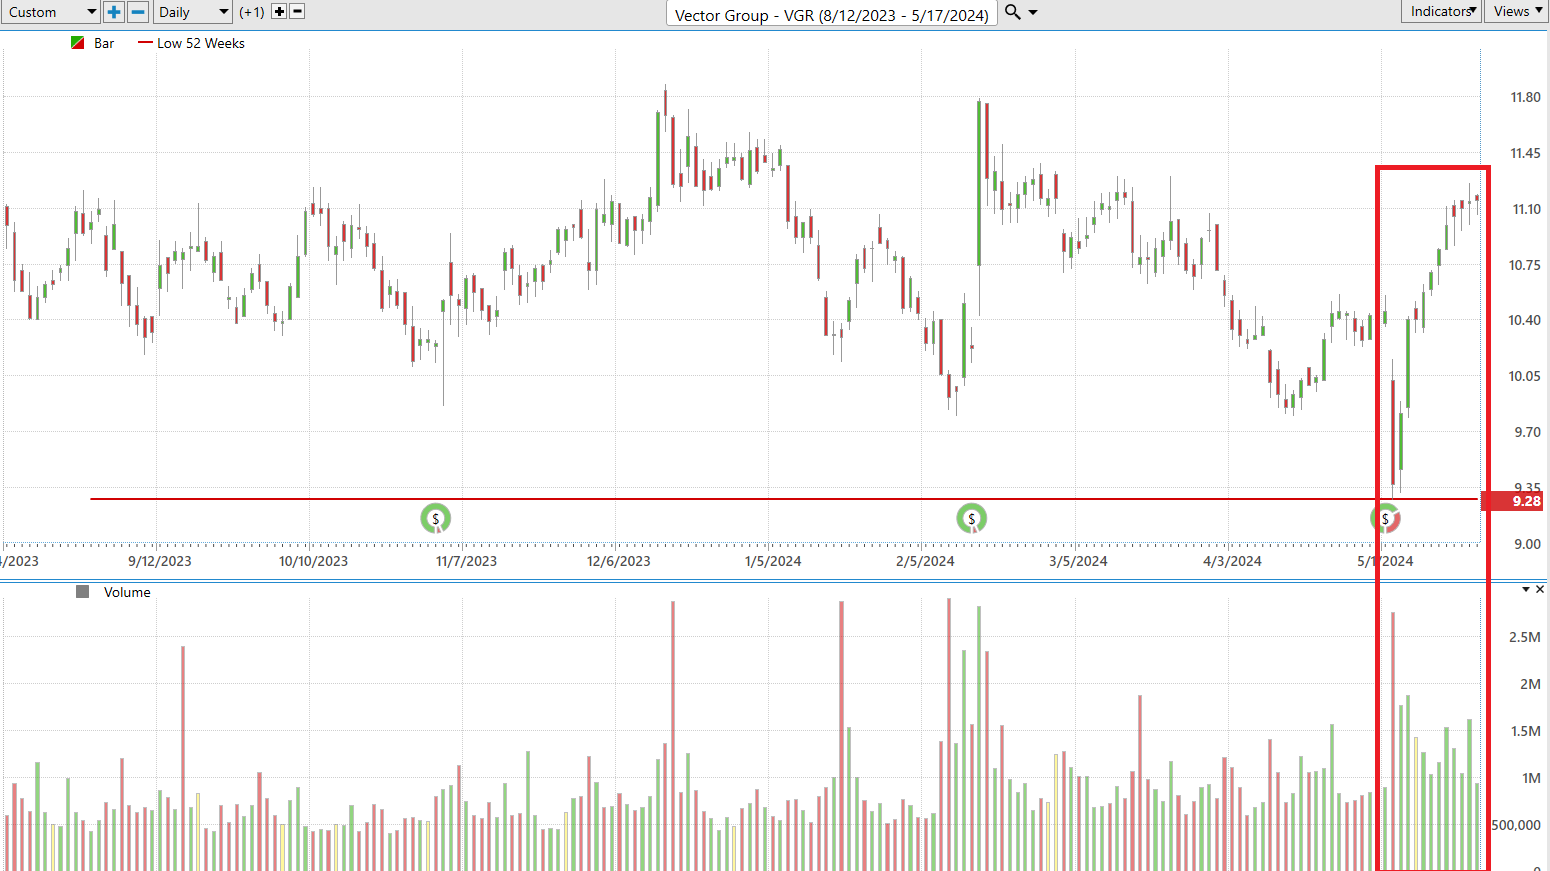
Whenever a stock makes a new 52-week low on heavy volume and immediately reverses course it is an indication that “smart money” was buying. We don’t know why. But we always advise traders to pay very close attention to the 52-week lows and highs to find trading candidates that offer real value.
High trading volume typically indicates strong investor interest and can signify the strength of a price move. When volume spikes alongside price movements, it suggests that the trend has strong support and is more likely to continue. High volume during price rallies or declines shows that there is a significant participation by traders, often confirming the direction of the move.
Low trading volume indicates a lack of interest or participation, often signaling uncertainty or a lack of conviction in the market. During periods of low volume, price movements may be more erratic and less reliable. A low-volume price rally or decline may lack the strength to sustain the move, indicating potential for reversal or stagnation.
When someone says, “volume precedes price,” they’re highlighting the crucial role that trading volume plays as a leading indicator in the markets. Before a significant price move can occur, there must be a noticeable shift in volume. If you expect prices to go higher, it’s not just a matter of wishful thinking; someone, somewhere, has to be buying that asset to back up that belief. This increased buying interest is reflected in rising volume levels, which can often be observed before the actual price move materializes. By paying attention to these volume shifts, traders can anticipate and position themselves ahead of major price movements.
The same principle applies in reverse. If the market is poised for a downturn, volume will likely surge as selling pressure builds up, signaling that traders are starting to offload their positions. By monitoring volume and understanding what constitutes normal trading levels, traders can identify these extremes where the market is potentially overbought or oversold. These extremes are where analytical tools become most valuable, allowing traders to gain an edge by recognizing early signs of a trend reversal or continuation. In essence, volume analysis acts like a radar, picking up signals that price alone might miss, guiding traders to more informed decisions.
The statement “volume drives price” reflects the idea that significant price movements require the backing of strong volume. A large number of buyers or sellers is needed to push prices higher or lower. When there is significant volume behind a price move, it indicates that a large number of market participants agree on the direction, adding validity and strength to the price change.
By paying attention to volume, traders can better understand market sentiment, validate price trends, and identify potential reversals or continuations, making it a critical tool for better trading and investing.
Now let me draw your attention to the Vector Group ($VGR) chart as of June 21, 2024. Pay close attention to the volume spike at the bottom of the chart.
- Volume on June 21, 2024, spiked 8.5x its normal level.
- Price was still well below its 52-week highs.
- Somebody was HEAVILY purchasing $VGR.
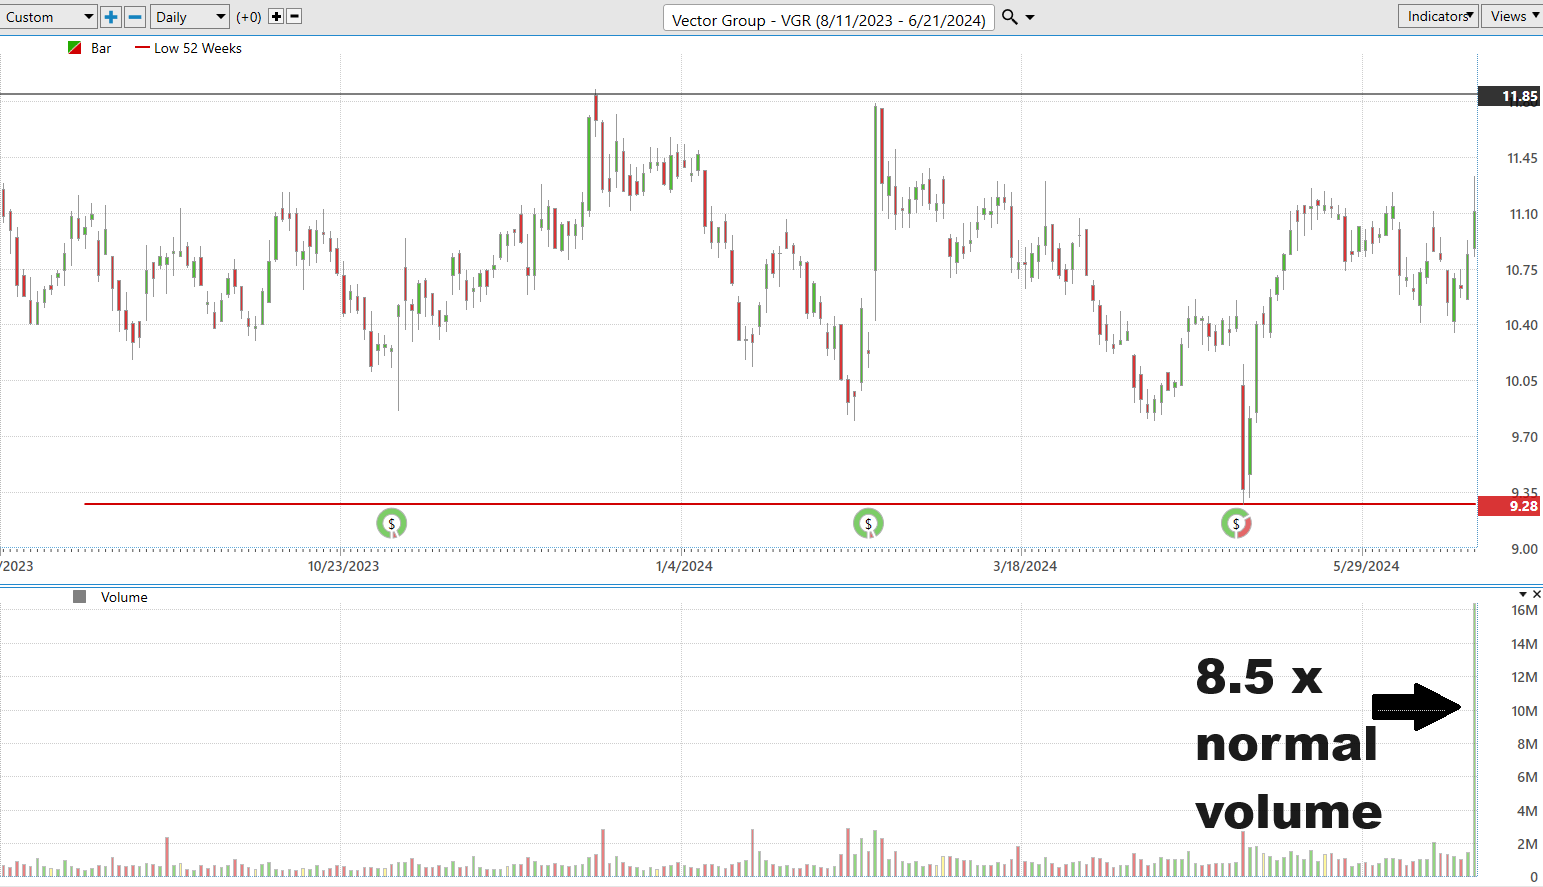
The idea when trading and analyzing volume is to essentially try and follow the smart money. Significant price movements on high volume are seen as more credible and sustainable than those occurring on low volume. It indicates strong participation and commitment to the direction of the move.
Now watch the price action on $VGR over the last 8 weeks.
Prices broke through the old 52 week high convincingly at $11.85 and rallied another $3.68 or 31% in a period of 4 weeks.
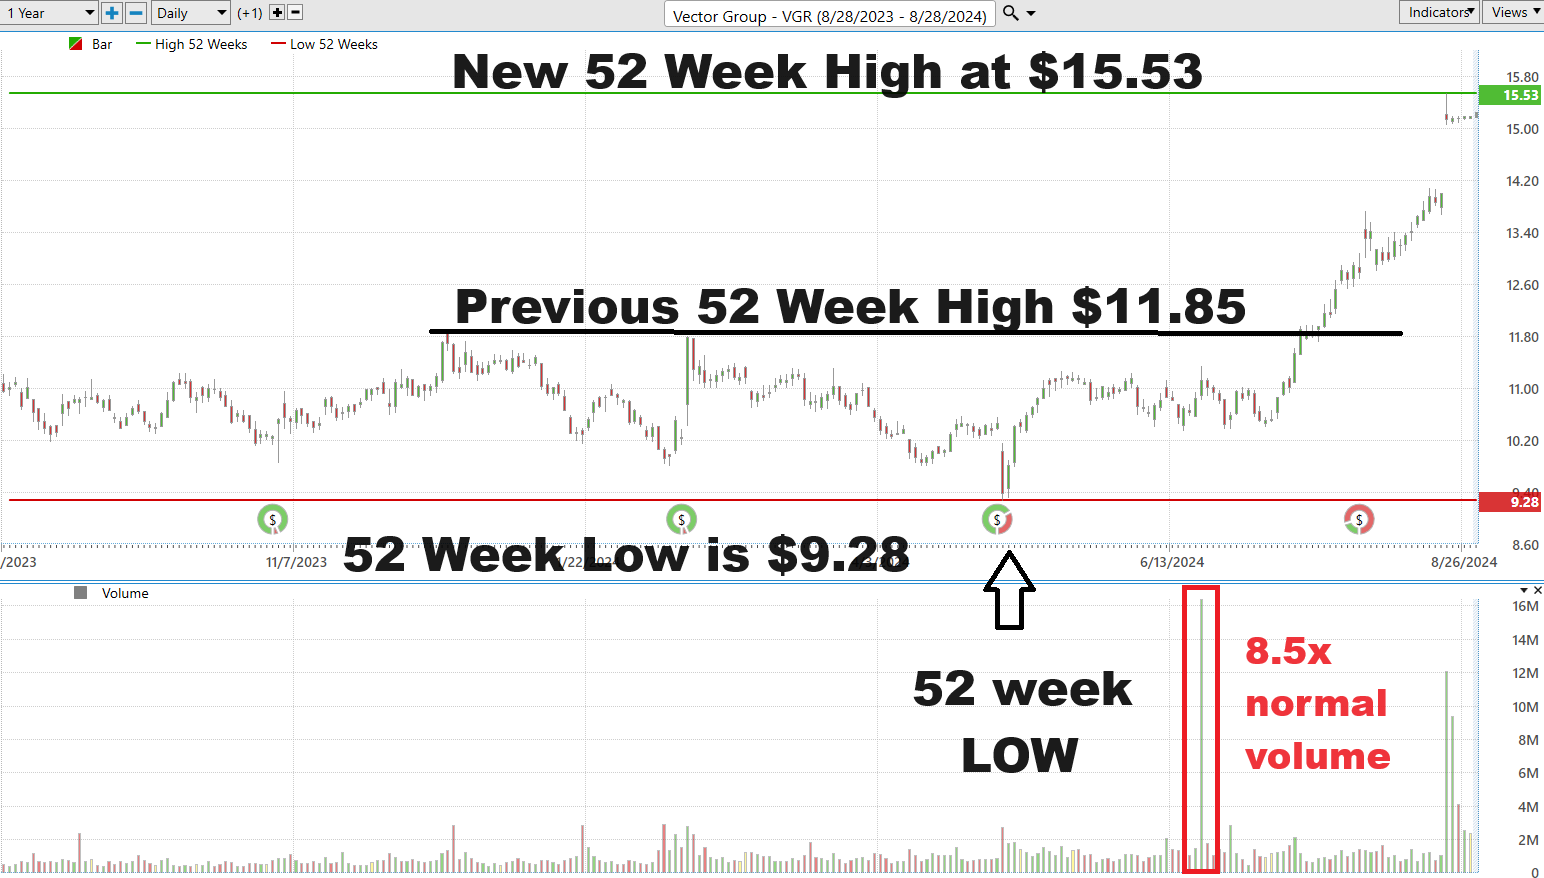
Why did this move occur?
It was recently announced that JT Group, also known as Japan Tobacco Inc., a global company that operates in the tobacco, pharmaceutical, and processed food industries. Recently, JT Group reached an agreement to acquire Vector Group Ltd. (VGR). The acquisition deal is valued at approximately $2.4 billion, and JT Group will pay $15.00 per share for Vector Group’s common stock, representing a significant premium over the recent trading price.
Tracking volume for trading is akin to a hunter stalking its prey through the wilderness, following subtle signs and clues that reveal the target’s direction. Just as a hunter interprets footprints, broken branches, and other traces to predict the movement of an animal, traders watch volume closely to gain insights into market behavior. Volume is the footprint of market participants; it tells the story of buying and selling activity, often before price changes become apparent. By analyzing volume patterns, traders can anticipate potential moves, identify the strength of a trend, and position themselves accordingly, much like a hunter anticipates the next move of their prey.
Moreover, volume provides confirmation of price trends, acting as a signal that a move is genuine and not just a false breakout or a fleeting anomaly. For instance, when a price moves higher on increasing volume, it suggests that the rally has strong support from traders, similar to a hunter spotting fresh, clear tracks indicating they are on the right path. Conversely, if price moves without corresponding volume, it might be a sign of weakness or a lack of conviction, much like following old or unclear tracks in the wild. In this way, volume is a crucial tool in a trader’s arsenal, helping them to navigate the complexities of the market with the precision of a skilled hunter.
What makes $VGR a fascinating study in volume is how black and white the movements were in this instance. $VGR traded sideways for the previous year.
Volume is an invaluable tool for analyzing market trends, and there are numerous ways to leverage it effectively. By adhering to certain guidelines, traders can gauge the strength or weakness of the market, determining whether volume supports a price movement or hints at an impending reversal. Indicators based on volume, such as On-Balance Volume (OBV) and, can provide additional layers of insight during the decision-making process. While volume analysis may not offer pinpoint accuracy, it can often help identify key entry and exit points by examining the interplay between price action and volume indicators. In essence, volume serves as a critical, albeit nuanced, lens through which the underlying dynamics of market activity can be interpreted.
Want to learn more? This is how the VantagePoint Artificial Intelligence called the recent move in $VGR. An Up-market forecast was generated on July 11, 2024, at a price of $10.85.
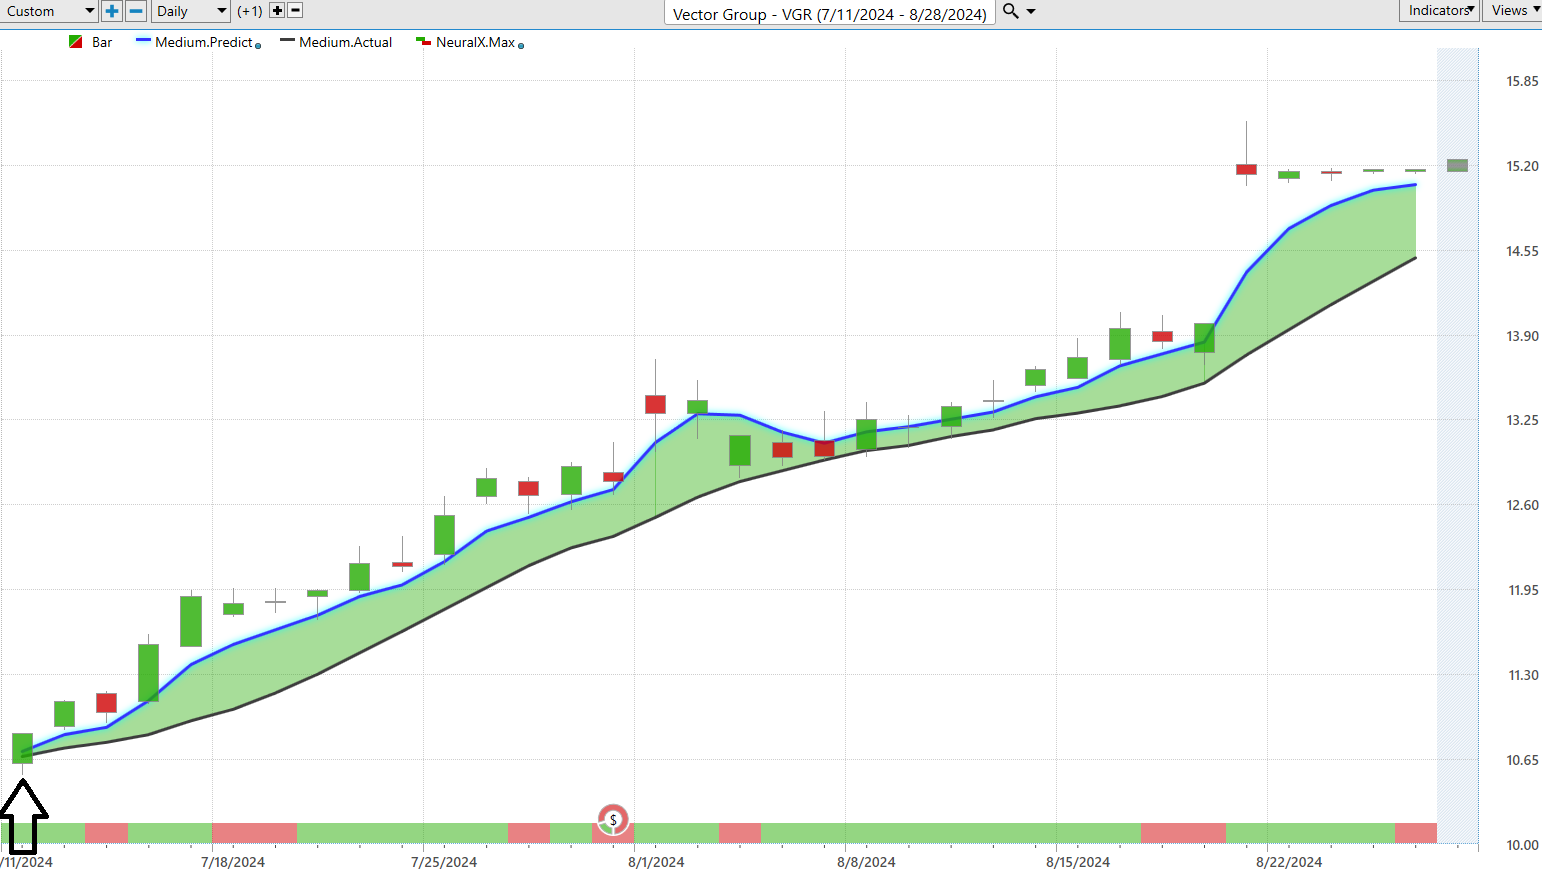
Picture this: being on the right side of the right trend at exactly the right moment. That’s the kind of edge you need to thrive in today’s cutthroat trading arena. And let’s face it, in this world where only the sharpest minds prevail, hesitation isn’t just costly—it’s lethal.
To not only survive but to dominate this high-stakes, winner-takes-all game, you need more than just intuition. You need to wield the power of cutting-edge technology and razor-sharp trend analysis.
Enter Artificial Intelligence trading software , your ultimate secret weapon. Why? Because AI doesn’t just learn from its mistakes—it remembers them, refines its strategies, and charts new courses to victory. This relentless Feedback Loop is the secret sauce behind every fortune-making trader I’ve met. It’s about outthinking, outmaneuvering, and outsmarting the market with unwavering precision and adaptability. With AI by your side, you’re not just trading—you’re conquering.
The purpose of A.I. in your trading corner is to keep you on the right side, of the right trend at the right time.
Visit With US and check out the A.I. at our Next Free Live Training.
Let’s Be Careful Out There!
It’s Not Magic.
It’s Machine Learning.
THERE IS A SUBSTANTIAL RISK OF LOSS ASSOCIATED WITH TRADING. ONLY RISK CAPITAL SHOULD BE USED TO TRADE. TRADING STOCKS, FUTURES, OPTIONS, FOREX, AND ETFs IS NOT SUITABLE FOR EVERYONE.IMPORTANT NOTICE!
DISCLAIMER: STOCKS, FUTURES, OPTIONS, ETFs AND CURRENCY TRADING ALL HAVE LARGE POTENTIAL REWARDS, BUT THEY ALSO HAVE LARGE POTENTIAL RISK. YOU MUST BE AWARE OF THE RISKS AND BE WILLING TO ACCEPT THEM IN ORDER TO INVEST IN THESE MARKETS. DON’T TRADE WITH MONEY YOU CAN’T AFFORD TO LOSE. THIS ARTICLE AND WEBSITE IS NEITHER A SOLICITATION NOR AN OFFER TO BUY/SELL FUTURES, OPTIONS, STOCKS, OR CURRENCIES. NO REPRESENTATION IS BEING MADE THAT ANY ACCOUNT WILL OR IS LIKELY TO ACHIEVE PROFITS OR LOSSES SIMILAR TO THOSE DISCUSSED ON THIS ARTICLE OR WEBSITE. THE PAST PERFORMANCE OF ANY TRADING SYSTEM OR METHODOLOGY IS NOT NECESSARILY INDICATIVE OF FUTURE RESULTS. CFTC RULE 4.41 – HYPOTHETICAL OR SIMULATED PERFORMANCE RESULTS HAVE CERTAIN LIMITATIONS. UNLIKE AN ACTUAL PERFORMANCE RECORD, SIMULATED RESULTS DO NOT REPRESENT ACTUAL TRADING. ALSO, SINCE THE TRADES HAVE NOT BEEN EXECUTED, THE RESULTS MAY HAVE UNDER-OR-OVER COMPENSATED FOR THE IMPACT, IF ANY, OF CERTAIN MARKET FACTORS, SUCH AS LACK OF LIQUIDITY. SIMULATED TRADING PROGRAMS IN GENERAL ARE ALSO SUBJECT TO THE FACT THAT THEY ARE DESIGNED WITH THE BENEFIT OF HINDSIGHT. NO REPRESENTATION IS BEING MADE THAT ANY ACCOUNT WILL OR IS LIKELY TO ACHIEVE PROFIT OR LOSSES SIMILAR TO THOSE SHOWN.

