Welcome to the Artificial Intelligence Outlook for Forex trading.
U.S. Dollar Index
Okay, hello everyone, and welcome back! My name is Greg Firman, and this is the Vantage Point AI Market Outlook for the week of September 30, 2024.
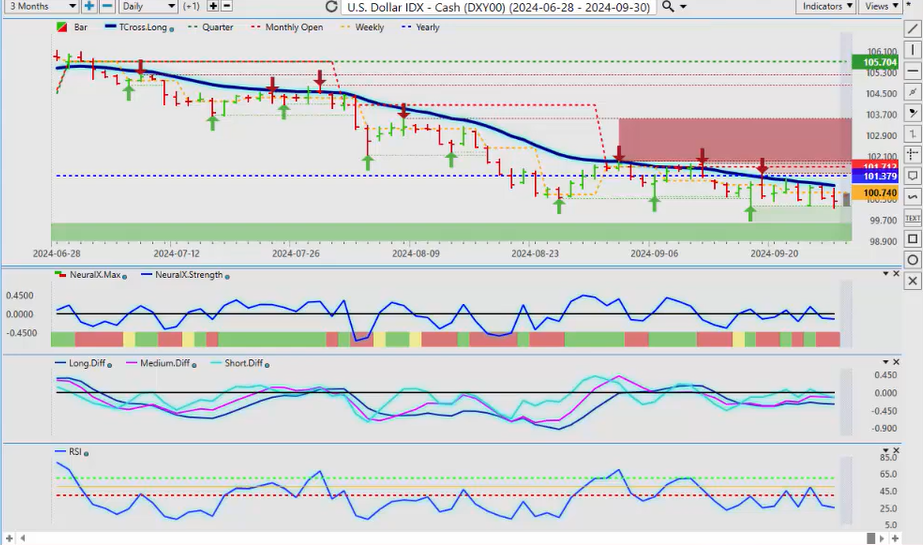
Now, to get started this week, we’ll begin where we always do with that very important US Dollar Index , where we have a very mixed signal here. Our MA diff cross, which is our medium-term strength, is rising against and has crossed over our long-term predicted difference, suggesting that the dollar is not quite done just yet. We’re going into a rather data-heavy week. We’ve got the ADP report, I think on Wednesday, then the non-farm payroll number on Friday. Now, if you get a slightly better number, that could change the Fed’s path, but it’s very unlikely. We are at 14-month lows on the Dollar Index , but again, the signals here from Vantage Point are somewhat flat. Our T cross long has been containing the market. We have crossed over the yearly opening price, but we do know either way that the dollar is likely to sell off on its seasonal pattern in October, after the first week of October or approximately October 5th or so. That’s usually it for dollar strength. You still have small periods where the dollar rises, but the overall primary trend remains heavily down.
With the Fed’s rhetoric of more cuts, that’s going to likely accelerate the move on the dollar, but I think we have one more bout of strength before we turn lower, and that’s what the indicators in VP are currently saying. Again, I think any retracement at this point will be back to our T cross long at 100.99 or our yearly opening at 101.37, which is likely to contain the market.
S&P 500 Index
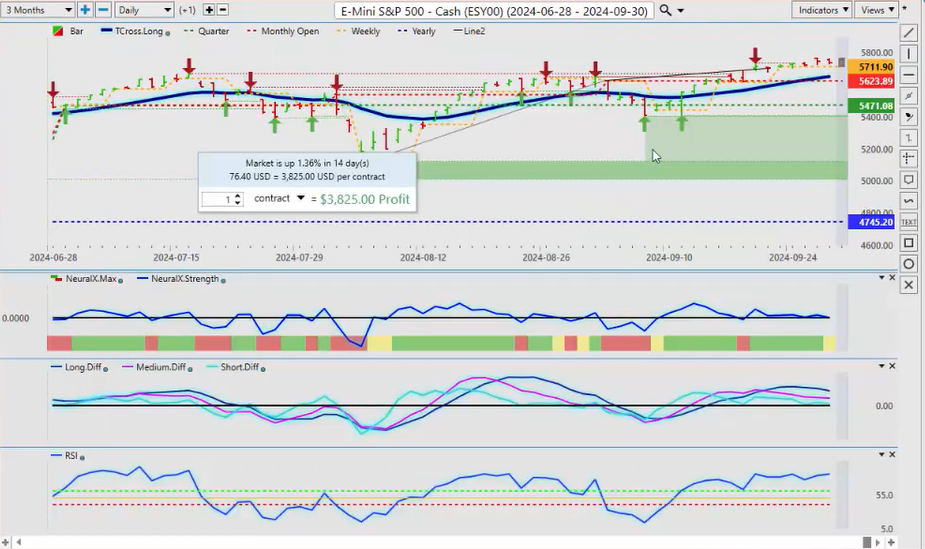
Now, when we look at the equity markets going into next week, the S&P 500 once again had a very slow week. When we look at that, we’ll do an accurate performance of the S&P 500 , which directly relates to our SPY, SPY ETFs, etc. The week was very soft at 0.49%. In the month of October, equities usually fare decently, but there is a lot of chatter about a recession in the US. I believe personally that they’re covering it up, and they’ve already falsified the jobs numbers, missing a million jobs over the last year. We’re in an election year also, so the information is not the best coming out of the media these days. For now, I believe we will come down to our T cross long, coming in at 5650 next week, and I further believe it can be challenged even lower than that.
Looking at the indicators, we have again an MA diff cross that has taken place on the S&P 500 around September 19th. We have not had any significant gains since then. Once we establish this, we see the medium-term trend weakening against the longer-term uptrend. We’re slightly overbought on the predicted RSI, but that’s not a determining factor—the MA diff could be.
Volatility Index ($VIX)
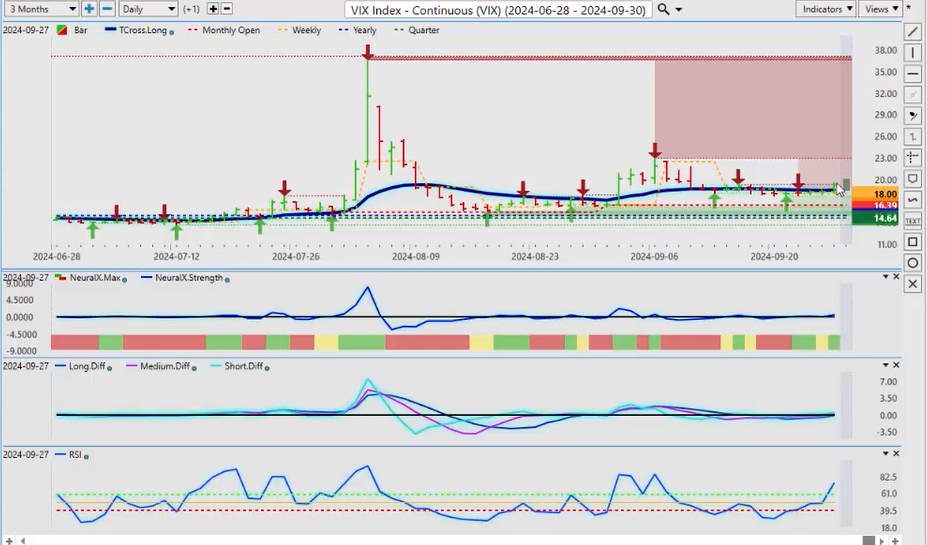
We also want to cross-reference this with the inverse correlated VIX . The VIX is gaining strength, now above the quarterly opening, monthly opening, yearly opening, and our T cross long at 18.53. This suggests that there will be less demand for options in the options market, and this is likely a warning sign that the major indices and several stocks are getting ready to move lower.
Right now, the predicted RSI has broken the 60 level, and momentum is building in the VIX . Again, nothing is 100%, but the idea is to get out in front of these things because this is an outlook, not a recap of something that took place last week. We’re forward-thinking into next week’s trading for the first week of October. To do that, we want to look at these signals and ask, “Should we be buying stocks, yes or no?” The VIX is giving us a clear warning sign that something based on the correlation to 31 other markets is a little off in this stock market rally.
Gold
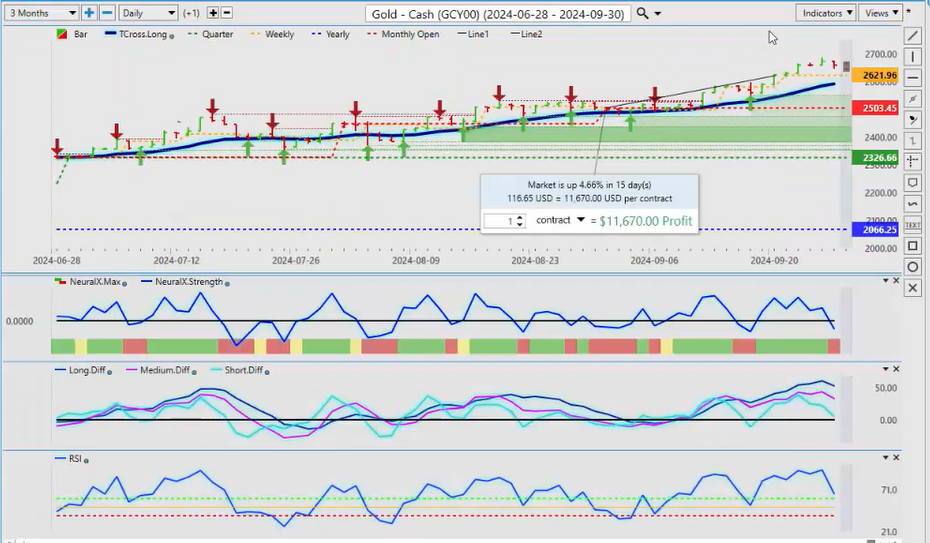
Now, when we look at Gold contracts, once again, Gold advanced higher last week. However, when we come into a week of non-farm payroll numbers, there’s going to be indecision in the market. In most cases, in the first week of the new month, Gold isn’t strong at all. So, I can anticipate a pullback to our T cross long at 25.90, and we can reassess at that time. The predictive indicators are pointing downward; we are losing momentum. Both our medium-term and long-term strength are sloping downward, and the predicted RSI took a hard drop on Friday. These are all warning signs— VIX , Gold , these are signs of potential dollar strength, which would be normal on real dollar demand in the first week of the new month. But to be clear, in most cases, that’s it for the Dollar for the calendar year, and the bulk of the trade is down. Gold does very well in the latter part of November and December, so a pullback would be healthy and normal.
Bitcoin
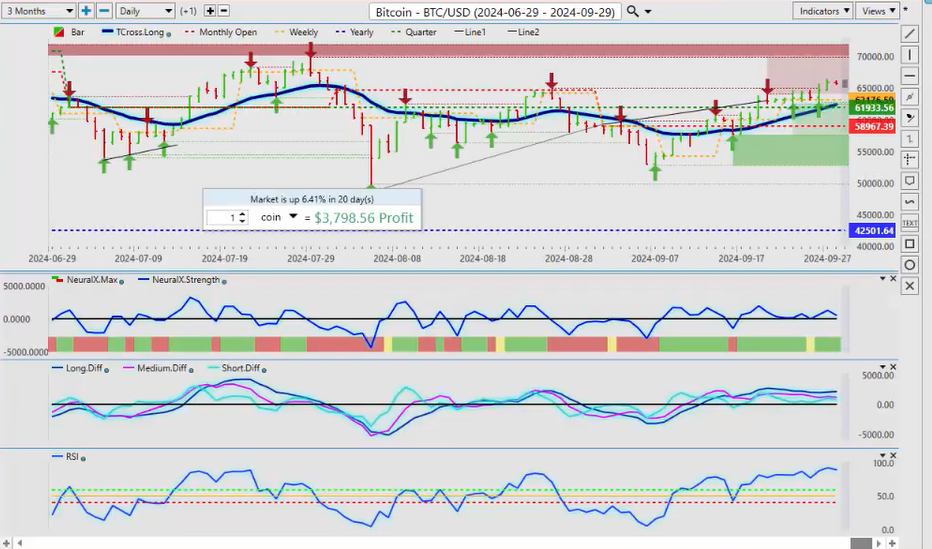
Looking at Bitcoin , Bitcoin continues to advance. I’ve talked about the seasonal pattern in October for Bitcoin contracts, which also applies to anything related to blockchain, such as BitFarms , Hut 8 Mining , and other blockchain stocks. If you don’t like trading Bitcoin directly, there are other ways to do it. That’s the essence of intermarket technical analysis. Stocks like BitFarms and Hut 8 Mining have a 95-98% positive correlation with Bitcoin against the US Dollar , so if Bitcoin rises, those stocks are likely to follow. Bitcoin is looking pretty good, but I anticipate some kind of pullback this week due to position adjusting ahead of the non-farm payroll number. Our T cross long is at 62,451, and longs are viable above that area. In most cases, Bitcoin makes a big move in October, so I would be mindful and patient, looking for that entry point. Either way, based on seasonal patterns and predictive indicators, I believe we are likely moving higher.
Light Sweet Crude Oil
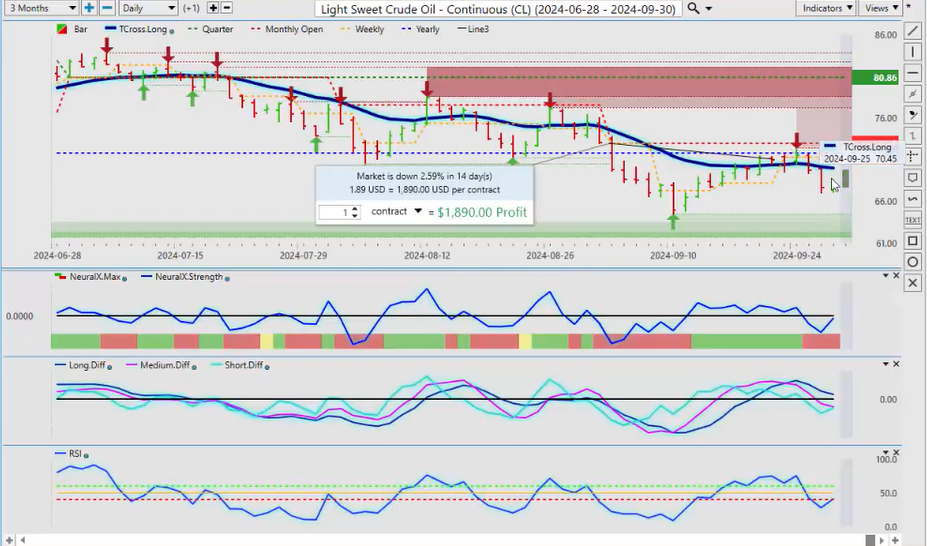
For Light Sweet Crude Oil , next week, there are no buyers. This is why we use the yearly opening price. When we see that rolling performance model of what something did in the last 5, 30, or 60 days, those are subjective levels. We want to make sure we’re using the start of the calendar week, month, quarter, and year. You can see multiple fantastic short trades right off the yearly opening price, with indicators from VP confirming that price. We’ve had an MA diff cross, the pink line crossing over the blue line, combining with the yearly and monthly opening prices, along with the T cross long, making for a relatively easy trade. Money is also pouring into Natural Gas this past week, and I believe it will continue as long as Oil shows weakness.
We do have a reverse check mark here, which is a bit of a warning sign. Our retracement points are clearly defined at the T cross long at $70 a barrel, with the yearly opening price at $71.78. We’ll get a new monthly opening price on Tuesday, which will be an area to watch for both Oil and Natural Gas , as well as the dollar and major markets.
DAX
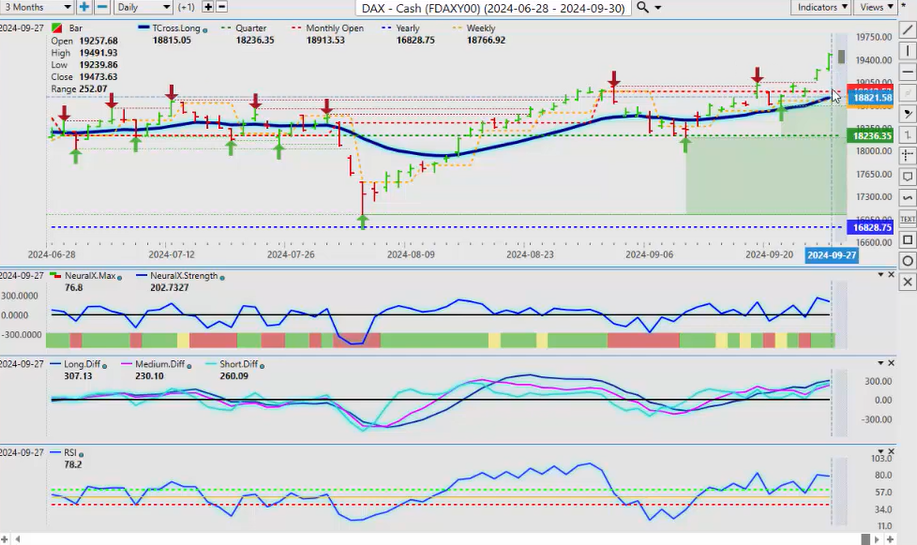
Now, let’s take a quick look at the European equity markets. They’re actually on fire right now, really moving higher. I noticed this earlier in the week. The question is, can they continue to move higher if the S&P , Dow , and potentially the NASDAQ drop? That’s something we have to take into consideration. For now, they remain firm. However, my concern is the distance between where the market closed on Friday at 19,473 and our T cross long at 18,815. I believe we will retrace back to that level if the VIX has confirmed the signal that there are problems with equities. This could affect both European markets and individual stock indices, so we need to watch that area very closely. If there’s any sign of weakness, I would recommend being cautious with longs at these levels because, even though the DAX is part of the European equity markets, it’s still susceptible to weakness in the US markets if that occurs.
Euro versus U.S. Dollar
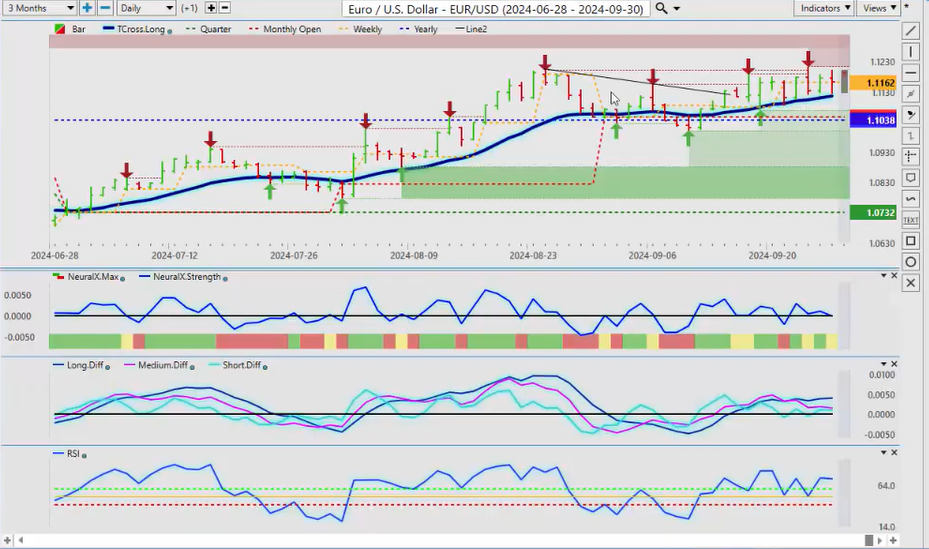
Now, when we look at some of our main Forex pairs, starting with EUR/USD , the Euro completely stalled out this past week. It’s very important to look at these levels up here. We have verified resistance highs going back to August 26th at the 1.1202 level, which has contained the market for over a month. We got slightly higher at 1.1214 and then failed again. There are good long opportunities using the Vantage Point T cross long predicted moving average. Like a moth to a flame, the market is drawn to it—that’s your retracement point. This has nothing to do with Fibonacci or any of that; it’s about this line here, the predicted moving average that correlates with 31 other markets.
If we break down below that T cross long at 1.117, it will likely happen within the next 5 to 7 days. If that occurs, it would likely be a short-term move, barring any new information from the ECB. For now, the indicators are warning the reverse of what the Dollar Index suggests, meaning there isn’t much momentum in buying the EUR/USD pair. I don’t think we’ll see much movement until after we get the labor report on Friday, and we can see what the Fed plans to do next. Your T cross long is the area to watch next week. There’s good buying interest there, but also strong selling pressure above 1.12, so that’s what we’re dealing with moving forward.
U.S. Dollar versus Swiss Franc
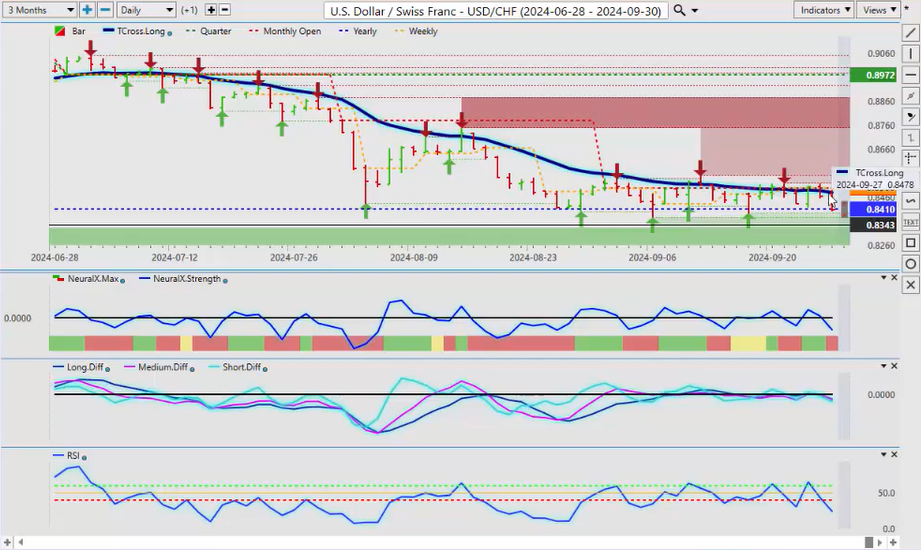
The USD/CHF (Swiss Franc) is another pair struggling this week. You can see that we’re trapped between the T cross long, the monthly opening price, and the yearly opening price at 0.8410. In my respectful opinion, by mid-October, we’ll break down below 0.8410 on dollar weakness and potentially safe haven flows into the Swiss Franc . Once we break below that level, we’re likely to see a much bigger trade going into year-end. The Vantage Point indicators suggest we’re close to that breakdown now, so once we get below that level, shorts are heavily favored.
British Pound versus U.S. Dollar
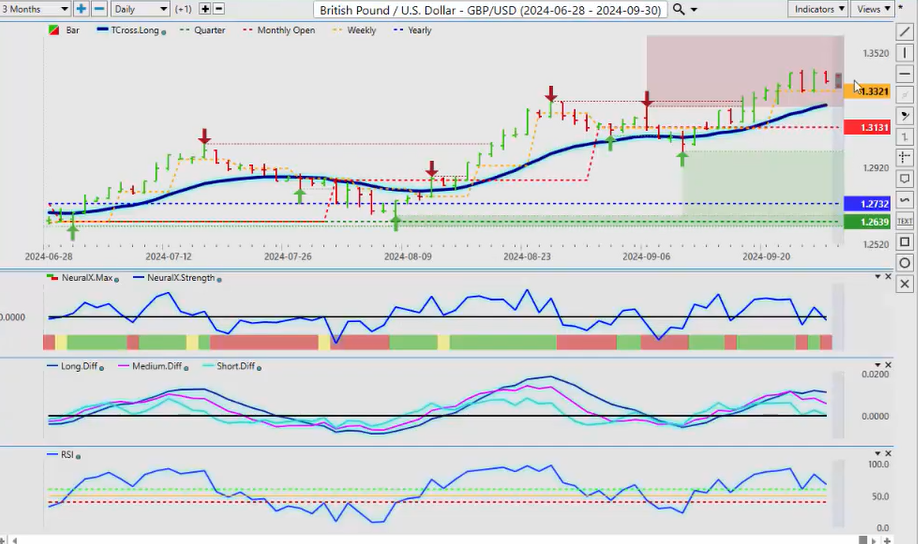
The GBP/USD (British Pound) pair, much like EUR/USD , is stalling out. This can be misinterpreted as dollar weakness, but it’s actually dollar strength preventing the pair from moving higher. There are no buyers at 1.3430, which is clear. To start the week, you can see four bars sitting there, which indicates that a retest of the T cross long is imminent, in my opinion. We’ll need a breakdown of that T cross long at 1.3247 to change the directional bias. We are firmly above the yearly opening price, but one thing to keep in mind is that the quarterly opening price will change on Tuesday, going from 1.2639 to wherever we start Tuesday’s trading. I estimate that will be around 1.3350, which is a tall order for the GBP/USD to hold above. Right now, the indicators are saying we’re going lower to start the week with the MA diff cross, and the four stacked bars at 1.34 are a big warning for us to be cautious with any longs above that level.
U.S. Dollar versus Japanese Yen
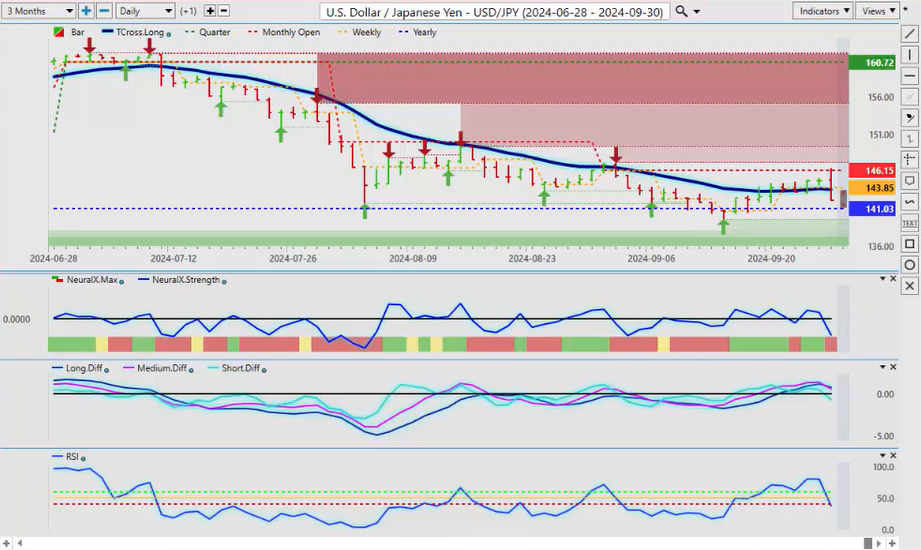
As for USD/JPY (Dollar/Yen), there are some changes happening with the current government, and that change could bring potential rate hikes into Japan. This is being discussed by the new leadership, so the interest rate differential is shifting. Either way, the USD/JPY pair is grossly overvalued, even at 142. If we can break down below 141.03, that will confirm that the carry trade is in trouble, and so is the dollar against the yen. I believe this will make for very good shorts in 2025 and going into the end of 2024. So watch for a breakdown of 141, but remember, if USD/JPY breaks down, all the Japan crosses will follow: EUR/JPY , CAD/JPY , AUD/JPY , etc., as the yen strengthens on potential rate hikes. VP is picking up on this with the MA diff cross and the neural index strength. This is currently showing downward momentum with the predicted RSI, but I believe we need to get through the payroll number first. If we can hold below our T cross long at about 143.55, we should see additional shorts building as they exit the carry trade.
U.S. Dollar versus Canadian Dollar
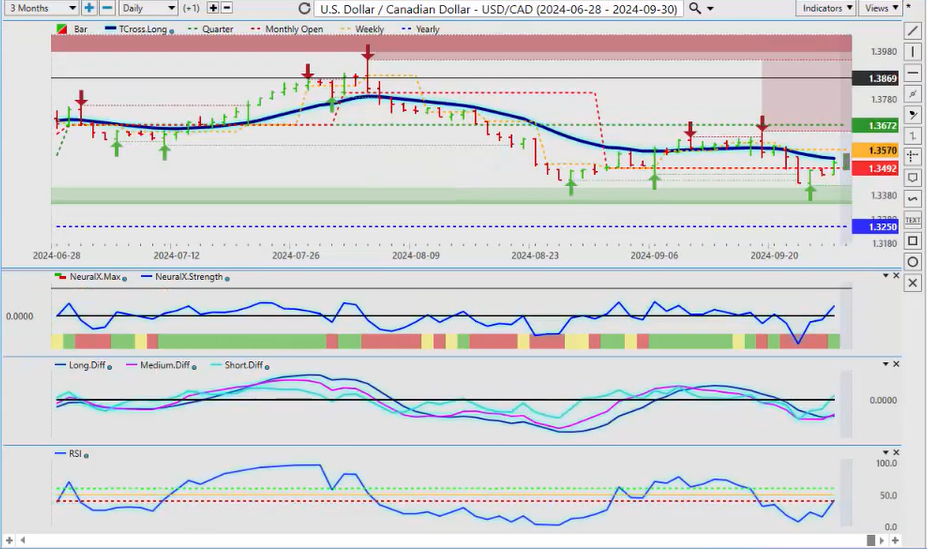
When we look at USD/CAD (US Dollar/Canadian Dollar), there’s very little reason to be buying Canadian dollars at the moment, other than potential dollar weakness. We have verified resistance and support levels here, and the Canadian dollar could come under pressure, not just from oil contracts, but also from a sell-off in the equity markets. The fact that USD/CAD is rising while the equity markets are flat is another warning sign to be cautious with stocks next week. We have a support low here at 1.3430, but the primary trend is still up while we’re above 1.3250. We just need to clear our T cross long at 1.3535, and once we break above that level, it will confirm probably the final move of dollar strength. However, if the dollar is weak, in most cases, the Canadian dollar will also be weak due to their trade relationship. So, we’re building momentum to the upside here with an MA diff cross and neural index strength rising. We just need to clear that T cross long, which should open the door for the 1.36-1.37 area.
Australian Dollar versus U.S. Dollar
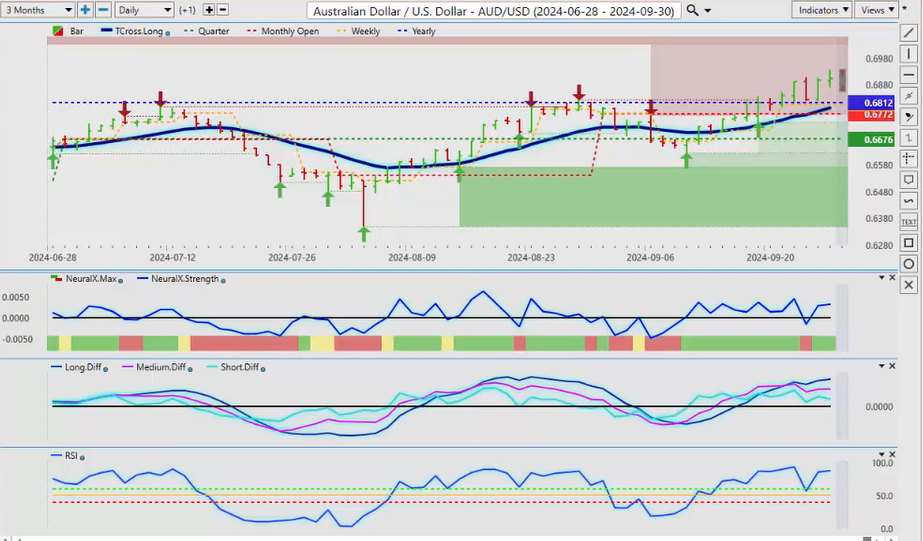
Finally, looking at AUD/USD (Australian Dollar) and NZD/USD (New Zealand Dollar), both got a boost last week from China’s stimulus. AUD/USD finally pushed above its yearly opening price after multiple tests at the 0.6812 area. This demonstrates the importance of keeping that yearly opening price anchored. Every day last week saw good long trades, but we still pulled back to the yearly opening price despite the stimulus. We’re above the T cross long, so that’s your buying area. This is clearly a long trade while above 0.6812, but if we lose that level, we’ll need to reassess. The MA diff cross is the only cautionary sign here, and once the market digests what’s happening in China, the Aussie could cool off. If US stocks move lower, it could drag the Aussie and Kiwi down with it. Let’s reassess after the payroll number.
New Zealand Dollar versus U.S. Dollar
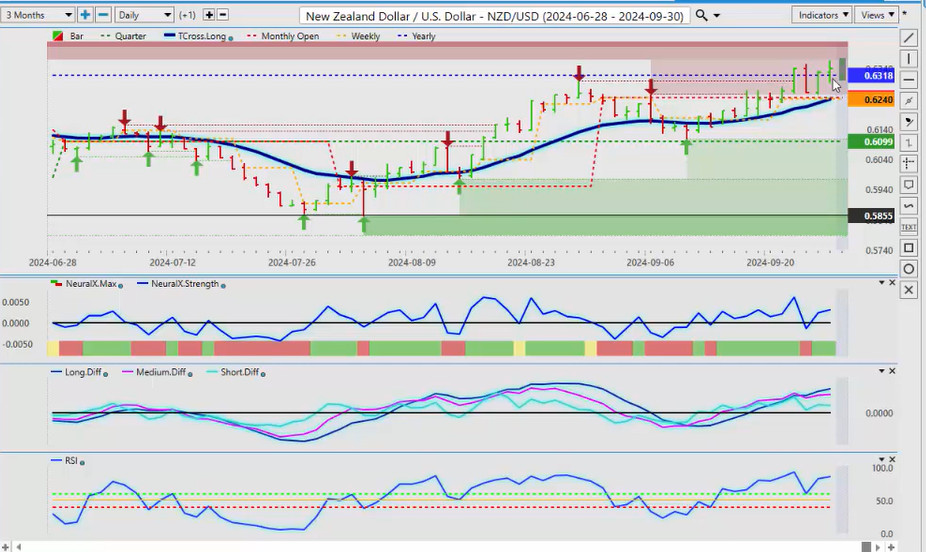
The NZD/USD (New Zealand Dollar) is very similar, but it may offer better value than the Aussie . It’s showing the same signals, but the Kiwi wasn’t able to stay above its yearly opening price for as long, closing only one or two days above it. That level is 0.6311, and if we can hold above it, I think we’ll have decent longs going into year-end. We just need to get past the first week of October and reassess from there.
So, with that said, this is the Vantage Point AI Market Outlook for the week of September 30, 2024.

