Welcome to the Artificial Intelligence Outlook for Forex trading.
U.S. Dollar Index
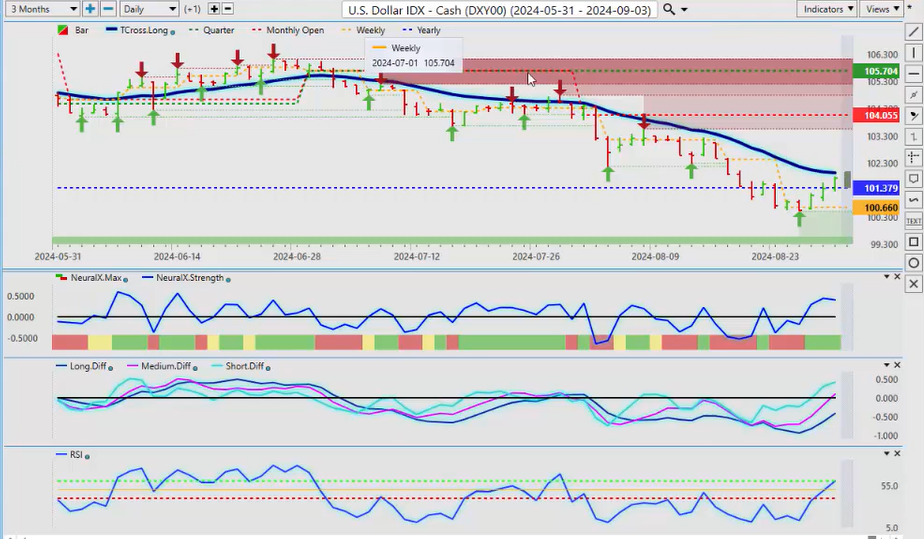
Okay, hello everyone, and welcome back. My name is Greg Firman, and this is the Vantage Point AI Market Outlook for the week of September 2nd, 2024. Now, to begin this week, we’ll start where we always do, with that very important US Dollar Index . Now, when we’re trading the Dollar Index in the US fiscal fourth quarter, we want to make sure we’re looking at the current yearly opening price. We don’t want to use a rolling performance model and basically guess at these levels. So, the yearly opening price, depending where you take it from—either the Asian open or the New York session—it’s going to be between the 101 level and 101.43. So, we can see that the Dollar had a pretty good week.
This Dollar cycle that I’ve talked about over the many years of doing these outlooks is there is predominant Dollar buying in the first week at the end of the month into the first week of the new month. Now, there’s also a very strong seasonal pattern of Dollar buying in the US fiscal fourth quarter, which will end October 1st. So, right now we can see that the Vantage Point indicators are clearly picking up on this: the predicted differences, the neural index, the neural index strength, and we’re gaining momentum on the predicted RSI at 60.2.
Now, again, the predicted RSI is not used as an overbought or oversold indicator; it’s used as a momentum indicator, suggesting there is Dollar buying coming. Now, a bit of an issue with that neural index strength, but the main thing we have to clear is the Vantage Point T cross long at 101.94. If the Dollar is going to fail, that’s where it’s going to be. Now, the media, in my respectful opinion, is completely out of control with the things they’re saying. There is no emergency rate cut, there is no emergency Fed meeting. The FED is very unlikely to cut 50 basis points. They’re building a narrative to weaken the Dollar , in my respectful opinion, so the banks and some of the larger institutions can get a better price on Dollar longs. So, again, to confirm that, we need to clear 101.94. That will confirm that that seasonal pattern of Dollar buying in the month of September up until the end of the month is still likely in the cards.
Gold
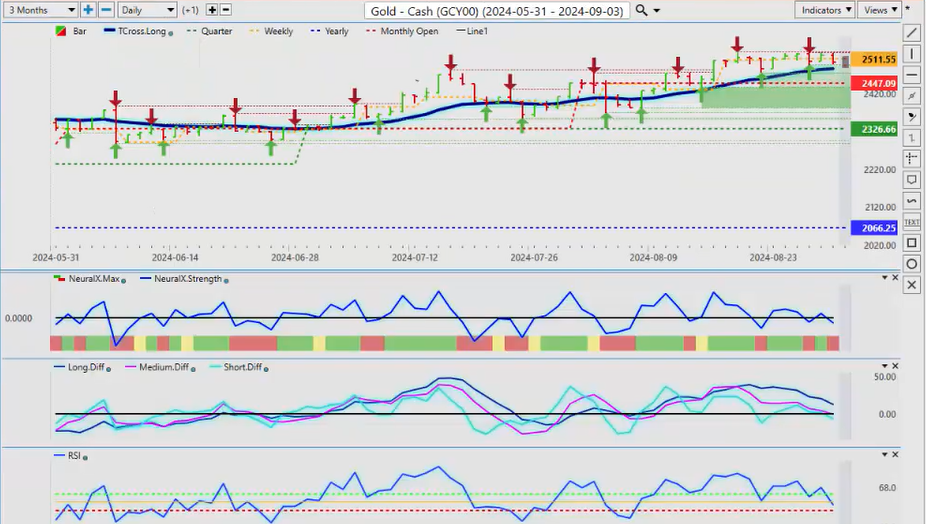
Now, a direct comparative analysis between that and Gold , we can see that Gold had a good month of August, but it’s completely stalling out on these verified zones: 2529, 2527. No new highs here from these two particular levels. And as we can see, we have an MA diff cross right here: the medium-term crossover versus the long-term crossover, or the strength of the medium-term trend has actually been weakening since August 20th. We’ve had a retracement back up to that level, failed again. So what I would be looking for in the month of September is for Gold to break down below the T cross long at $2485, but then we would look to rebuy those Gold contracts into year-end after October 1st. So again, the predicted differences are showing we are losing momentum in Gold ; predicted RSI moving down; neural index, neural index strength—we just need again to break down below that T cross long to confirm this. And I will stress that, but the new monthly opening price, uh, for the month of September, that is likely going to be around 2503, so it’s going to be very difficult for Gold to hold above this level if we get that Dollar strength.
S&P 500 Index
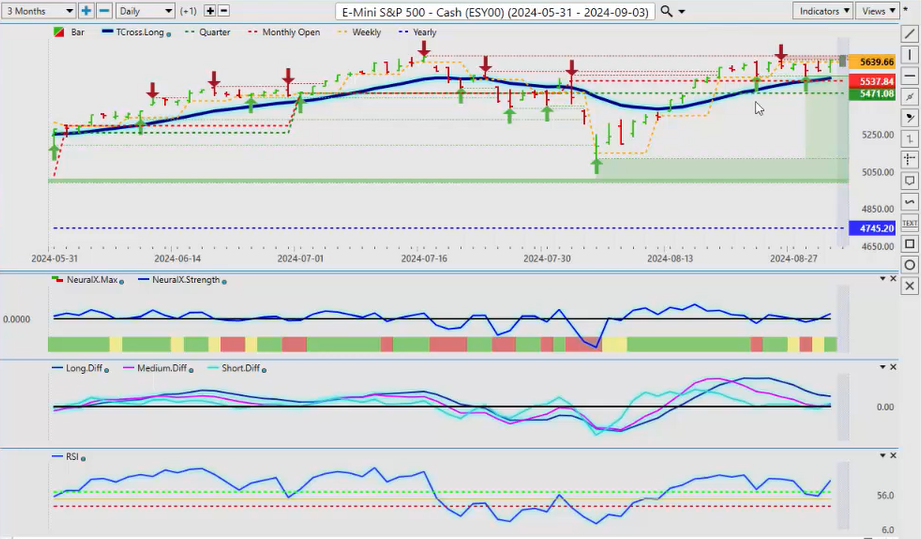
Now, with the equity markets, looking at the S&P 500 , this chart looks very, very similar to the Gold contracts. But once again, we have a medium-term crossover on the equity markets that is trying to complete here. So, I don’t anticipate a great month for equities in September, but in the year-end, they should be fine. We just have to determine whether is the US going to go into a full-on recession, a partial recession? Uh, we will have to see that, and we will monitor the Fed’s comments. But right now, the FED is basically telling us he’s going to cut in September. Now, that may initially help stocks, but the longer-term view of that, the FED may also say the economy is weakening, that will not help stocks. But by the indicators, basically in VP, we have been losing momentum since August 20th, the exact same day that we saw Gold pulling back. So we’re not making new highs in the equities of any real amount, slightly new high over here on August 26 at 5651, but nothing since then. So, a breakdown below our T cross long, that is coming in at 5552, should send the equity markets lower based on the current indicators. But we need to complete that medium-term crossover, and we do have momentum building back to the upside on the predicted RSI. So, it will be very interesting to see how this one plays out if we can actually, if the equity markets can fight off the Fed , the stronger Dollar , all of these different factors that play into inter-market correlations.
Volatility Index ($VIX)
Now, when we look at the VIX , very, very important that we monitor this, as we did last week. And as you can see, the VIX is running along its current yearly opening price, that particular level, 15.01. So right now, this continues to warn us that there is potential for equity weakness while we’re above 15.01. The VIX will ultimately guide us as to where we’re going with equities, but in my respectful opinion only, it’s more likely the equities will struggle only in the month of September and then rebound, uh, October through December. But right now, uh again, a very basically flat signal right across the board, but the predicted RSI is saying there’s the possibility that we’re going to break lower. We’ve got momentum building here, but again, we’re coming out of summer trading, we’re going back into real trading now, uh, higher volume trading. Uh, in my, again, only in my respectful opinion, the week, uh, the following week will likely be the real price. Next week, we have Labor Day; we have a holiday-short week. So we want to be careful on fake moves in the market between Tuesday and Friday. But after we get that nonfarm payroll number, we will have a much clearer picture by, by Friday.
DAX
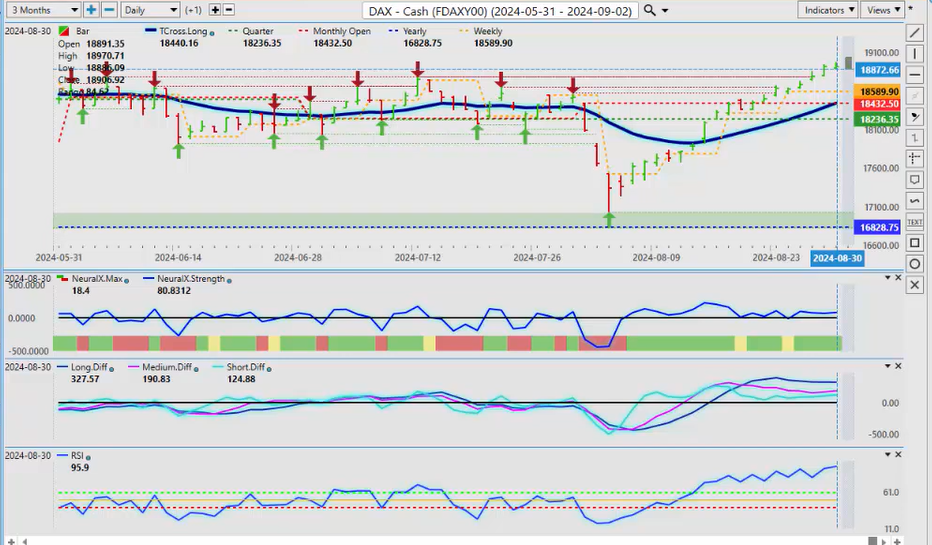
Now, when we look at the European Equity markets, once again, they are really showing strength here, and I would argue, stronger than potentially than the S&P 500 . But if the S&P 500 , the NASDAQ , if they slip and move lower, then the DAX and the European Equity markets are likely to follow.
Bitcoin
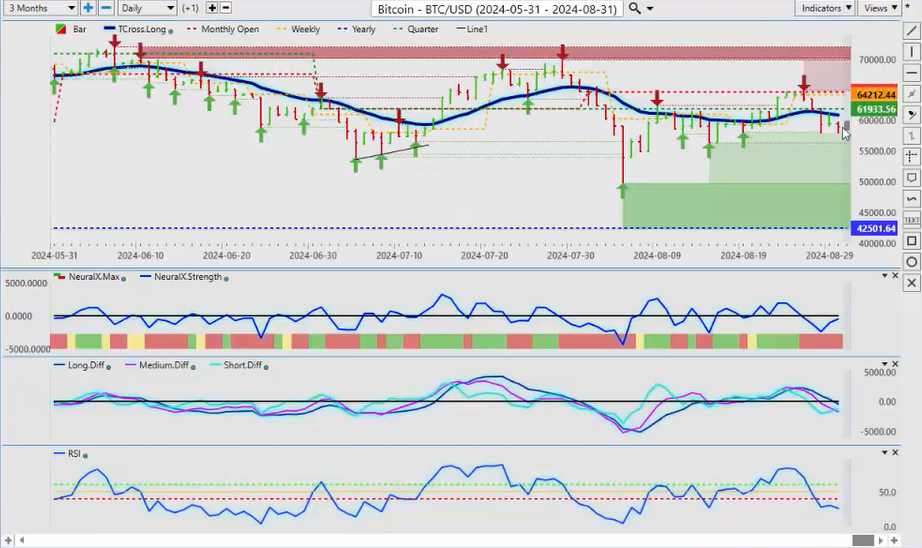
That is something we want to watch very closely. And one of the asset classes we can use from an in-market analysis standpoint is Bitcoin . So, when we look at Bitcoin , it’s soft, which is perfectly normal, guys, for this time of year. There is a powerful seasonal pattern with Bitcoin in late September through late October—that’s the prime buying period for Bitcoin . So, I would be looking at that while it is bearish; it’s a bearish setup. We are firmly positive on the calendar year 42,501. Again, the rolling performance model of picking random points of where something is bullish and where something is bearish is not a viable way to measure real performance. Bitcoin is very bullish on the year.
Light Sweet Crude Oil
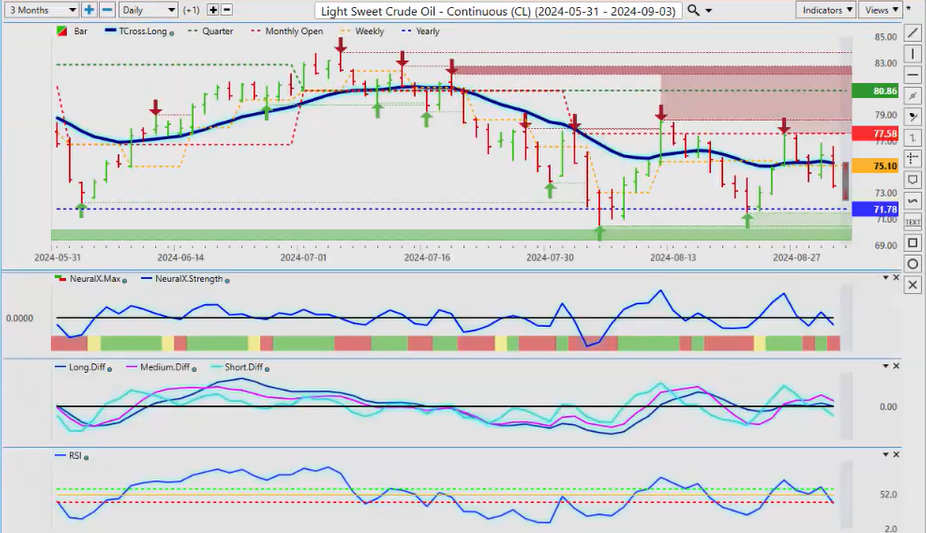
When we look at Light Sweet Crude Oil , a lot of people will talk about the seasonal that oil is strong in the month of August. That is simply not factual, guys. We opened the month at 77.58, and we have never really been positive on the month of oil, and then we’ve had an additional 5% sell-off just this past week. But if you look at the move from the current monthly opening price and then compare it to the Vantage Point T cross long, I believe it’s just a matter of time before oil breaks down below 71.78. But again, when they say that oil is bullish and saying well there’s a season in August, that’s really not factual, guys. This is a retracement after a 8 to 9% sell-off, and then we turned around and sold off again. We’ve come right back up to the monthly opening price for the third time and it’s sold off again this past week. This is something we’ve worked on in the Vantage Point live training room to use an basically a non subjective tool like the monthly opening price to gauge real performance. The performance on oil in the month of August was all to the downside. You’ve had these retracements back up, but again, what we talked about in last week’s presentation is we are consistently making lower highs and we have never been able to hold above the monthly opening price for more than 48 hours. It is technically bearish this time of year going into September through year end. It’s usually Nat Gas that moves higher. The inverse correlation between oil and Nat Gas heavily favors natural gas at this particular time of year.
Euro versus U.S. Dollar
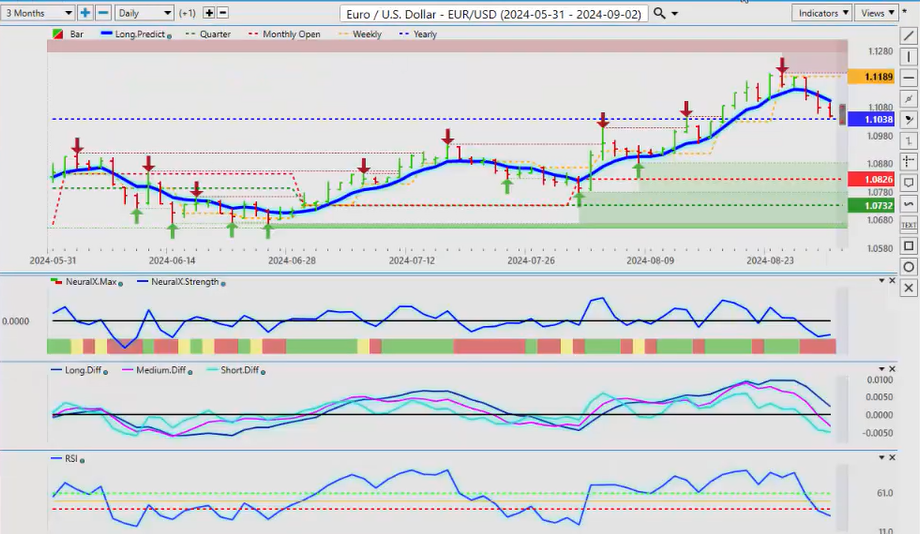
Now, when we look at some of our main Forex pairs, once again, the Euro/USD , one of the top-traded Forex pairs, has succumbed to Dollar strength. Now, what we can look at is again, looking at the TCross long in comparison to the Dollar Index below here right at a breakout point on our TCross long. We do a comparative to the Euro , and we can see that it’s in the exact same spot, sitting on the VPT cross long, but a much bigger level is sitting here, guys, the calendar yearly opening price from back in January 1, 1.1056. This is a make-or-break level for the Euro , guys, and it’s, again, an objective line in the sand that tells us, okay, the Euro has been bearish for 97% of the year. This period of about 2, 4-6, about 12-15 days, that’s the only time of the calendar year the Euro ‘s been bullish above that it’s been positive on the year. So, this, I would respectfully submit, keep a very close eye on this level. We’re either going to rebound off here and go higher, or we’re going to break down below it, and the Dollar will reign basically supreme in the month of September, or at least part of it. The indicators from VP, we have a short-term and a medium-term crossover, and we have momentum building to the downside. Seasonals are one of the top tools to use in trading, guys, but they’re not 100%; nothing is 100%, but there’s a high probability because we’re in the US fiscal fourth quarter that there’s required Dollar buying of that fiat currency. Very important that I state that nobody needs to buy a stock, nobody is required to buy a futures contract, an options contract, but they are required to buy fiat currencies at certain times of the month and certain times of the year. So, there is a slight, um, slight advantage to the downside that the Euro is going to break down below 1.1058, so, 1.1058, excuse me. So, what we would be looking for is a break of that area, a clean break of it, then a retracement back towards it, and then an additional sell-off. That is something we will again monitor but be very cautious around this level in the first couple of days of trading next week.
U.S. Dollar versus Swiss Franc
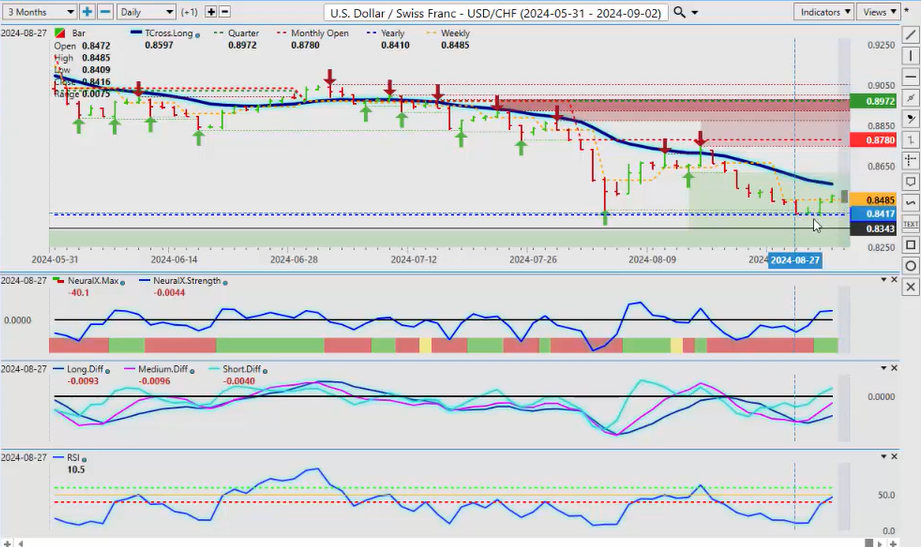
Now, when we look at the US/Swiss Franc pair, once again, the value that you can see using the current calendar yearly opening price, now we’re holding 0.84406. Again, a make or break level here, we either hold and go higher or we break down below it. The Swiss Franc and the Japanese Yen are, by definition, the carry trade. Keep an eye on this pair because it will also tell you what to expect from Dollar/Yen . But right now, we have three consecutive days after a retracement on August 5th; we bounced clear off that, hit the VPT cross long, our critical medium to longer term predicted moving average below it, short above it, long. But right now, three consecutive days, and we’re starting to rise higher. So, the T cross long at 0.8560, we must break this level. But either way, after October 1, guys, we’re looking for shorts on this particular pair.
British Pound versus U.S. Dollar
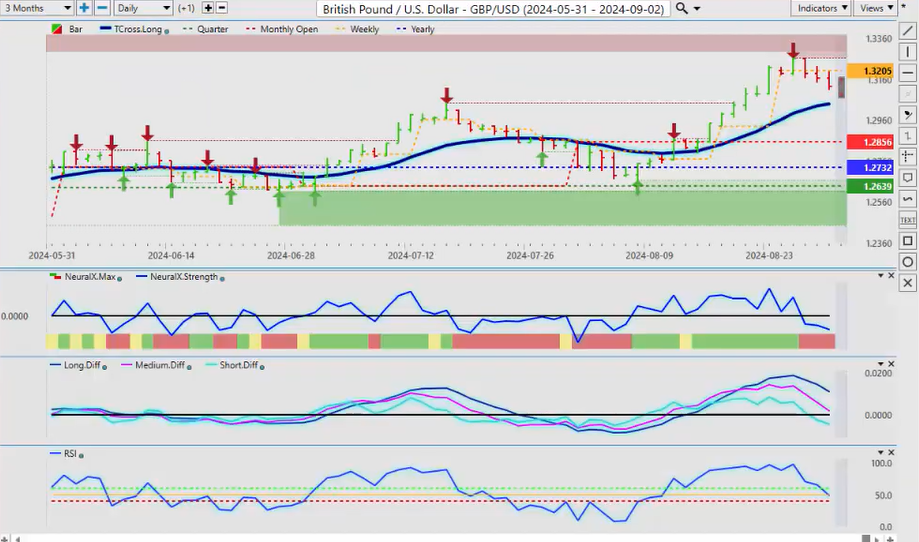
Now, the Pound/Dollar also, uh, is falling with the Dollar strength in the last week of the month. Now, it’s important to note here that I’ve done this repeatedly for many years, showing you guys, at the end of the month into the first week of the new month, regardless of what the trend is, Dollar strength kicks in because they are required to buy this fiat currency. Now, the Pound is stronger, clearly than the Euro , with its yearly opening price at 1.2732. The monthly doing well, but the Tross long at 1.3041, uh, yes, I can see us retesting that level. When we hit that level, we’ll make a decision whether we think it’s going to hold or whether it’s going to break, and by then, we should have the payroll number on Friday and a better idea of what the FED is going to do. But again, don’t fall prey to this fake news media by thinking that the FED is going to cut 50 basis points; that would be, uh, that would be suicide if he did that, uh, and there is nothing that requires that. Slow and steady wins the race; no Central Bank has cut 50 basis points, no G7 central, excuse me, G7 Central Bank. So, I don’t anticipate that from the FED , regardless of what that payroll number is. So, right now, 1.3041, that’s our retracement point, going into year-end, after October 1, I can see the Pound doing, uh, fairly well, but again, we will monitor this.
U.S. Dollar versus Canadian Dollar
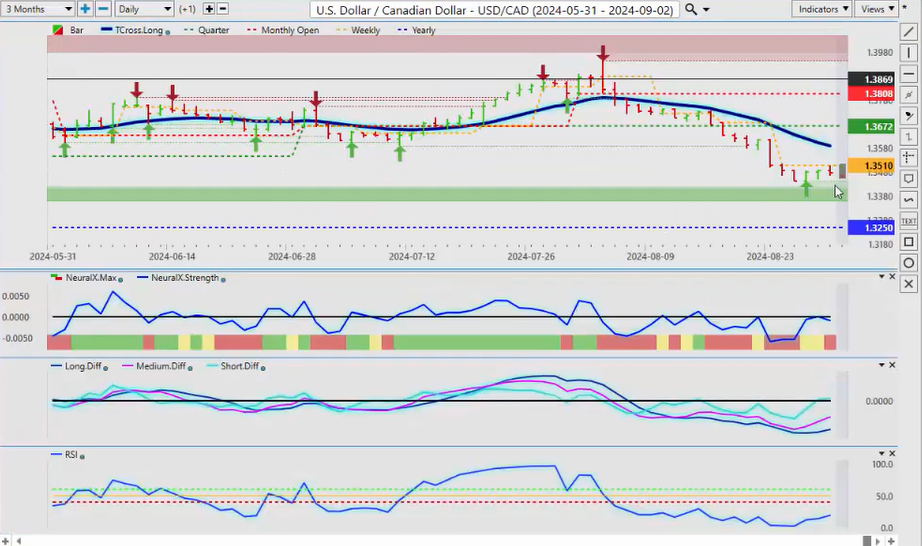
Now, for the US/Canadian pair, once again, the US/Canadian pair has, uh, the Canadian Dollar has never really been positive against the US Dollar in the entire calendar year. There’s where we started the calendar year, with the current yearly opening price, it’s been all to the upside. So, this looks like nothing more than a retracement back down, and then we go higher. So, when we look at the broader structure of the market, it gives us a better idea of what to expect in the short and the medium term. So, right now, we have a new verified support at 1.3427. We have oil prices that are plummeting, uh, equity markets very shaky, these do not favor Canadian Dollar long. So for this particular pair, if we can hold above 1.30, above the low here of 1.3441, the indicators from VP are starting to warm up to the idea of longs on this particular pair, and I believe that to be very reasonable while above 1.3250. A little bit of mixed on the neural index, but the core indicators in VP, uh, are telling us, at the very least, we’re going to get a retracement to about the 1.36 level.
Australian Dollar versus US Dollar
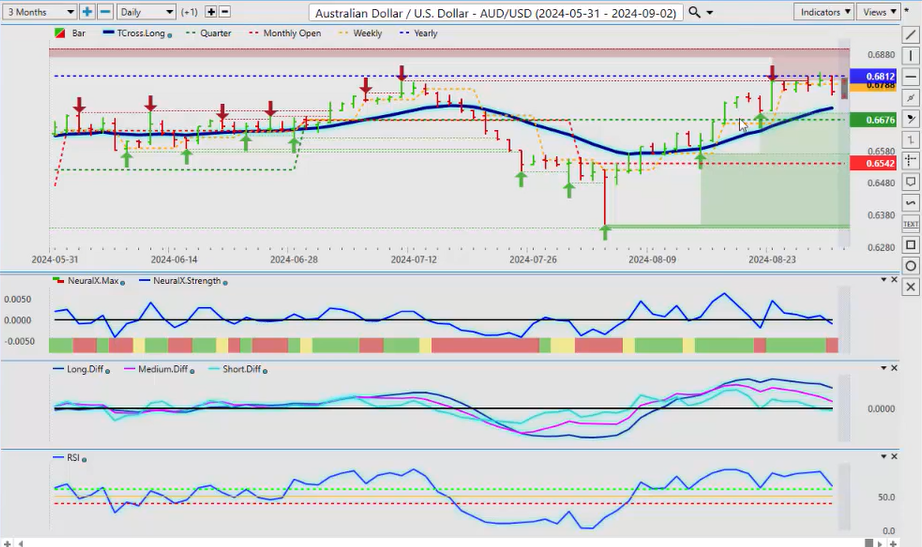
Now, when we look at the Aussie/US, this one is very interesting, guys. You can see that we tested the yearly opening price, are very close to it, back on June the 11th, July the 11th, excuse me, and then we had a big sell-off, a 500 pip move sell-off approximately on this pair. We’ve retraced right back, which is absolutely nothing to do with Fibonacci wave theory, it, this is a real level that we can see, the calendar yearly opening price, that’s coming in at or about 0.6812. We’ve hit that, and we have done absolutely nothing since. Here, the MA diff cross on VP is warning us, the predicted differences are starting to slide. So here’s the play, guys, if you believe that the Aussie ultimately is going to go higher, which I do, but I don’t believe that that is likely to be in September, but if you do, then you simply put buy orders above the current yearly opening price. I believe that the Aussie/US longs will be very good next year, and potentially after October 15th of this year. Well, maybe even if we get a really horrible payroll number on Friday, the Aussie could pop above it then, but it needs to stay above 0.6812 in order for us to continue to buy this. So while conventional indicators are very bullish on the Aussie, the yearly opening price is saying, no, we have no buyers up here, and we can see how it reacted to it last time. But once again, we are back up here, and the bulls are stubborn; they’re holding the line up here, but they’ve got to push through 0.6812. That’s what I can share with you, and, again, something as simplistic as the current yearly opening price is extremely powerful when mixed with these VP indicators.
New Zealand Dollar versus US Dollar
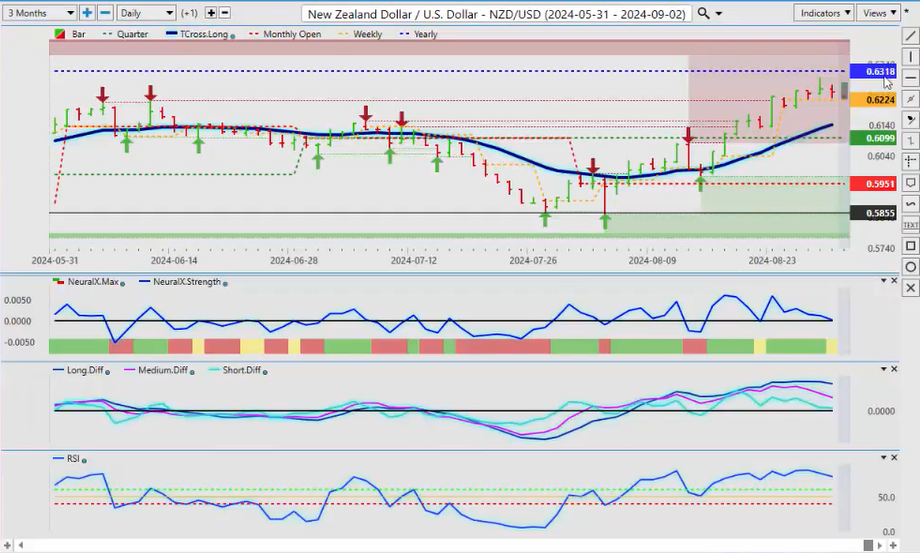
The Kiwi, same deal here, guys. We’re approaching 0.6318, which will be the calendar yearly opening price on this pair. If the Aussie goes higher, the Kiwi will follow. That is the key, but which one do we take? Which one has a better opportunity between Aussie-US and New Zealand-US? So, the lesson here is this pair, Aussie-New Zealand. Aussie-New Zealand is pushed above its calendar yearly opening price. If it can hold above 1.0781 and continues to rise, then we buy a little heavier on Aussie-US than New Zealand-US. This is a synthetic cross pair. There is no such thing, guys, as Aussie-New Zealand. It’s made up of Aussie-US and New Zealand-US. So if it’s rising, this pair is rising; it favors Aussie-US. If it’s falling, it favors New Zealand-US. And that’s something that very often is not explained in that format for people to understand what this cross pair does and how does it affect our G7 pairs in the Forex market.
So, we do have a holiday short week. We are going to see some volatility over the next 10, 12, 14 trading sessions, but there will be a clear trend that will develop in the month of September. So, with that said, this is the Vantage Point AI Market Outlook for the week of September 2nd, 2024.

