-
View Larger Image
Welcome to the Artificial Intelligence Outlook for Forex trading.
VIDEO TRANSCRIPT
Okay, hello everyone, welcome back. My name is Greg Firman, and this is the Vantage Point AI Market Outlook for the week of August 5th, 2024.
U.S. Dollar Index
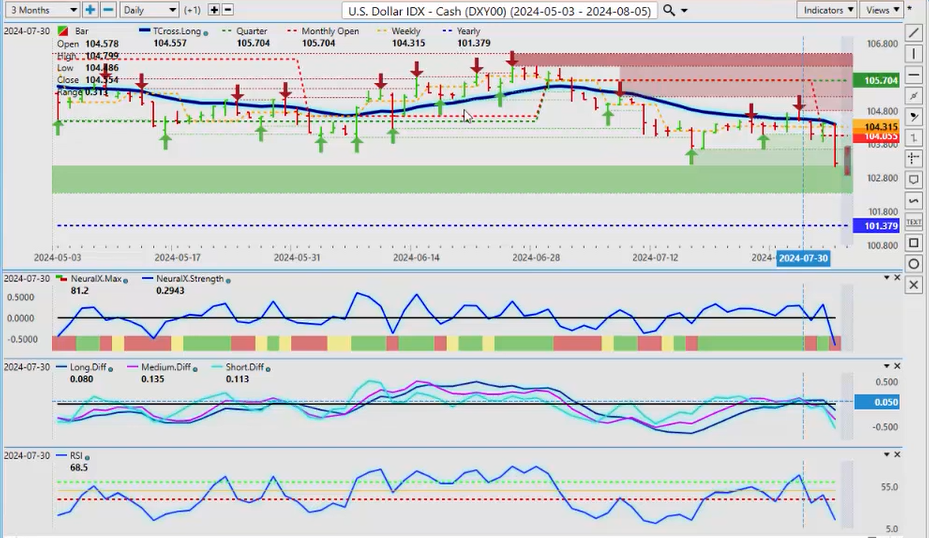
Now, to start this week, we’ll begin with that very important US Dollar Index . As we can see, this previous week we’re running right along the T-cross long, which I had discussed in last week’s Weekly Outlook. We do not look solely at the neural index for a trend. We use our T-cross long with the neural index, with the neural index strength, the predicted differences—there are multiple points of confirmation of a trend. But that’s not determined by the neural index. That’s not a highbrow thing—whatever that meant—that’s too funny, uh, but again, looking at these points of confirmation, these weekly videos are intended to help the average trader utilize the software potentially in a different way, identifying the primary trend and what the short, medium, and long-term trends are. We use that for the predicted differences. So, when we look at the Dollar Index , we can see that we could not get above our T-cross long on Friday. We had a substantial sell-off on the dollar, now that was largely based again on the non-farm payroll number. It was a very, very poor labor report, but my argument would be that that labor report has not been good for months, but the U6 now has had a significant spike from 7.4 to 7.8, plus the unemployment rate went higher. That is now going to likely force the Fed’s hand to cut, but uh, it’s not about one cut, guys, it’s about how many we get into the year-end, and how it will affect the dollar. Now, another point of confirmation in the overall primary trend is the current yearly opening price. We don’t want to look at a rolling performance model, looking at the last random 5 days, the last random 30 days, we need points to do that in the current quarterly opening, the current monthly opening, and the current 2024 yearly opening. So the dollar remains positive on the year while above 101.37, and again, in most cases, there is still dollar strength in the fiscal in the US fiscal fourth quarter, which ends October 1st. So I don’t think the dollar is down and out here completely. I think the market has to digest that labor report, but the immediate pressure currently on the dollar is to the downside. We have three crossover short-term, medium-term, and long-term crossover momentum on the predicted RSI. This will affect all of your forex pairs, guys— Euro/US , Great Britain/US , US/Swiss Franc , US/Japan could be a big one, uh, and of course, AUD/US and New Zealand/US . So, a simplified version of this outlook is that we would either be buying or selling US dollars if the dollar is moving lower—in most cases, your other markets would be moving higher—uh, Gold , Bitcoin , potentially the equity markets, but they have taken a hit because now the market believes the US is going to potentially go into a recession.
Gold
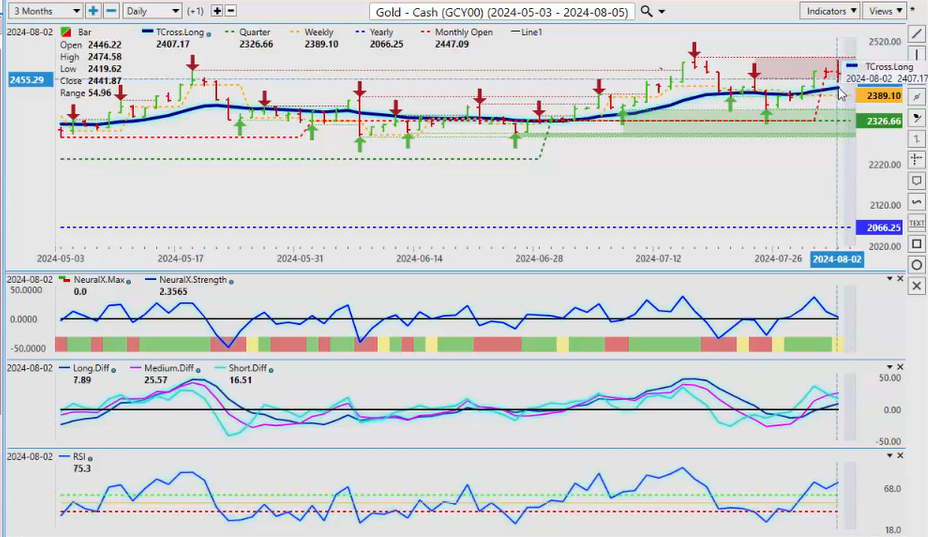
So the dollar remains soft, now this initially saw we saw a spike in Gold . Now, again, gold on the quarter usually doesn’t fare quite as well in the month of August and September, but it does do well between October and January. But right now, uh, I think the bets are building on a potential hard landing, not a soft landing, because the Fed has refused to cut, and while other central banks have already cut twice, uh, I don’t know how many more times he’s going to be behind the curve like this to get out in front of these things. He always seems to be behind, but again, right now, our T-cross long identifiable area—2407—long gold while above this area is reasonable. The indicators are in the other points of confirmation in the Vantage Point software are all in agreement. Now we also have our yearly opening price, gold very positive on the year, uh, maybe even outperforming Bitcoin a little bit this past week. So when we look at this right now, uh, we want to look at our key level, our T-cross long—2407—our predicted differences are rising, and this is the inverse correlation to the Dollar Index : go dollar down, gold higher. So watch this level next week because again, this is an outlook, not a recap of something that already took place. We’re looking into next week’s trading while the market is actually closed on a Saturday.
Light Sweet Crude Oil
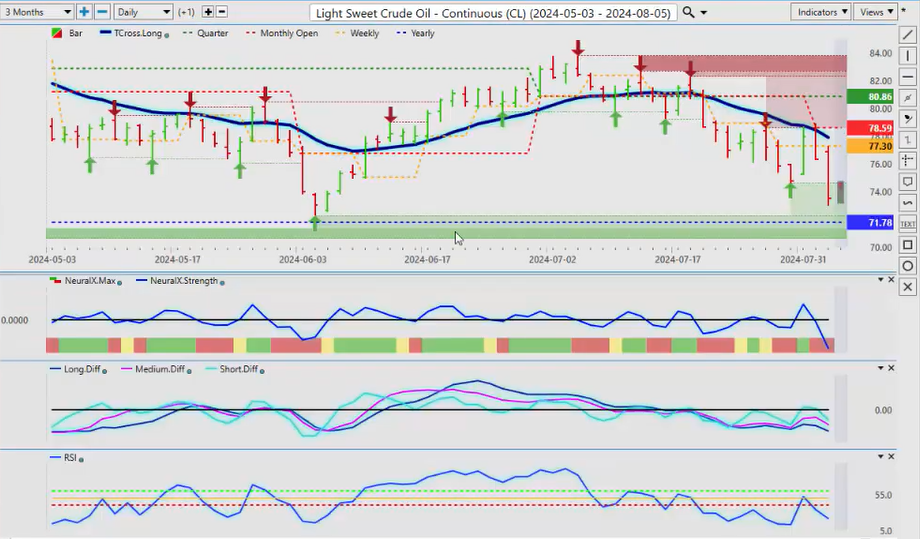
Now when we look at our, uh, Light Sweet Crude Oil , this is in most cases a softer period for oil. We’re approaching the yearly opening price. I would respectfully submit to be careful around this area. Again, we can see that we’ve had a significant rally back in June on this, but at this time of year, in most cases, in the month of August, oil is soft, and Natural Gas is moving higher. I believe it’s almost 100% over the last 5 years, in the month of August, natural gas has moved higher in August. Doesn’t mean it will happen for sure this year, guys, I’m just pointing out a seasonality, a very strong seasonality to keep your eye on. So right now, our yearly opening price on light sweet crude oil—71.78—I do anticipate some buying at that particular level, but again, I need those multiple points of confirmation from Vantage Point to confirm that, and right now, I don’t have that. So when we came down to the yearly opening in June, we had an MA diff cross that started to move higher, we had the break of the 60 level on the predicted RSI, then we broke above our T-cross long. There are multiple levels of confirmation looking for a trade, not just the neural index. That is a short-term indicator, guys. We need to look at the short, medium, and longer-term indicators to get that level of confirmation.
S&P 500 Index
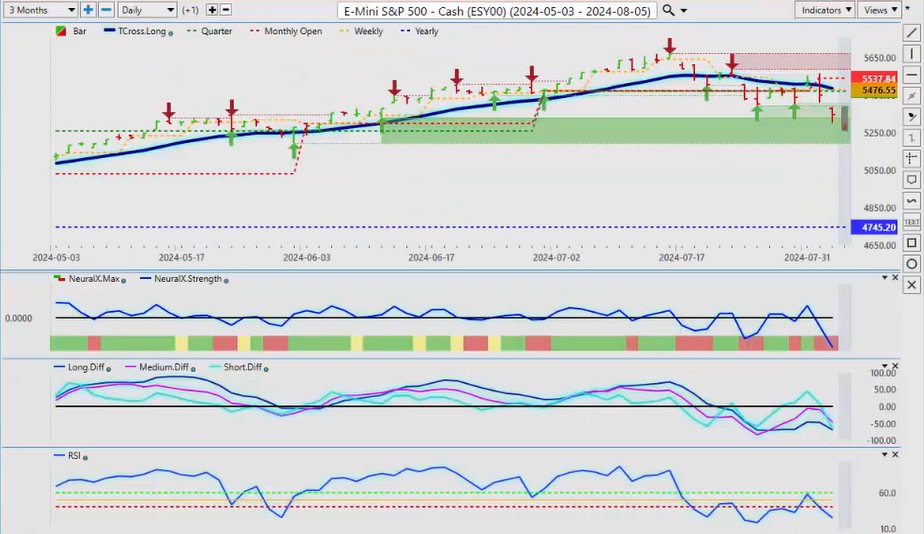
Now when we look at stocks for next week, this is—stocks for next week are going to be very, very tricky here, but I believe ultimately they should start to move higher once we get past the labor report, maybe get a little bit more positive reinforcement the economy is okay, but in most cases, when the Dollar Index drops, stocks rise. So, uh, I believe we could be setting up for a Monday, Tuesday reversal here, uh, which means the market continues to move lower on Monday, and then Tuesday and Wednesday, the stocks start to recover. But again, we need those points of confirmation, and at the current time, we don’t have that. But keep an eye on your neural index and your neural index strength for any kind of trigger point, uh, that would tell us that we potentially could be turning around here, uh, we we have some some verified support lows, uh, the first one is down here at or about the 5191. Now I don’t think we’re going to get to that by Monday or Tuesday, I believe we we will recover prior to that. Remember the current yearly opening price, guys, 4745, the stocks are very, very bullish on the year. Don’t again, we we’ve got to be careful of buying into these short-term reactionary moves. I believe things will settle down again, and they’ll start spinning it, saying that it’s only one bad labor report, well, actually, there’s been multiple bad labor reports, but this is how they spin things, and then, uh, then people slowly start coming back into stocks again.
DAX
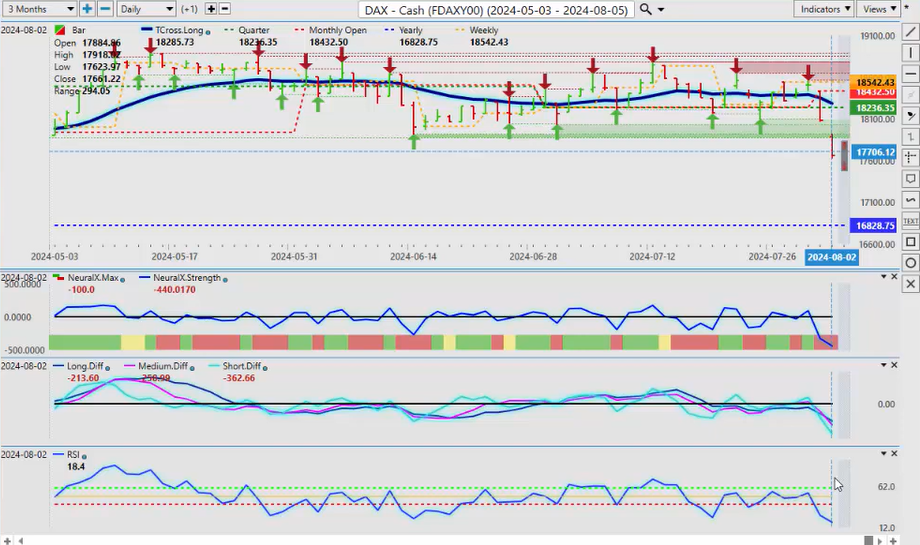
So watch for that on Tuesday and Wednesday, uh, on the European side of that, of that same trade, just remember, it’s basically the DAX and the S&P and the NASDAQ, they’re basically the same trade. Okay, so right now, we’re still heading lower, but if the S&P, the Dow, the NASDAQ, turn back up, that will pull our European equity markets back up also.
Volatility Index
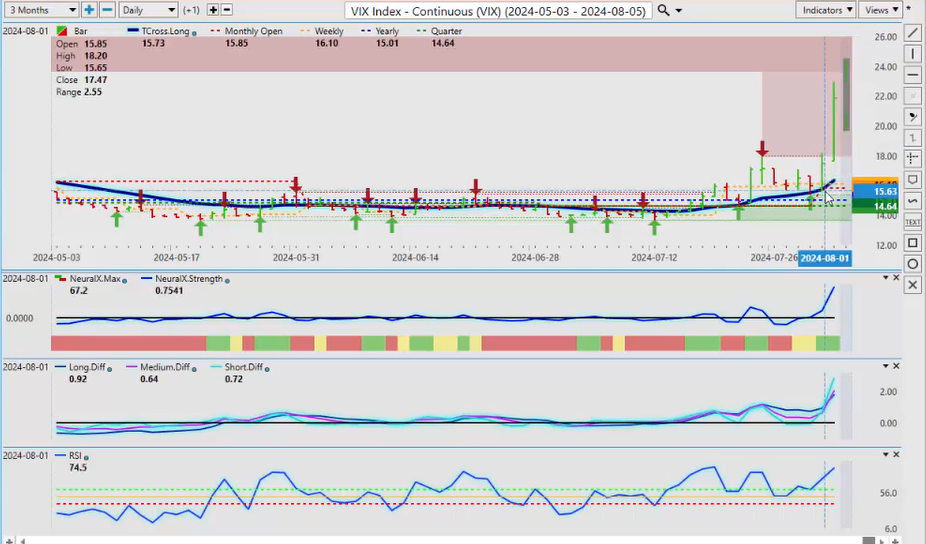
But we do want to do a comparative analysis to the VIX as I talked about last week, and stocks did have a pretty good week for the most part, and the VIX did not do well, but the second we started getting that data, and we got the Fed, and then the payroll number, the VIX spiked again. Now, what I can tell you, and, and again, only in my, uh, in my respectful opinion, I would never buy a bar that looks like that. It’s almost guaranteed that you’re going to retrace at least, uh, 50 to 80% of this particular bar. So again, it’s a reaction, it’s the shock of the payroll number coming in so low, below the consensus number, and below, of course, the ADP number, which was low to begin with, at 120, and then we came in even lower than that. So that sent a bit of a shockwave through the market, uh, of a potential recession, but again, we were too early to make that call here yet, uh, for now, the VIX is showing signs of strength, but I, I don’t believe it will continue higher from where it closed on, uh, Friday.
Bitcoin
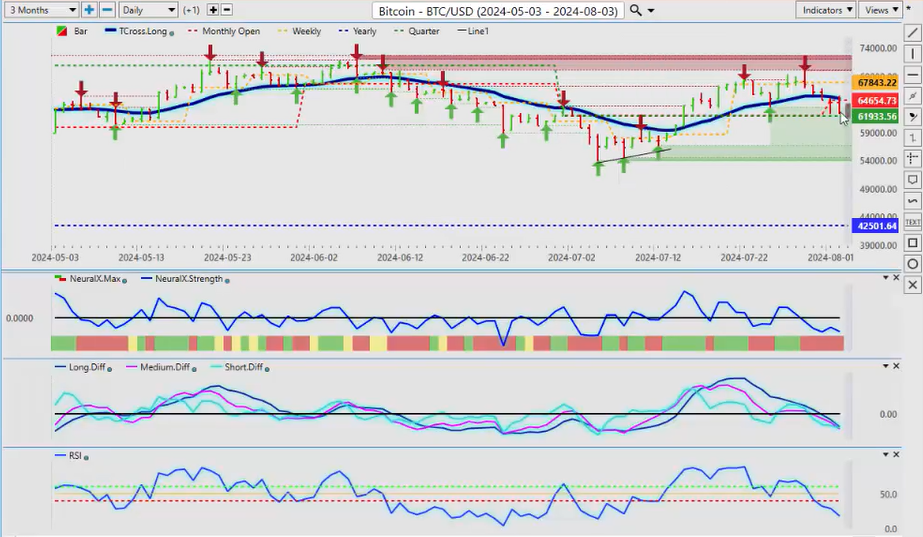
Now, Bitcoin also reacting to that labor, uh, report negatively, but we are still holding above our quarterly opening price—very important, guys, uh, if we lose the quarterly opening price, in my respectful opinion, you still got a buying opportunity as, but we don’t expect Bitcoin to really start making its next move anyway until late September into October 1st, with that very powerful seasonal pattern. So keep an eye on that, uh, area right now. Our quarterly opening—61,633—the indicators are bearish now, but remember, guys, the trend is still firmly up on this on a longer period, uh, so again, uh, it’s all about, well, some people could argue timing, but, uh, I think understanding certain types of seasonal patterns are very, very powerful, and usually before they kick in, they flush the market out first, so they’re probably going to run some stops on Bitcoin, but you’re still looking at a buying opportunity, uh, in my respectful opinion only.
Euro versus U.S. Dollar
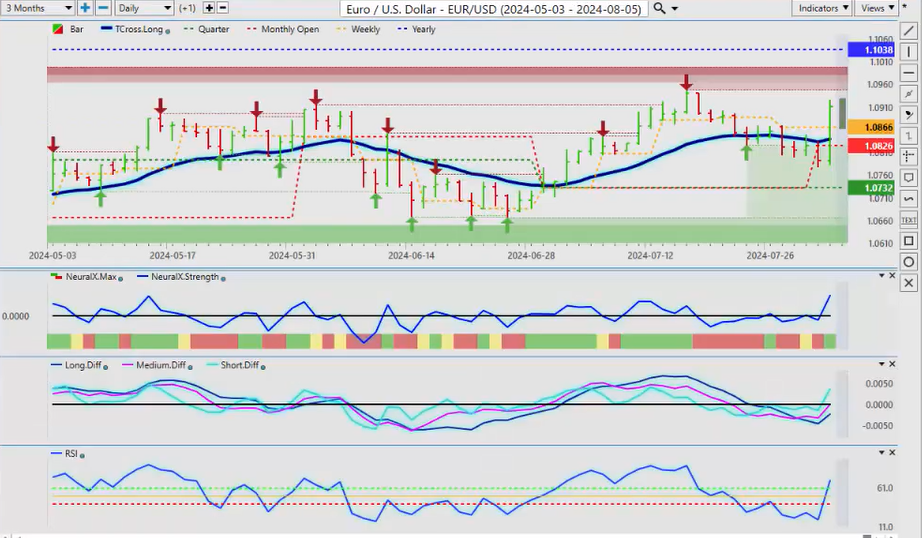
Now when we, when we come into some of our main Forex pairs, again, guys, it would be somewhat redundant to go through all of them, but in the Forex market, you’re either buying or selling US dollars.
Now, you have three currencies that react strongly to equities and commodities—that’s the Aussie , the Kiwi , and, of course, the Canadian dollar —so if we get a bit of a rebound in stocks, watch for those currencies to potentially turn around. The Euro has extended considerably higher, uh, where the Canadian dollar and the Aussie and the New Zealand dollar did not do well, even on that dollar strength. So, what I want to do for you is outline where those inter-market markets are going to drive certain currencies, so you’re, uh, in most cases, when the dollar takes a hit, the Euro, the pound, they’re going to rise, maybe even the Yen, but that doesn’t mean the Aussie , the CAD , and the New Zealand will. Those currencies are going to follow your stocks very, very closely. So, even though the stock market has turned lower once again, we can see that the Euro has spiked. So when I look closer at that S&P 500 and where we’re going with equities, uh, the further we move away from the T-cross long, the more likely it is, guys, we’re going to retrace to it. So our retracement point is 5483, but these indicators are still bearish, but the euro is rising based on its, basically, uh, 99.9% inverse correlation to the Dollar Index . So, Dollar Index down, the Euro up. So the Euro has managed to cross above our T-cross long, your retracement point for Monday, for next week—108.40—we need to hold above that level. When you look at the primary trend on the Euro, it is still down—110.38—the Euro has never been positive on the calendar year. Don’t forget that. So, right now, yes, we do have a buy signal, but we don’t quite have a medium-term or a long-term crossover yet. So we need to hold very close to that area. If we click on the F8, then we can see that the 108.42 is our long predicted, so you’ve got both of those predicted moving averages at the same level.
British Pound versus U.S. Dollar
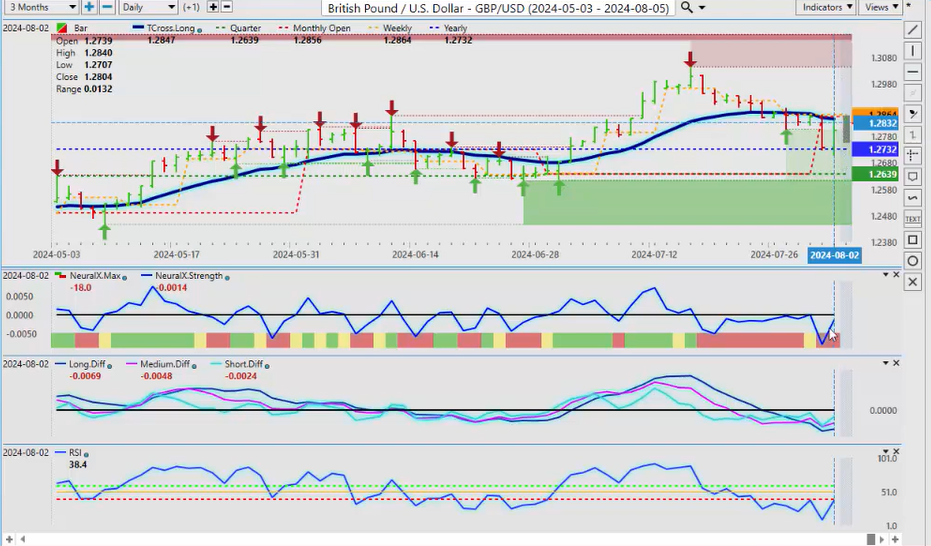
Now, the British Pound/US Dollar is virtually the same trade here, and you can see that it’s not doing anywhere near as well as what the euro is. Bank of England cut this week, another strike against the Fed. What is he waiting for? Uh, again, uh, Bank of Canada’s cut twice, Swiss National Bank twice, ECB once, probably another one coming. Now the Bank of England’s cutting, so the Fed, the longer it waits, the worse it’s going to be for the US dollar, in my respectful opinion. So the pound has a buy signal starting to form, our MA diff cross, neural index strength rising, predicted RSI momentum building, but we’ve got to get above our T-cross long—128.51—once we clear that, the pound is set to move higher. But always remember, there is that seasonal pattern of dollar strength in the month of September, actually usually starts mid-August. So be careful with this particular pair.
U.S. Dollar versus Japanese Yen
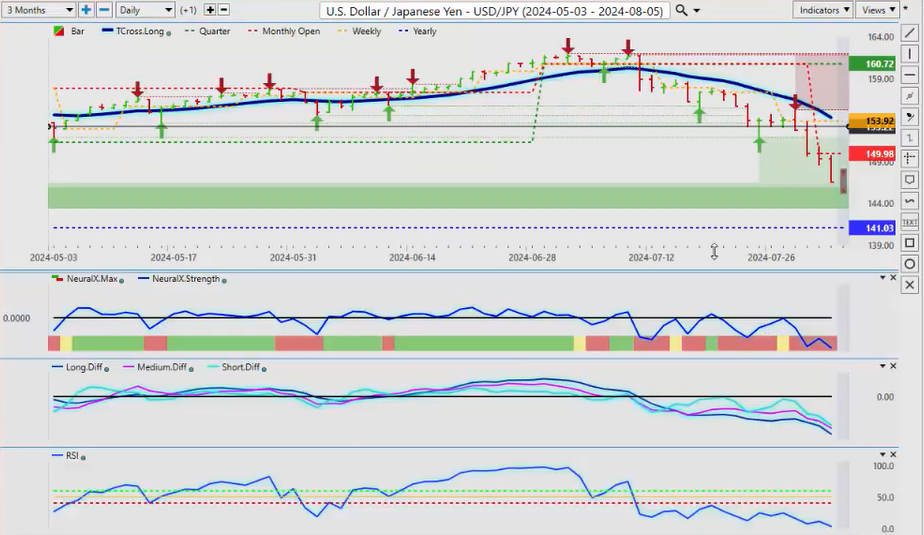
As with the US/Japanese Yen , uh, now the Bank of Japan is going to step on the pedal, they’re going to start, um, hiking. Why the Fed is cutting, the entire carry trade potentially could come unwound here, which I’ve talked about for weeks, if not months, on here. Be careful of buying this pair, because as fast as it went up, it can, it can go lower equally as quickly. So be very, very, very careful with this pair. We’re approaching the yearly opening price—141. I imagine we’re going to get to that very quickly, but be careful of this, this is again another point of confirmation of a trend change. When we break 141.03, now, as
U.S. Dollar versus Canadian Dollar
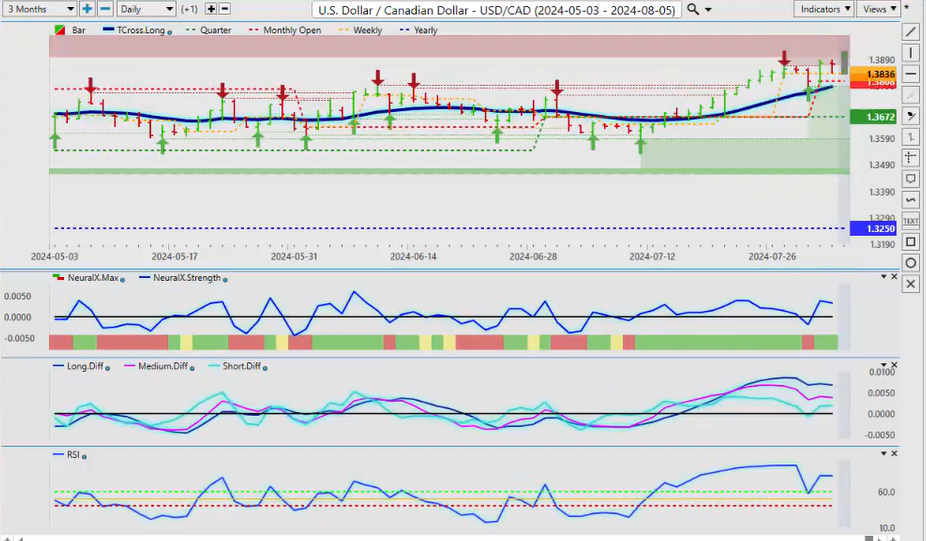
I’ve said with US/Canada , Aussie/US , New Zealand/US , if you’re buying these pairs, if you’re buying Aussie/US and you’re, let’s start with US/Canada first, excuse me, if you’re buying US/Canada , then you believe the stock market will go lower. I don’t believe that, uh, so be careful with that. We have a significant verified resistance high—138.65—another area to be very careful of, guys, of a bull trap up here. I believe there could be one, okay, so be very cautious of buying above that level because if they’re going to run stops, it’s going to be up here. S&P 500 , Nasdaq , all that, those, uh, DAX 30 , they, if they all start turning around Tuesday and Wednesday, then US/Canada is going to drop back to at least our T-cross long, which is coming in at 137.87, uh, that would be our, our line in the sand, uh. I will concede US/Canada has been very bullish this year for a number of different reasons, mainly the Bank of Canada cutting twice, a very sluggish Canadian economy, uh, so again, 132.50, that is potentially a year-end target for us, guys.
Australian Dollar versus U.S. Dollar
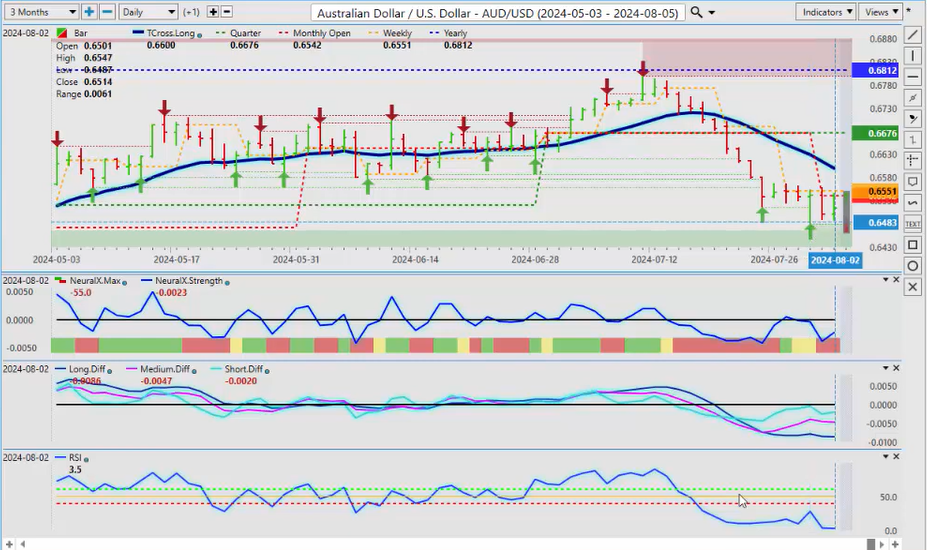
Okay, so again, if those stocks move higher, you’re watching the Aussie/US and the New Zealand/US for potential longs, uh, be, be very mindful of your Monday bar at the end of Monday’s trading, guy. Another little trick I can give you, look at the high and low of the Monday bar, and then on Tuesday, Wednesday, Thursday, Friday, look and see how it’s reacted to that Monday bar. Where is the price in relationship to the Monday bar? So when we look at this right now, we’ve got a verified low—6480—I believe we have some potentially good longs coming next week. The points of confirmation from that statement that I just made is not based on under the neural index only, it’s based on the neural index strength with a reverse check mark, an MA diff cross, and the RSI doesn’t have a heartbeat, so we’re, but the other indicators on Vantage Point do, and we connect that with our verified support low.
New Zealand Dollar versus U.S. Dollar
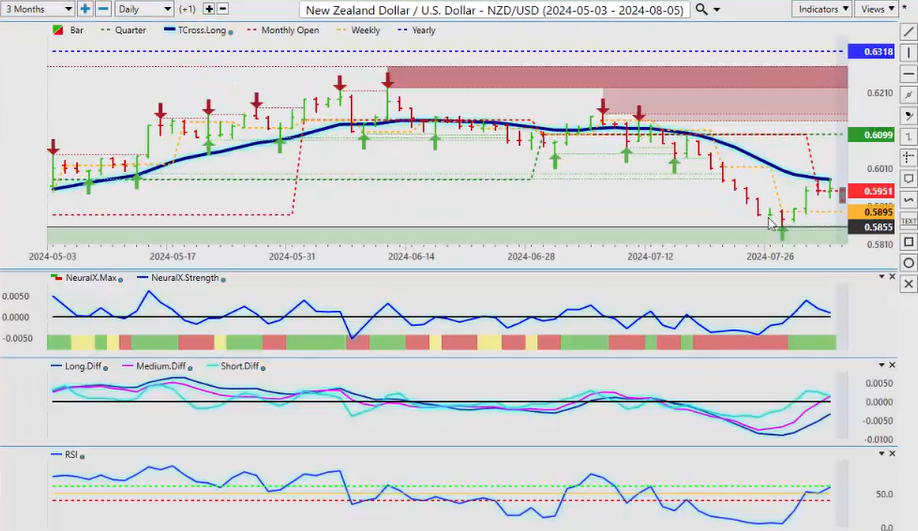
The same thing would apply to the Kiwi here, guys, and I would argue it was already in progress. The Kiwi was very, very overextended on shorts, and now they’re exiting them. So if we can get above our T-cross long next week at 59.80, I think you have a pretty decent long. So what I’m warning everyone that you need is, you need those stocks to turn around higher and get a little bit of risk on coming back into the market. So again, keep an eye on Bitcoin , keep an eye on the S&P , and they will, inner markets will always guide you in the direction of what the like trend is going to be. So, with that said, this is the Vantage Point AI Market Outlook for the week of August the 5th, 2024.

