Today we dive deep into the world of finance and bring you insights on blue-chip stocks – the backbone of the market. You know, the kind of stocks that carry a timeless charm, like a classic song that never gets old.
In the fast-paced world of finance, one term continues to stand tall, exemplifying stability and resilience – the blue-chip stock. These legendary equities have long been revered by investors for their steadfast performance and reliability. Today, we delve into the essence of blue-chip stocks, tracing their historical significance and exploring the characteristics that make them a prized addition to any portfolio.
So, what exactly is a blue-chip stock? Blue-chip stocks are shares of large, established companies renowned for their financial strength, impeccable reputation, and dominant position in their respective industries. They have withstood the test of time and have proven their mettle through various economic cycles, earning them the label “blue-chip.” Imagine it as a small share in a big success story – the kind of share that gives you the right to have a say in the company’s future. And trust me, when we say massive, we mean companies with high market capitalization, ones that have stood the test of time and earned themselves a solid reputation.

The term “blue chip” comes from poker, where the blue chip is worth the most money. And boy, are these stocks worth a lot in the investment world!
Now, let’s break down the characteristics that define these blue-chip companies. First off, they are the rockstars of the business world – highly well-known and reputable. You’ll recognize their names right away, as they’re often household names with a long legacy of success. At times of market volatility, blue-chip stocks stand firm like a beacon of hope for investors. Their robust financials and enduring market presence provide a sense of security amidst turbulent waters. That is not to say or imply that they are immune from large market declines, but rather that when the market is up, they usually outperform the market, and when the broader market is down, they usually do not fall as much.
But that’s not all ; they also boast a large market capitalization . That means their worth in the market is quite hefty, sometimes even in trillions. These are the behemoths that don’t shy away from the spotlight. In a significant shift, the threshold for entry into the S&P 500, Wall Street’s premier index, has been raised. Firms now require a market capitalization of no less than $13.1 billion to earn a spot on this esteemed list, marking an increase from the prior requisite of $11.8 billion. It’s important to note, however, that a dip below these market capitalization minimums does not automatically trigger an expulsion from the S&P indexes.
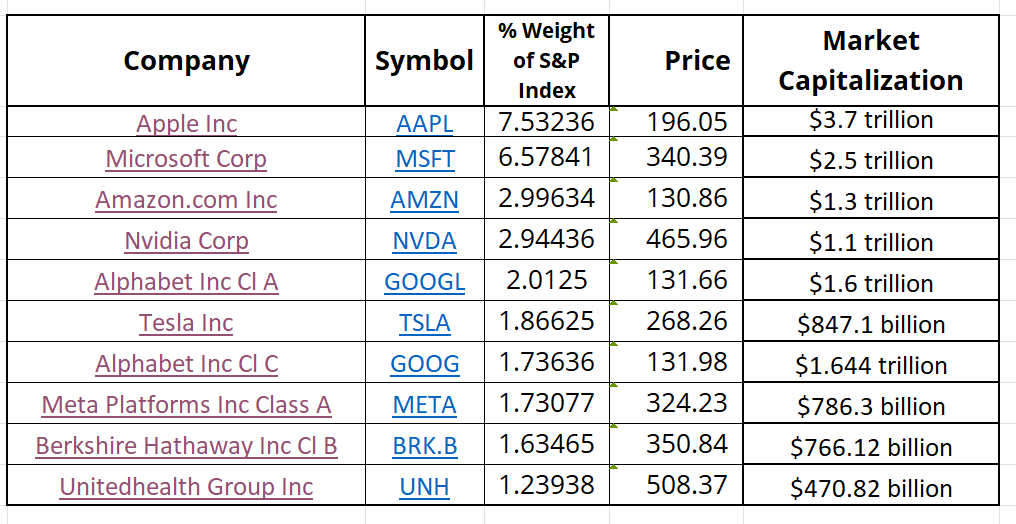
Listed below are the top 10 largest stocks in the S&P 500 Index which are considered blue chips.
Generally speaking, stocks are commonly classified into various categories based on different criteria. Here are the major classifications for stocks in general:
1 . **Sectors:** Stocks are often grouped into sectors based on the primary business activity of the companies. Common sectors include technology, healthcare, finance, consumer goods, energy, utilities, etc. Each sector represents a specific segment of the economy.
2. **Market Capitalization (Market Cap):** Market cap is a measure of a company’s size and is calculated by multiplying the total number of outstanding shares by the current stock price. Stocks are typically categorized into the following groups:
– **Large Cap:** Companies with a high market capitalization, usually valued at billions of dollars. Often considered more stable and less volatile compared to smaller companies.
– **Mid Cap:** Companies with a moderate market capitalization, falling between large and small cap. These companies often have growth potential and a higher risk than large-cap stocks.
– **Small Cap:** Companies with a relatively low market capitalization, usually worth a few hundred million dollars or less. Small-cap stocks tend to be riskier but can offer higher growth potential.
Traditionally Blue-Chip stocks are large cap stocks.
3. **Style:** Stocks can also be classified based on their investment style, including:
– **Growth Stocks:** Companies expected to have above-average growth in revenue and earnings. Investors are willing to pay a premium for their potential future growth.
– **Value Stocks:** Companies considered undervalued in the market, often characterized by low price-to-earnings (P/E) ratios or other valuation metrics. Investors seek these stocks for potential price appreciation.
– **Blend Stocks:** Companies that exhibit characteristics of both growth and value stocks, falling somewhere in between.
4. **Geography:** Stocks can be categorized based on the geographic region in which the company operates:
– **Domestic Stocks:** Companies based in the country where the stock exchange is located (e.g., US stocks for the New York Stock Exchange).
– **International Stocks:** Companies based in foreign countries but traded on domestic exchanges.
– **Global Stocks:** Companies with a significant presence and operations worldwide.
5. **Stock Exchange:** Stocks are traded on various stock exchanges around the world. Some common exchanges include the New York Stock Exchange (NYSE), NASDAQ, London Stock Exchange (LSE), Tokyo Stock Exchange (TSE), etc.
6. **Dividend Yield:** Stocks can be classified based on their dividend payment policies:
– **Dividend Stocks:** Companies that regularly distribute a portion of their profits to shareholders in the form of dividends.
– **Non-Dividend Stocks:** Companies that reinvest their profits back into the business instead of paying dividends.
7. **Risk Profile:** Stocks can be classified based on their risk level:
– **Blue-Chip Stocks:** Shares of large, well-established, and financially stable companies with a history of reliable performance.
– **Penny Stocks:** Stocks with incredibly low share prices, often trading at less than a dollar, and typically associated with smaller, riskier companies. Penny stocks are very illiquid because of their small market capitalizations and are prone to pump and dump schemes.
8. **Exchange Listing Status:**
– **OTC (Over-the-Counter) Stocks:** These stocks are not listed on major exchanges but are traded directly between parties over-the-counter. They may include smaller companies or those not meeting the requirements for exchange listing. The majority of OTC stocks trade on much lighter volumes and have much less liquidity than larger cap stocks.
Please note that the specific categories and criteria for classifying stocks may vary depending on the investment strategies and methodologies used by different financial institutions and analysts. Additionally, the stock market is dynamic, and new classifications or modifications to existing ones may emerge over time.
A good rule of thumb to follow for longer-term investors is that the smaller cap the stock is, usually the greater the risk and volatility. This is for many reasons. Small cap stocks have greater fluctuations because it takes less money to make them move. They also have higher spreads between the bid and ask price.
The blue-chip stocks also have a reliable history of sustained growth. They’re like those top-notch athletes who consistently perform at their best. And the cherry on top – they’re part of major indices like the S&P 500, Nasdaq 100, or the Dow Jones Industrial Average. When you see them on these indices, you know you’re dealing with the crème de la crème of the financial world. Due to their size, market dominance, and established business models, blue-chip stocks typically carry lower risk compared to smaller companies or startups.
Why should you be interested in these blue-chip wonders? Well, they offer some major advantages over other assets. For starters, they’re more stable than your average stock, thanks to their long-standing reputation and solid financials. In times of economic downturns, they can be like a safe harbor in a storm – holding steady and generating stable profits, even though they might experience some temporary declines.
What’s more, they tend to be the first to bounce back in a bear market. Now, there’s no official study that proves it, but you can’t argue with their history of stability.
Today the bluest of the blue chips are the MMATANA stocks. I am referring to Microsoft ($MSFT), Facebook ($META), Apple ($AAPL), Tesla ($TSLA), Amazon ($AMZN), NVIDIA ($NVDA) and Alphabet ($GOOGL). These stocks have also earned the name the “Magnificent Seven” because of their consistent ability to outperform the market. These industry giants have consistently delivered impressive financial results and maintained their leadership positions.
An amazingly simple and reliable metric which anyone can do when evaluating an investment or trading opportunity is to simply calculate the statistical volatility of the stocks in question. All that is needed to do this is the current closing price, as well as the 52-week high and the 52-week low.

A rule of thumb regarding statistical volatility is that blue chip stocks will traditionally have less volatility than smaller cap stocks. Statistical volatility is a commonsense metric. It is not predictive in nature and simply tells a trader or investor that should the next 52 weeks be like the past 52 weeks you can expect the asset to trade within the statistical volatility range higher and or lower than the current price.
Blue-chip stocks are often favored by long-term investors who seek consistent growth and wealth preservation over extended periods. Analyzing a blue-chip company’s revenue and earnings growth over time provides crucial insights into its ability to adapt and succeed in changing market conditions. Healthy profit margins demonstrate a blue-chip company’s efficiency and competitive advantage.
Liquidity is not an issue for blue chip stocks either. With their enormous market capitalization, there’s plenty of liquidity, making it easy to buy and sell shares. You won’t get stuck in a jam here!
And here’s the kicker – investors trust them. With their industry leadership and household names, there’s a certain level of investor confidence that these companies won’t go down the drain anytime soon.
Many blue-chip stocks even go the extra mile and pay dividends. That’s like getting a little extra treat with your investment, as they share their profits with shareholders in regular payments, often on a quarterly basis.
A dividend is a payment made by a corporation to its shareholders, typically in the form of cash or additional shares of stock. It is a way for companies to distribute a portion of their profits or earnings back to their investors as a reward for holding their shares. Dividends are often paid on a regular basis, such as quarterly or annually, and the amount is usually determined by the company’s board of directors.
Dividends are one of the primary ways in which shareholders can benefit financially from their investments in a company. By receiving dividends, shareholders can enjoy a steady stream of income, especially from well-established companies with a history of consistent dividend payments.
Researching historical dividend payments for a large-cap stock is relatively straightforward and can be done using various financial websites and stock market data platforms. Here’s a step-by-step guide on how to find this information:
1. Choose a Financial Website:
Start by selecting a reputable financial website that provides comprehensive stock market data. Some popular options include Yahoo Finance , Google Finance , Bloomberg, or CNBC .
2. Search for the Stock Ticker Symbol:
Enter the stock ticker symbol of the large-cap company you want to research. The ticker symbol is a unique abbreviation assigned to each publicly traded company. You can find the ticker symbol on most financial news websites or by doing a quick internet search with the company’s name and “stock ticker.”
3. Access the Stock’s Profile or Summary:
Once you’ve entered the stock ticker, you’ll be directed to the stock’s profile or summary page. This page will provide a wealth of information about the company, including its market capitalization, historical stock performance, and financial data.
4. Check the Dividend History:
Look for a section on the stock’s profile page that specifically mentions dividends or dividend history. On many financial websites, you’ll find a dedicated section that lists the company’s dividend payouts over the years.
5. Review Dividend Payment Dates and Amounts:
In the dividend history section, you’ll find a table or list displaying the dates on which the company paid dividends, along with the corresponding dividend amounts. This information will give you an overview of the stock’s historical dividend payments.
6. Analyze Dividend Growth and Consistency:
Pay attention to the trend of dividend payments over the years. Has the company consistently paid dividends without interruption, or were there any periods where dividends were suspended or reduced? Additionally, check if the dividends have been growing steadily over time, which is a positive sign for investors.
7. Explore Other Sources:
In addition to financial websites, you can also access dividend information from the company’s official investor relations page or annual reports. These sources often provide more detailed information about the company’s dividend policy and future dividend expectations.
By following these steps, you can easily research and assess the historical dividend payments of a large-cap stock.
It’s important to note that not all companies pay dividends. Some may choose to reinvest their profits back into the business to fund growth and expansion, while others may be in the early stages of development and prioritize reinvestment over dividend payments.
For investors seeking income and stability, dividend-paying stocks can be an attractive option. However, it’s essential to consider other factors such as the company’s financial health, growth prospects, and overall investment objectives when making investment decisions.
One other especially important aspect of Blue-Chip Stocks is the fact that they always have overly broad Wall Street Analyst coverage.
For example, Apple ($AAPL) traditionally has around 40 to 50 top Wall Street analysts dissecting its every move and announcement. You can easily access how many analysts are covering a stock by simply going to your favorite search engine and requesting “Wall Street Analysts Forecasts for {STOCK NAME}”.
When a stock has “broad analyst coverage” on Wall Street, it means that a significant number of financial analysts from various investment firms and research institutions regularly study and analyze the company’s financial performance, prospects, and overall business operations. These analysts delve deep into the company’s financial statements, industry trends, competitive landscape, and other relevant factors to provide insights and recommendations about the stock’s potential value and future trajectory.
The importance of broad analyst coverage for long-term investors can be understood through the following key points:
1. Information Richness: Having numerous analysts covering a stock leads to a wealth of information and research reports available to investors. This comprehensive analysis can offer a broader and more detailed understanding of the company’s strengths, weaknesses, opportunities, and threats.
2. Diverse Perspectives: Different analysts may have varying opinions and forecasts about the stock. This diversity of perspectives allows long-term investors to consider a range of viewpoints before making their investment decisions. It also helps investors gain a more balanced view of the stock’s potential risks and rewards.
3. Enhanced Decision Making: The availability of research and analysis from multiple sources enables long-term investors to make more informed and data-driven decisions. Investors can use this information to assess the stock’s long-term growth prospects and align their investment strategy accordingly.
4. Market Sentiment and Consensus: Analyst coverage often leads to the formation of a consensus target price for the stock. This target price represents the average price target determined by various analysts. Long-term investors can use this consensus as a reference point to gauge market sentiment and assess whether the stock is undervalued or overvalued.
5. Monitoring Performance: Analyst coverage typically includes regular updates and earnings forecasts. Long-term investors can track these updates to evaluate how the company is performing relative to analysts’ expectations. Consistent monitoring helps investors make necessary adjustments to their investment strategy based on the company’s progress.
6. Risk Mitigation : Broad analyst coverage can help long-term investors identify potential risks and challenges faced by the company. Understanding these risks allows investors to be proactive in managing their investment portfolio and reducing exposure to companies with significant uncertainties.
7. Long-Term Growth Assessment : For investors looking to hold stocks for the long term, comprehensive analyst coverage can aid in assessing a company’s ability to sustain growth and maintain a competitive edge in its industry.
While broad analyst coverage provides valuable insights, it’s crucial for long-term investors to conduct their due diligence and critically evaluate the analysts’ reports and recommendations. Analysts can sometimes have biases or conflicts of interest, and their views may not always align with an individual investor’s goals or risk tolerance.
In conclusion, broad analyst coverage offers long-term investors a treasure trove of information, diverse perspectives, and data-driven insights that can help them make more informed decisions, navigate market dynamics, and identify promising investment opportunities for the long haul.
To evaluate whether a stock is truly a blue-chip, you should consider factors like potential dividend payments, the company’s bond ratings, earnings growth, and their ability to manage debt. After all, you don’t want to bet on a stock that’s all hype and no substance.
When it comes to buying blue-chip stocks, it’s pretty much like buying any other stock. The process is simple – you’ll need an online brokerage account through a platform like Robinhood or Think or Swim.
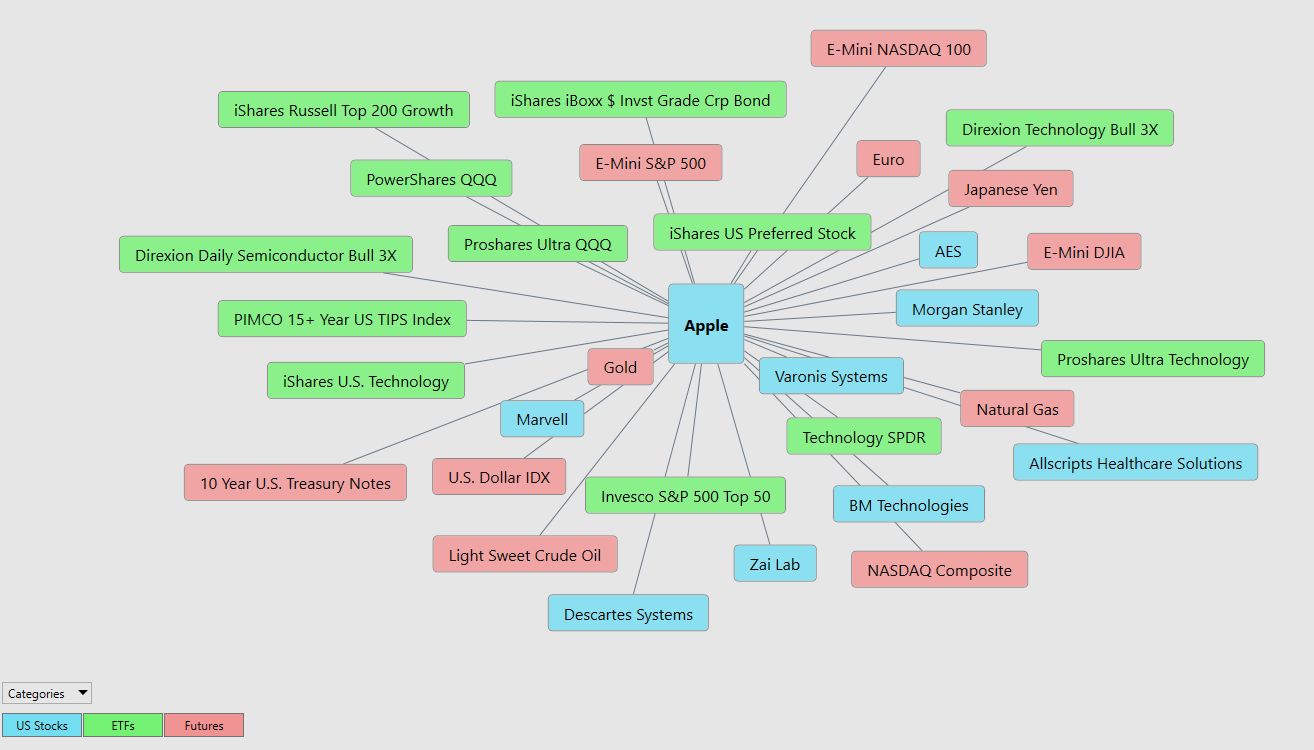
But if you’re not into handpicking individual blue-chip stocks, don’t worry, there’s an easier route. You can opt for blue-chip funds like index funds or exchange-traded funds (ETFs). These funds offer a low-cost way to get exposure to a wide array of blue-chip companies, all in one go. One of the fantastic features of the Vantagepoint A.I. software is the intermarket analysis capabilities which will show traders which ETFs are heavily correlated to the price action of a particular stock.
So, there you have it, folks. Blue-chip stocks, the solid performers in a constantly changing market. In the realm of finance, blue-chip stocks remain a beacon of reliability and resilience. Their time-tested history, coupled with the advantages they offer, continues to attract investors seeking stability and long-term growth. By evaluating crucial factors, investors can identify the cream of the crop and make informed decisions that stand the test of time. So, as you chart your investment journey, consider these stalwart equities as pillars of strength in your diversified portfolio. Remember, there are no guarantees in the investment world, but these blue-chip wonders have a reputation for weathering the storm and coming out stronger on the other side. If you’re looking for some stability in your investment journey, you might just find it with these reliable blue-chip stocks. Investing in blue-chip stocks offers potential rewards such as stability, reliable dividends, and lower risk compared to other stocks. However, these stocks are not immune to risks, including market and economic fluctuations, industry-specific challenges, and company-specific issues. For longer-term investors, having broad analyst coverage is essential as analysts thoroughly analyze these risks, providing diverse perspectives and in-depth insights. Their research helps investors make informed decisions, navigate uncertainties, and monitor the stocks’ performance, aiding in the assessment of long-term growth prospects and mitigating potential risks.
When tough markets arrive the most empowering question a trader can ask is, who is winning? Or… what is working? That question will almost always lead you to the BLUE CHIPS.
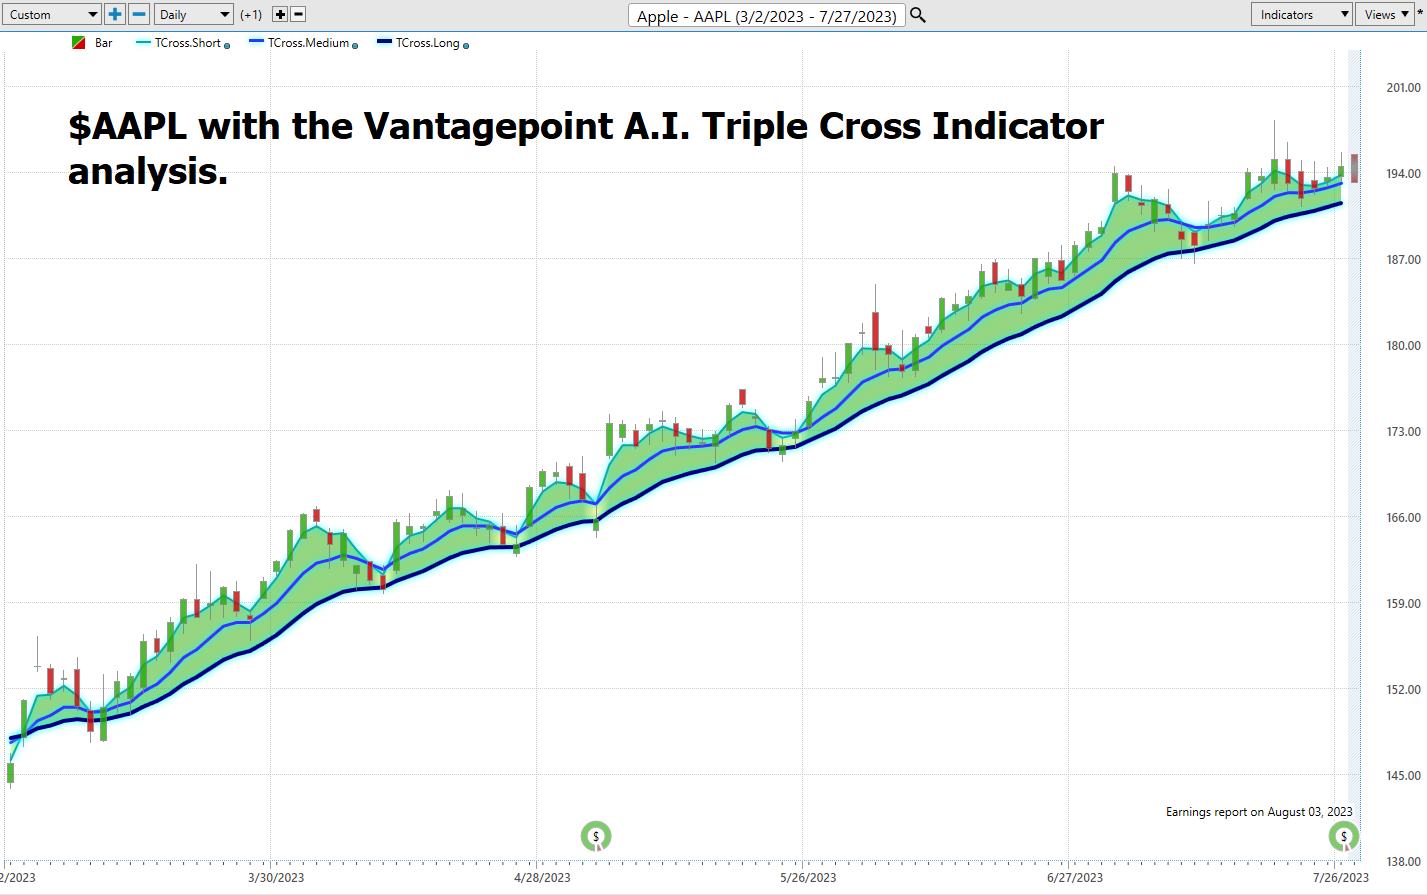
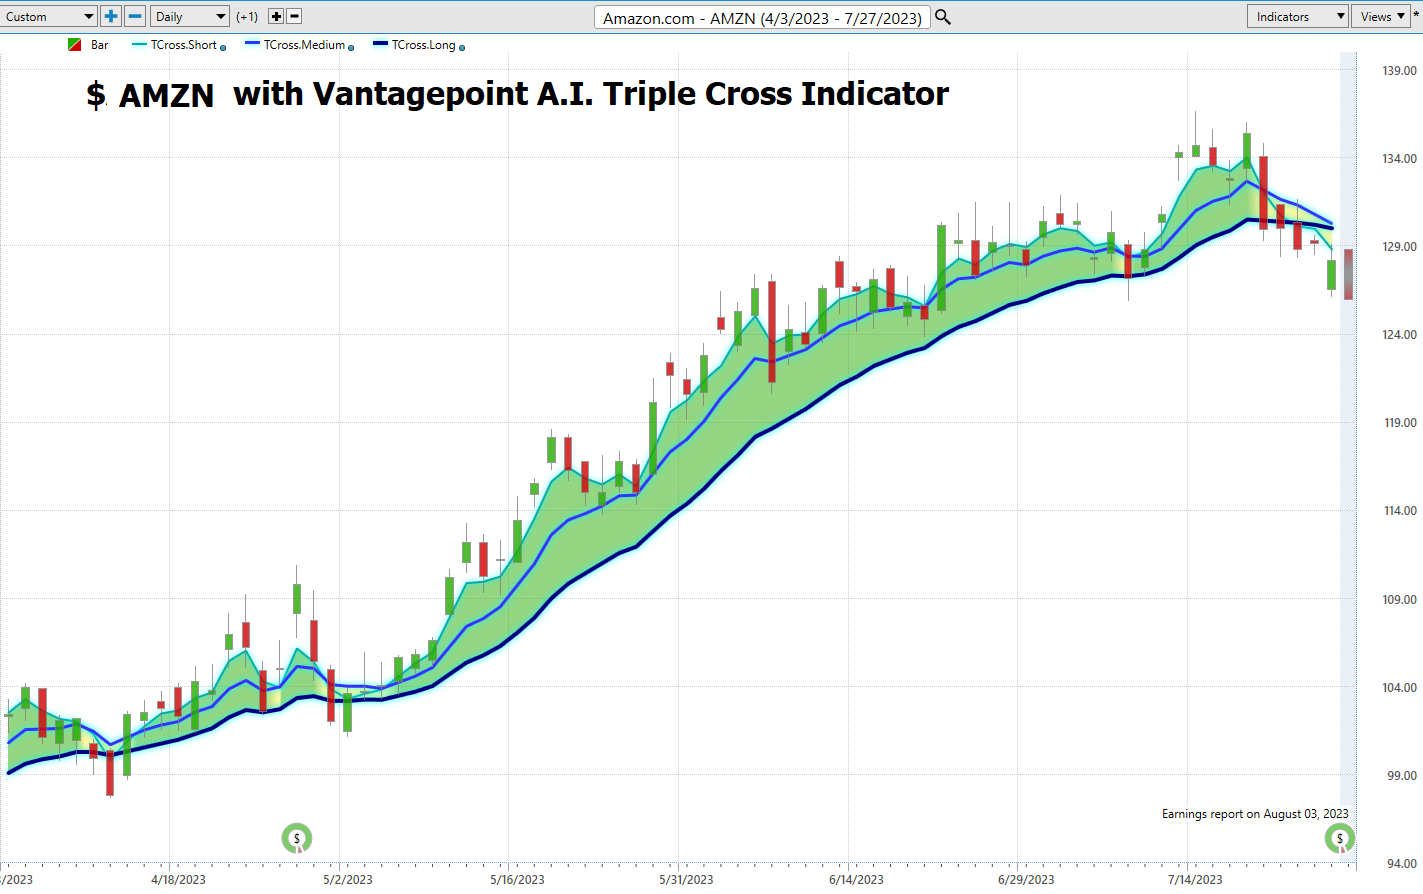
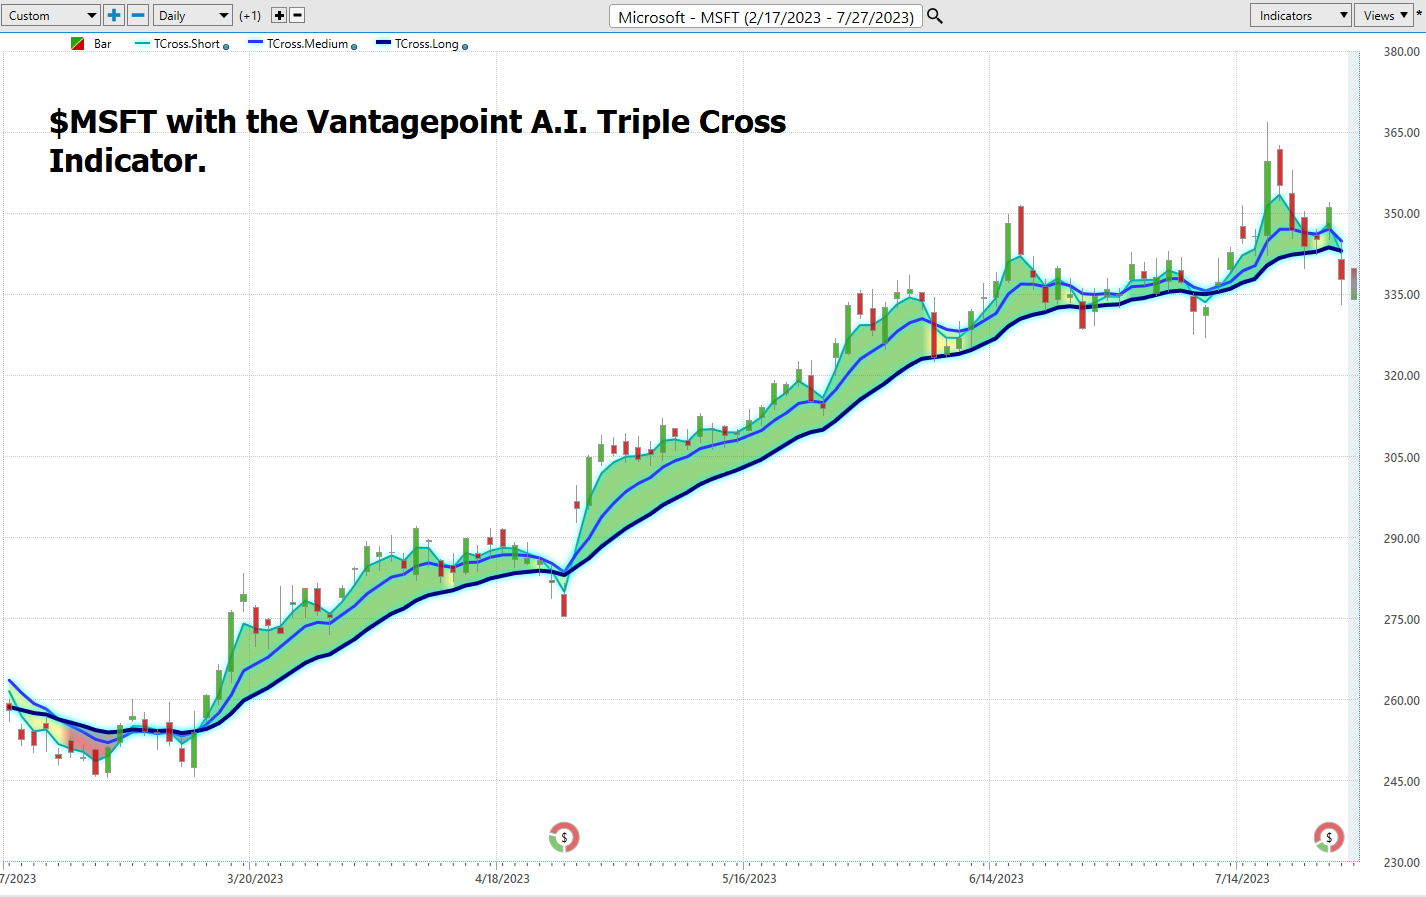
Here is the performance of $AAPL, $AMZN and $MSFT over the last few months with the Vantagepoint A.I. Triple Cross Indicator and forecast.
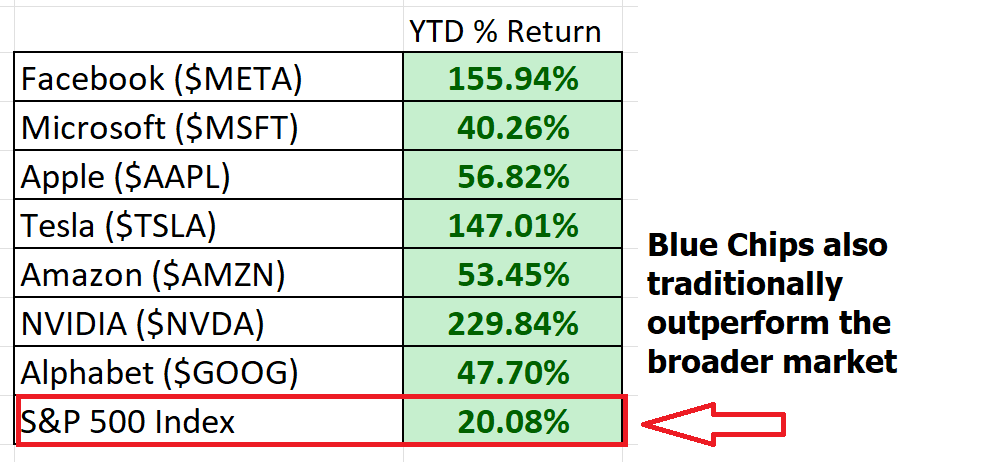
Another important rule of thumb is that BLUE CHIP stocks, after meeting the criteria already mentioned in this article, tend to outperform the broader market.
As an investor and trader, how do you go about making sense of it all?
As a trader, the most important question on your mind is “How do I protect the purchasing power of my portfolio?” You need to become obsessed with who is winning and what is working. That is how you develop your fierce loyalty to the trend.
Everything else is just noise.
Finding value is becoming a completely consuming activity on the part of traders and investors. The target moves quickly based upon too many factors that remain unseen to the naked eye.
It’s all about getting on the right side, of the right trend at the right time.
Most traders have problems with the timing of their trades.
It’s all about who has the best tools. Artificial intelligence excels at keeping traders on the right side of the right trend at the right time.
We live in unique times. The Printing Press is diluting the value of our money and ruthless dictators whom we completely disagree with are backing their currency with hard assets in their attempt to destroy the effect inflation will have on their citizens.
Everyone is aware if the money supply grows 10% you must grow your portfolio by that amount just to break even when you look at your purchasing power.
The only way to make sense of the madness that is our current economic environment is through the power of artificial intelligence, neural networks, and machine learning. In trading, the only thing that matters is price. It is what creates wealth or devastates your trading account.
My reality is always formed by what I see, hear, feel, and understand. This is why I use artificial intelligence , neural networks, and machine learning to guide my trading decisions.
Are you capable of finding those markets with the best risk/reward ratios out of the thousands of trading opportunities that exist?
Knowledge. Useful knowledge. And its application is what A.I. delivers.
You should find out. Join us for a FREE, Live Training. We’ll show you at least three stocks that have been identified by the A.I. that are poised for big movement… and remember, movement of any kind is an opportunity for profits!
Discover why Vantagepoint’s artificial intelligence is the solution professional traders go-to for less risk, more rewards, and guaranteed peace of mind.
Pay Attention.
Visit with us and check out the A.I. at our
It’s not magic. It’s machine learning.
Make it count.
THERE IS A SUBSTANTIAL RISK OF LOSS ASSOCIATED WITH TRADING. ONLY RISK CAPITAL SHOULD BE USED TO TRADE. TRADING STOCKS, FUTURES, OPTIONS, FOREX, AND ETFs IS NOT SUITABLE FOR EVERYONE.IMPORTANT NOTICE!
DISCLAIMER: STOCKS, FUTURES, OPTIONS, ETFs AND CURRENCY TRADING ALL HAVE LARGE POTENTIAL REWARDS, BUT THEY ALSO HAVE LARGE POTENTIAL RISK. YOU MUST BE AWARE OF THE RISKS AND BE WILLING TO ACCEPT THEM IN ORDER TO INVEST IN THESE MARKETS. DON’T TRADE WITH MONEY YOU CAN’T AFFORD TO LOSE. THIS ARTICLE AND WEBSITE IS NEITHER A SOLICITATION NOR AN OFFER TO BUY/SELL FUTURES, OPTIONS, STOCKS, OR CURRENCIES. NO REPRESENTATION IS BEING MADE THAT ANY ACCOUNT WILL OR IS LIKELY TO ACHIEVE PROFITS OR LOSSES SIMILAR TO THOSE DISCUSSED ON THIS ARTICLE OR WEBSITE. THE PAST PERFORMANCE OF ANY TRADING SYSTEM OR METHODOLOGY IS NOT NECESSARILY INDICATIVE OF FUTURE RESULTS. CFTC RULE 4.41 – HYPOTHETICAL OR SIMULATED PERFORMANCE RESULTS HAVE CERTAIN LIMITATIONS. UNLIKE AN ACTUAL PERFORMANCE RECORD, SIMULATED RESULTS DO NOT REPRESENT ACTUAL TRADING. ALSO, SINCE THE TRADES HAVE NOT BEEN EXECUTED, THE RESULTS MAY HAVE UNDER-OR-OVER COMPENSATED FOR THE IMPACT, IF ANY, OF CERTAIN MARKET FACTORS, SUCH AS LACK OF LIQUIDITY. SIMULATED TRADING PROGRAMS IN GENERAL ARE ALSO SUBJECT TO THE FACT THAT THEY ARE DESIGNED WITH THE BENEFIT OF HINDSIGHT. NO REPRESENTATION IS BEING MADE THAT ANY ACCOUNT WILL OR IS LIKELY TO ACHIEVE PROFIT OR LOSSES SIMILAR TO THOSE SHOWN.

