Over the past few months, I’ve been spending a lot of time studying USDEBTCLOCK.org . USDEBTCLOCK.org serves the purpose of providing real-time data and statistics related to the United States national debt, aiming to inform the public about the country’s growing financial obligations. The website displays various metrics, including the current national debt figure, debt per capita, and debt as a percentage of GDP. Its structure consists of a dynamic, continuously updating dashboard that offers a visual representation of the nation’s fiscal situation, helping users to grasp the enormity and implications of the U.S. debt in a straightforward manner.
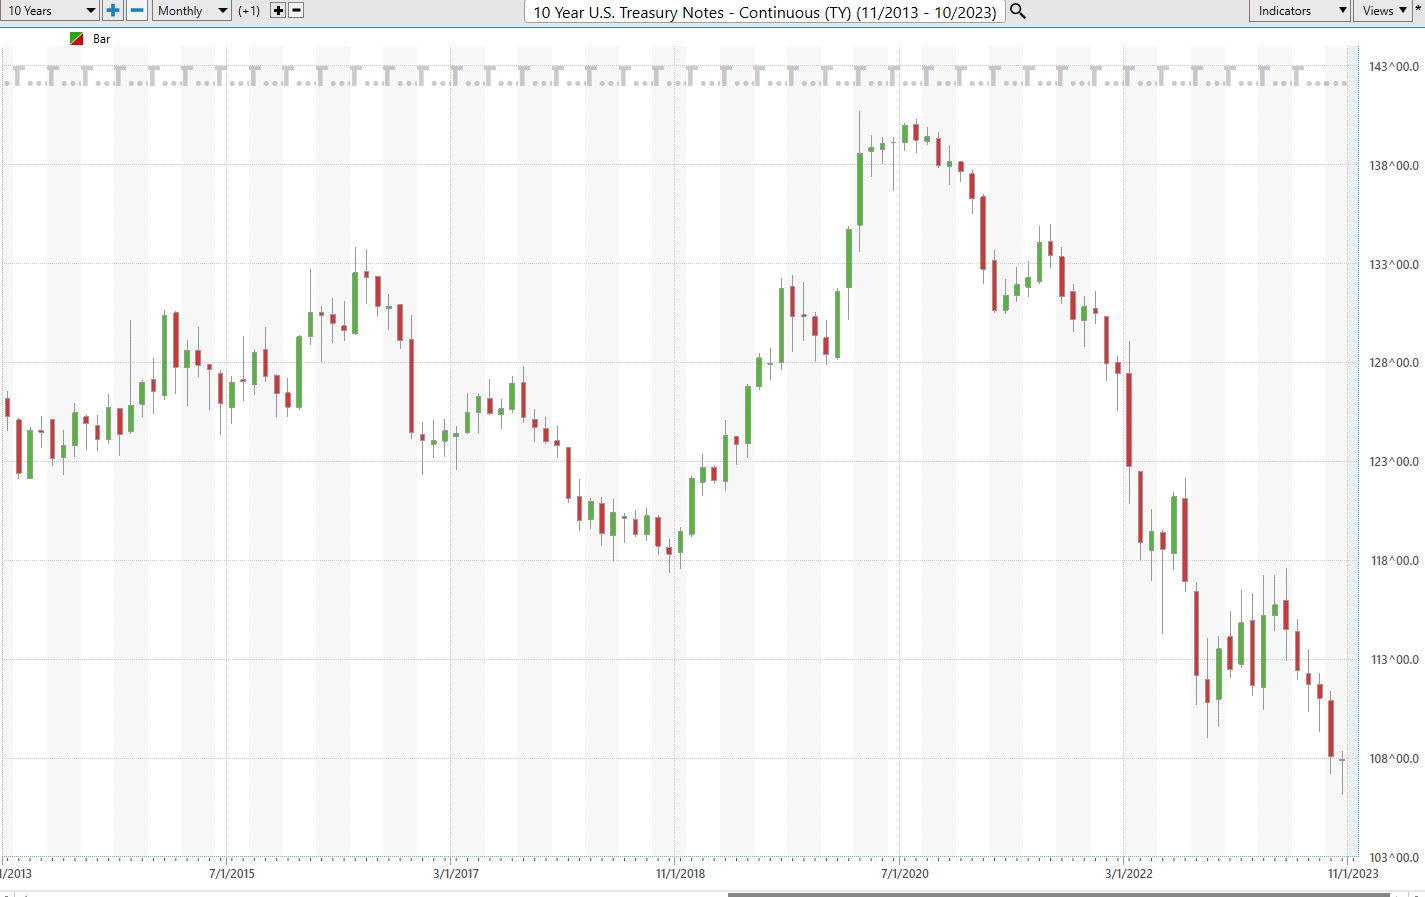
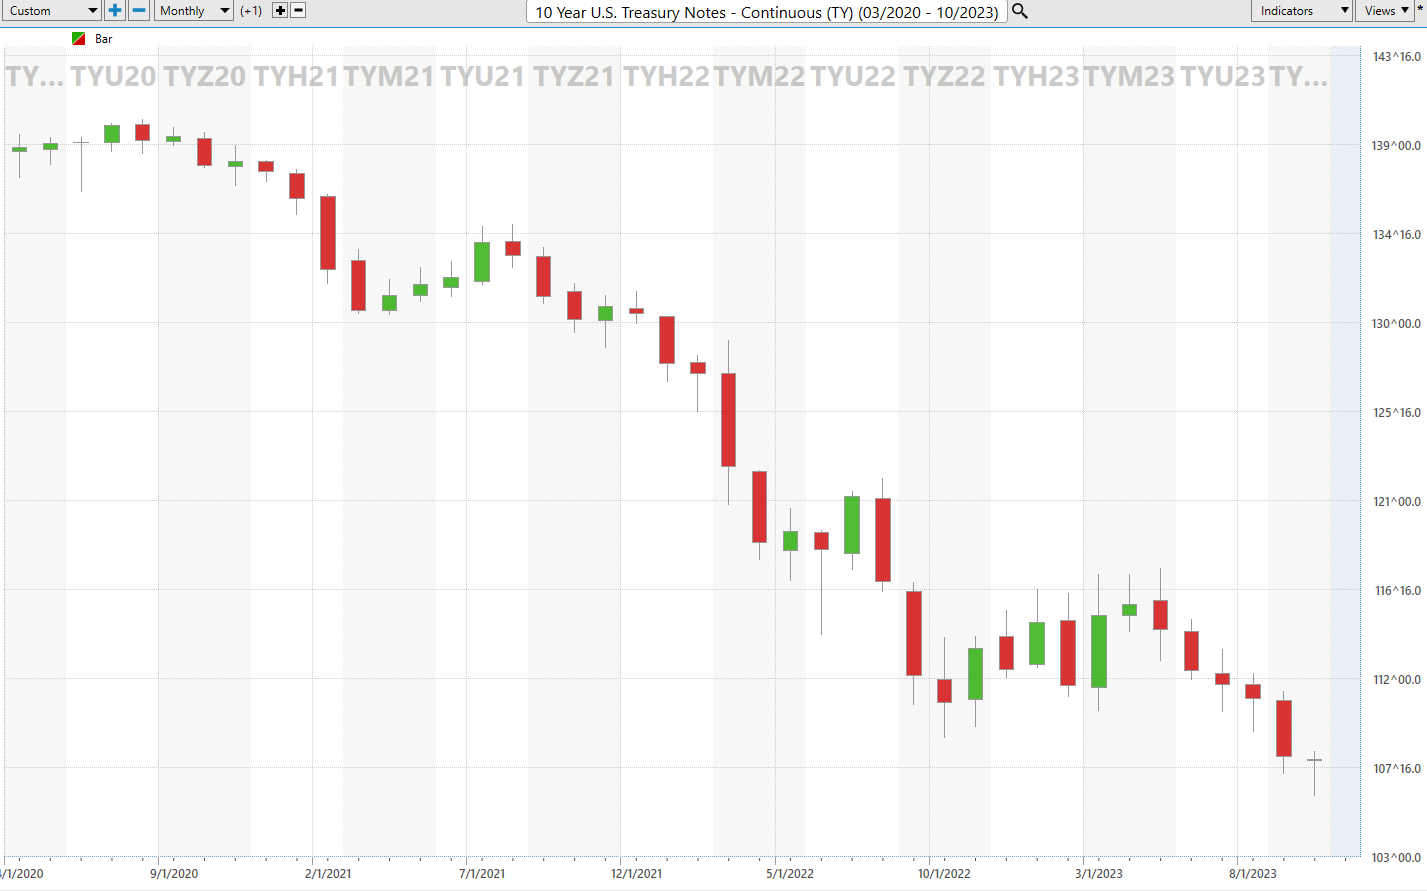
I’m troubled and worried. More importantly, I’m not alone as evidenced by the sharp bond market decline over the past few weeks. For several years, I’ve written extensively warning traders and investors of the toxic nature of US Debt is an inflationary environment. Regardless of our media’s narrative the situation is not improving, and we are seeing investors back away from tying their savings up in U.S Treasuries. Since March 2020, U.S. Treasuries which have been considered the gold standard of debt obligations have lost 46%. In this article we will discuss this ugly reality and its implications for traders and investors.
Let’s look at USDEBTCLOCK.org to get a quick understanding of why US Treasuries are no longer attractive investment vehicles.
The first thing I want to point out is that DEBT is increasing very rapidly, but what is equally troubling is that revenues are actually going backwards. Meaning that revenue estimates are being drastically lowered because of corporate layoffs and slowdowns in the economy.
In the world of finance what all students are taught is that HEALTH is defined by a simple metric called the interest coverage ratio.
The interest coverage ratio (ICR) is a financial metric primarily used to determine how easily a country can pay its interest expenses.
**Interest Coverage Ratio (ICR) for a Country:**
(Tax Revenues – Entitlements – Defense) / Interest Expense
When you plug the necessary values into this simple equation you end up with a very troublesome result.
Let me explain.
US Tax Revenue = $4.3 trillion
Minus: Mandatory Outlays = $4.1 trillion
Minus: Defense Spending = $877 billion
That results in a total of $4.977 trillion in spending between Social Security. Medicare and Defense. Since total tax revenue is only $4.3 trillion, it results in a deficit of negative $677 billion even before we look at paying interest on the debt.
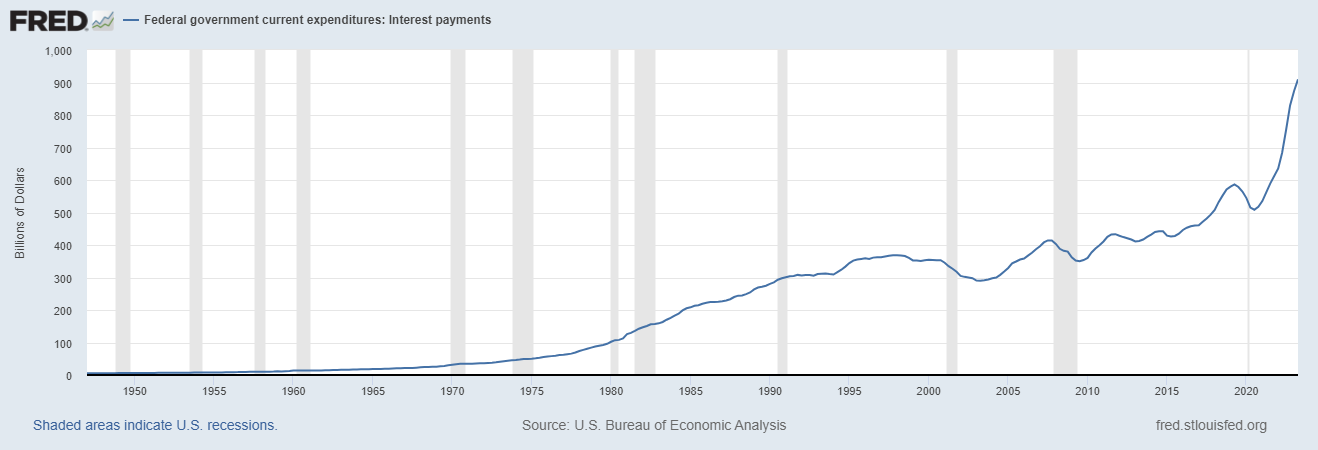
In 2022 Federal Interest on the US Debt amounted to $500 billion. This was all financed at interest rates substantially lower than the current interest rate environment. Also, the Congressional Budget Office estimates that roughly $15 trillion in Treasury obligations will come up for renewal in the next 18 to 36 months.
Even if we give the Congressional Budget Office the benefit of the doubt, it still doesn’t look so good.
Why?
Mandatory spending + Military spending > Revenues
Regardless how you analyze the balance sheet of the United States we have to conclude that the United States has become a ZOMBIE country. A “zombie” refers to a financially distressed entity that is able to continue operating only because it can service its debt interest payments, but it cannot pay off its principal debt. Zombies survive by borrowing more money to cover their existing obligations, essentially postponing their inevitable collapse.
I know that sounds like hyperbole. However, keep in mind that these figures that I’ve published are BEFORE the United States begins funding the Israel/Hamas war. It’s very safe to assume that military spending will dramatically increase based upon these increased conflicts. Thus, the deficits will WIDEN.
Here is the chart from the Federal Reserve of St. Louis showing interest rate payments.
The chart has gone parabolic!
Let’s break it down: running a government financially isn’t much different from running a business. You got revenues, you got expenses, and sometimes you must borrow a buck or two in the form of debt.
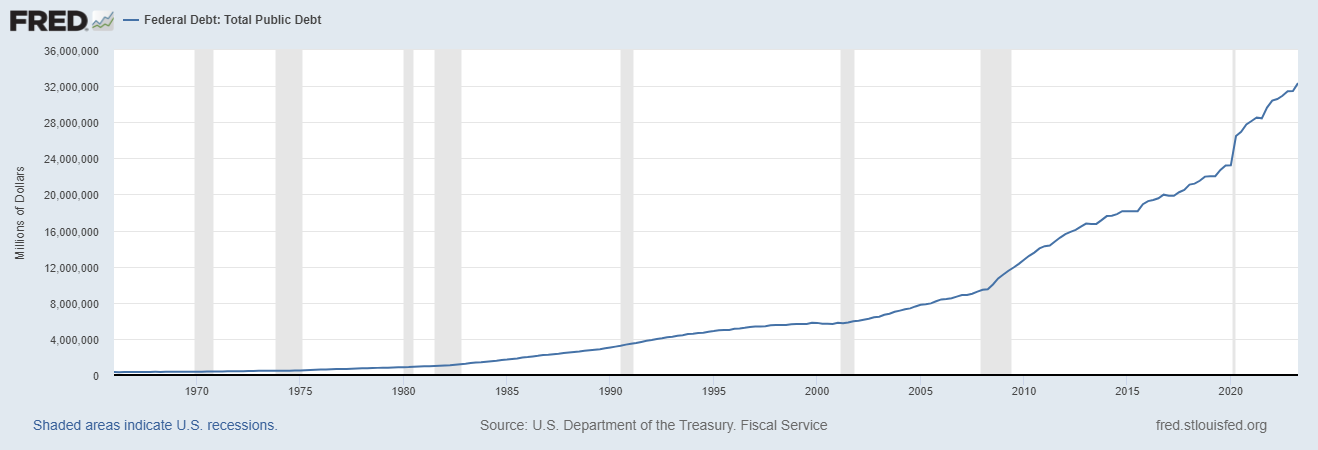
But, because our national debt has skyrocketed by over 600 billion dollars in just one month! That’s a whopping $20 billion every single day or $833 million every hour. We’re now sitting on a colossal $33.65 trillion-dollar debt, it’s hard to fathom how insanely fast this train is chugging along.
About 95% of U.S. cash comes from good old-fashioned taxes, like income taxes, corporate taxes, payroll taxes, and the like. The rest comes from things like estate and gift taxes, customs duties, and whatnot. Like a business, the dough has to cover all the expenses, from infrastructure to defense to entitlements, and the interest on that massive debt.
But here’s the rub: if a government’s running in the red, it’s got a few options. It can cut spending (not likely), boost GDP (maybe through a war, but that’s got its own problems), or raise taxes (ouch, that hurts businesses and growth). The easy way out? Just pile on more debt to cover the budget. But hold on tight, ’cause this path can lead to big trouble, just like a company drowning in debt.
Now, corporations can’t get away with too much debt, but countries, well, they’ve got a bit more wiggle room before investors raise an eyebrow.
Let me tell you something about these zombies in the financial world. They’re like the walking dead out there, struggling day in and day out, trying to stay afloat while being drowned in debt, and desperately relying on those easy borrowing terms to keep their heads above water. Thanks to the rock-bottom interest rates that have been haunting us since the 2008 financial crisis, these firms have been hanging on by a thread, refinancing their debts under some pretty favorable conditions.
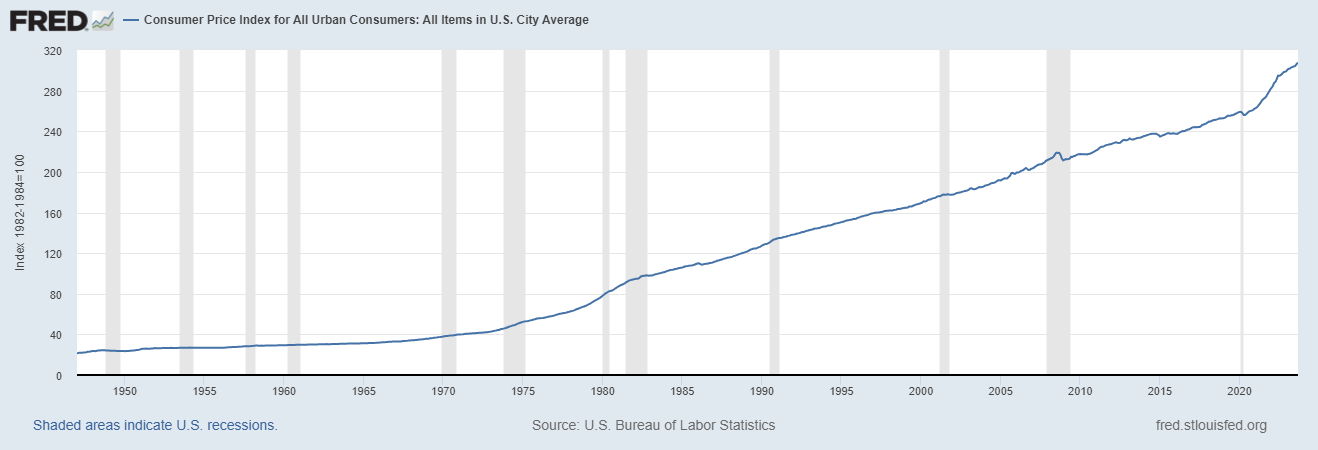
But let’s dig into the nitty-gritty. Just last week, the Consumer Price Index skyrocketed to a staggering 3.7%, while the yield on those 10-Year Treasuries shot up to a whopping 4.9%. Now, for those folks who might disagree with my take on this, they can park their hard-earned money in good old Uncle Sam’s bonds and earn a measly 1.2% a year – that’s assuming the bond market and inflation don’t go totally bonkers. But hold on a second, those very same Treasuries have taken a gut-punching 46% hit since March 2020.
Here is a chart of the Consumer Price Index. Over the last several years we have been told by Treasury Secretary Janet Yellen and Fed Chair Jerome Powell that inflation was moderating. Does the chart below resemble something that is moderating? Not in my dictionary!
You see, the Federal Reserve’s Zero Interest Rate Policy, or ZIRP, was supposed to be our knight in shining armor during economic crises. But guess what? It fell flat on its face. They slashed those interest rates down to near-zero levels, thinking it would make borrowing a walk in the park for businesses and regular folks, sparking spending and investments. It was also meant to chase away the scary ghost of deflation and give banks a gentle push to lend instead of hoarding stacks of cash. And, of course, it was supposed to be a lifeline for those struggling financial institutions to get back on their feet.
Well, here we are today, stuck with these zombies, living in a sort of weird twilight zone between life and death. It’s like they’re in a coma but not quite, barely hanging on and refusing to fade away gracefully. These zombies have been thriving on cheap credit, but here’s the kicker, folks: cheap credit isn’t so cheap anymore.
Interest rates have shot through the roof, leaving these undead creatures scrambling for dear life. And let me tell you, their stubborn persistence isn’t just a problem for themselves – it’s tying up resources that could be put to far better use in productive and innovative ventures. They’re not just robbing from our present; they’re stealing our future right from under our noses.
So, there you have it, the saga of the zombie economy. It’s high time for these undead financial institutions to face the music and allow our economy to breathe once again.
You have to borrow more to make those interest payments . And guess what? That just hikes up your interest expenses, making the ratio even worse. It’s like having a credit card balance you can’t pay off, so you get another card, and the cycle goes on.
It’s the same deal for a country stuck in a deficit: more debt means higher interest, which leads to even bigger deficits.
Investors lose faith, interest rates rise, and boom— the dreaded debt spiral.
Now, let’s look at Uncle Sam’s budget. Even by giving the benefit of the doubt, it’s not looking too rosy. We’re talking about interest payments that are gobbling up our revenues and then some.
So, what’s the Fed going do when we’re in a recession? Cut interest rates and print money, of course.
But here’s the rub: the national debt’s ballooning, so printing more money just makes it worse. We’re on track to hit a mind-boggling $50 trillion dollars by 2030 if we keep up this growth rate, and many experts now believe that estimate is far too conservative.
The US is also footing the bill for international conflicts in Ukraine and Israel, with no clear goals or end dates in sight. More financial strain on top of an already grim outlook.
With rising interest rates and the debt growing like a wildfire, it’s like a financial perfect storm. It’s even worse if we’re heading into a recession, with less tax revenue and all that. And don’t forget, we’re spending on international conflicts too, with no clear endgame in sight.
In my book, it is a completely terrifying situation to acknowledge that the United States cannot cover its debt obligations any longer.
Trust me, that should change your trading calculus as well because this reality is going to have a dramatic effect on the price action in markets.
What does all of this mean to you the trader and investor?
I have long contended that the strongest trends you will ever find are those markets that are consistently making 10-year highs and 52-week highs simultaneously. These are the places where investors want to be. They wreak of growth, innovation, optimism and are always breaking new ground.
However, the inverse is also true. The markets which all seasoned investors and traders either shun or short are those markets which are making 10-year lows and 52-week lows simultaneously. These markets resemble a deer in the headlight of an oncoming train. These markets typify problems which are not being solved and continue to worsen.
Unfortunately for US Treasuries they find themselves on this short list at the present moment.
Where are your safe havens?
During times of economic turmoil and uncertainty, the instinct for many investors is to seek refuge in safe havens. These financial sanctuaries provide a sense of security and stability when traditional investment markets are in disarray. One common option for individuals and institutions seeking safety is Treasury Instruments, particularly U.S. Treasury bonds. These government-backed securities are often perceived as one of the safest assets in the world due to the creditworthiness of the U.S. government. During crises, investors flock to Treasury bonds as they offer a guaranteed return of principal and interest payments, making them a reliable source of income even in the worst of times. The demand for Treasuries tends to drive up their prices and push down yields, illustrating their role as a refuge during economic storms.
But here is a very simple question to ponder: who will invest in Treasuries after they have been responsible for 46% losses since March of 2020? It’s going to require a positive ROI of more than 1.2% by my way of thinking.
Another classic safe haven during times of crisis is precious metals, notably gold and silver. These commodities have a long history of being perceived as a store of value and a hedge against inflation and currency devaluation. When confidence in traditional financial assets wanes, investors often turn to gold and silver as tangible assets that retains their worth. The limited supply of these metals and their intrinsic value have made them enduring choices for crisis investing. During turbulent periods, the prices of precious metals can surge as investors seek to preserve their wealth, making them a reliable safe haven in the stormy seas of financial instability.
In the fast-paced world of trading and investing, Artificial Intelligence (AI) trading software has emerged as the ultimate safe haven for market participants seeking a reliable and objective ally. Unlike human traders, AI is not ego driven. It doesn’t succumb to emotions, pride, or fear, which often cloud judgment and lead to irrational decisions during volatile market conditions. AI’s relentless pursuit of data-driven insights ensures that it remains solely focused on one objective: identifying the best move forward to optimize returns while minimizing risks.
Moreover, AI possesses the invaluable ability to self-correct. It learns from its mistakes and adapts its strategies in real-time, allowing it to stay agile and resilient in ever-changing market landscapes. Human traders may become entrenched in their biases and convictions, leading to costly errors, while AI constantly refines its approach based on incoming data and market dynamics.
In essence, AI’s sole purpose is to stay on the right side of the right trend at the right time. Its unwavering commitment to objective analysis and continuous improvement makes it an indispensable tool for modern traders and investors. As we navigate an increasingly complex and interconnected global financial system, AI stands as the beacon of reliability and consistency, offering a safe haven for those who seek to thrive in the unpredictable world of finance.
Artificial intelligence , it’s a game-changer because it learns from its mistakes, remembers them, and keeps forging new paths to find solutions. That’s the feedback loop that’s built fortunes for every successful trader I know. It’s a simple yet powerful concept, and here’s the kicker: A.I. applies mistake prevention round the clock, every day of the year, toward solving the problem at hand.
Intrigued? Please visit with us at our next Free Live Training to learn how our a.i. trading software can help you navigate the tumultuous financial landscape ahead.
A.I., with its advanced pattern recognition, crunching mountains of data, it spots the highest probability trades – and that’s invaluable. We may not always understand the “why” behind market movements, but we can sure as heck ride the wave. So, keep your eyes on what IS happening, not what SHOULD happen, because in these uncharted waters, PRICE is king, and artificial intelligence is your guiding light.
What all traders and investors want is an accurate, proven solution that alerts you when a high probability trend is unfolding. The Vantagepoint A.I. forecasts have proven to be up to 87.4% accurate in determining the trend three days in advance.
Visit with us and check out the A.I. at our
It’s not magic. It’s machine learning.
Make it count.
THERE IS A SUBSTANTIAL RISK OF LOSS ASSOCIATED WITH TRADING. ONLY RISK CAPITAL SHOULD BE USED TO TRADE. TRADING STOCKS, FUTURES, OPTIONS, FOREX, AND ETFs IS NOT SUITABLE FOR EVERYONE.IMPORTANT NOTICE!
DISCLAIMER: STOCKS, FUTURES, OPTIONS, ETFs AND CURRENCY TRADING ALL HAVE LARGE POTENTIAL REWARDS, BUT THEY ALSO HAVE LARGE POTENTIAL RISK. YOU MUST BE AWARE OF THE RISKS AND BE WILLING TO ACCEPT THEM IN ORDER TO INVEST IN THESE MARKETS. DON’T TRADE WITH MONEY YOU CAN’T AFFORD TO LOSE. THIS ARTICLE AND WEBSITE IS NEITHER A SOLICITATION NOR AN OFFER TO BUY/SELL FUTURES, OPTIONS, STOCKS, OR CURRENCIES. NO REPRESENTATION IS BEING MADE THAT ANY ACCOUNT WILL OR IS LIKELY TO ACHIEVE PROFITS OR LOSSES SIMILAR TO THOSE DISCUSSED ON THIS ARTICLE OR WEBSITE. THE PAST PERFORMANCE OF ANY TRADING SYSTEM OR METHODOLOGY IS NOT NECESSARILY INDICATIVE OF FUTURE RESULTS. CFTC RULE 4.41 – HYPOTHETICAL OR SIMULATED PERFORMANCE RESULTS HAVE CERTAIN LIMITATIONS. UNLIKE AN ACTUAL PERFORMANCE RECORD, SIMULATED RESULTS DO NOT REPRESENT ACTUAL TRADING. ALSO, SINCE THE TRADES HAVE NOT BEEN EXECUTED, THE RESULTS MAY HAVE UNDER-OR-OVER COMPENSATED FOR THE IMPACT, IF ANY, OF CERTAIN MARKET FACTORS, SUCH AS LACK OF LIQUIDITY. SIMULATED TRADING PROGRAMS IN GENERAL ARE ALSO SUBJECT TO THE FACT THAT THEY ARE DESIGNED WITH THE BENEFIT OF HINDSIGHT. NO REPRESENTATION IS BEING MADE THAT ANY ACCOUNT WILL OR IS LIKELY TO ACHIEVE PROFIT OR LOSSES SIMILAR TO THOSE SHOWN.

