-
View Larger Image
Welcome to the Artificial Intelligence Outlook for Forex trading.
VIDEO TRANSCRIPT
Hello everyone and welcome back. My name is Greg Firman and this is the VantagePoint AI Market Outlook for the week of July the 17th, 2023.
Now, to get started this week, we’ll accurately look at the broader market, and what we’re going to look at here is exactly what has happened over the last two weeks that we’ve discussed or I’ve discussed, excuse me, in the VantagePoint live training room and here in the AI Weekly Outlook.
S&P 500 Index
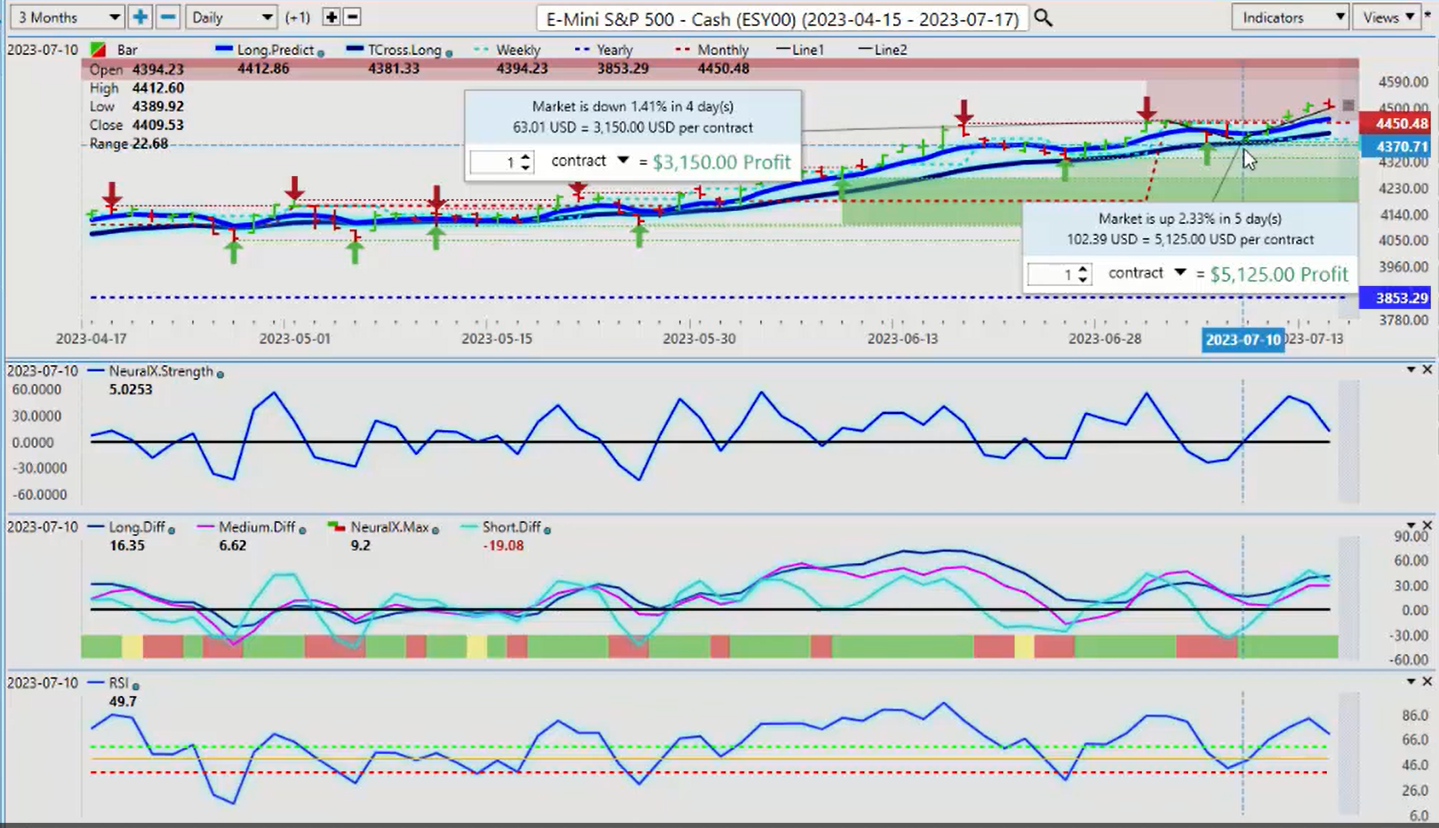
We can see that the one thing we want to be very cautious about is using rolling performance. It’s grossly lagging in many cases. Another good example of this, the S&P 500 is up 18% approximately on the year. The annual performance or rolling performance has literally taken five months, four months from March to catch up to show the same number of 18, close to 18%. But we remember back in March we’re using that annualized rolling performance methodology.
It showed the S&P 500 as bearish when using an accurate anchor point, the yearly opening price, it actually showed that it was positive. And then we’ve rallied from that point close to 18% while the other market participants were caught short down there using that lagging methodology.
So if we look at this now, you can see here that again, on or about the beginning of the month, July the third, the previous week, the S&P 500 was not up 8.5%, it was down 1.4%. This week we have moved up close to 1.4%, but that was predicted before it happened.
We used the VantagePoint T cross long, that level coming in this past week at 43.81 that was discussed here last week and in the VantagePoint live training room. We actually did this live this past Monday morning using the T cross long and the weekly opening price current anchor points to give us these levels.
So, again, very, very important when we look at that rolling performance, it’s taken literally four months to catch up to the yearly opening price from where we were in March, where the bulk of the analysts had said the S&P 500 and the SPYs, which is the same thing, I’m just using the S&P 500 versus the SPY, we can see the exact same thing that again, you’ve got to be very, very cautious where your anchor points are.
Now, if we look at the indicators for this week, when most market analysts are getting bullish, the VantagePoint indicators are actually starting to point in the opposite direction. But again, we want to make sure that we’re checking everything.
We’ve got a reverse check mark on our predicted RSI and the neural index strength still in a firm uptrend, but again, I believe we have a gap to fill, which is likely backed down into this long predicted T cross level between 4463 and 4415.
Now, if we look at the VantagePoint predicted high for Monday, again, this is an outlook, not a recap of something that already happened. So the predicted low is 44.91. We would allow the market to gap down before we reconsider longs on this because that’s what the indicators are showing me before we start the week, not once it’s already trading. Very easy to call something after the fact, guys, it’s getting out in front of this.
So this was directly related on the S&P 500 to what I’ve coined as the dollar cycle. The dollar cycle would be up in the beginning of the month. So you can see what the main driver of the selloff in the first week in the month, again, the S&P 500 was not up 8.5%, it was down 1.4% in the first week. And this was caused by real dollar demand. They have to buy dollars at the beginning of the month.
U.S. Dollar Index
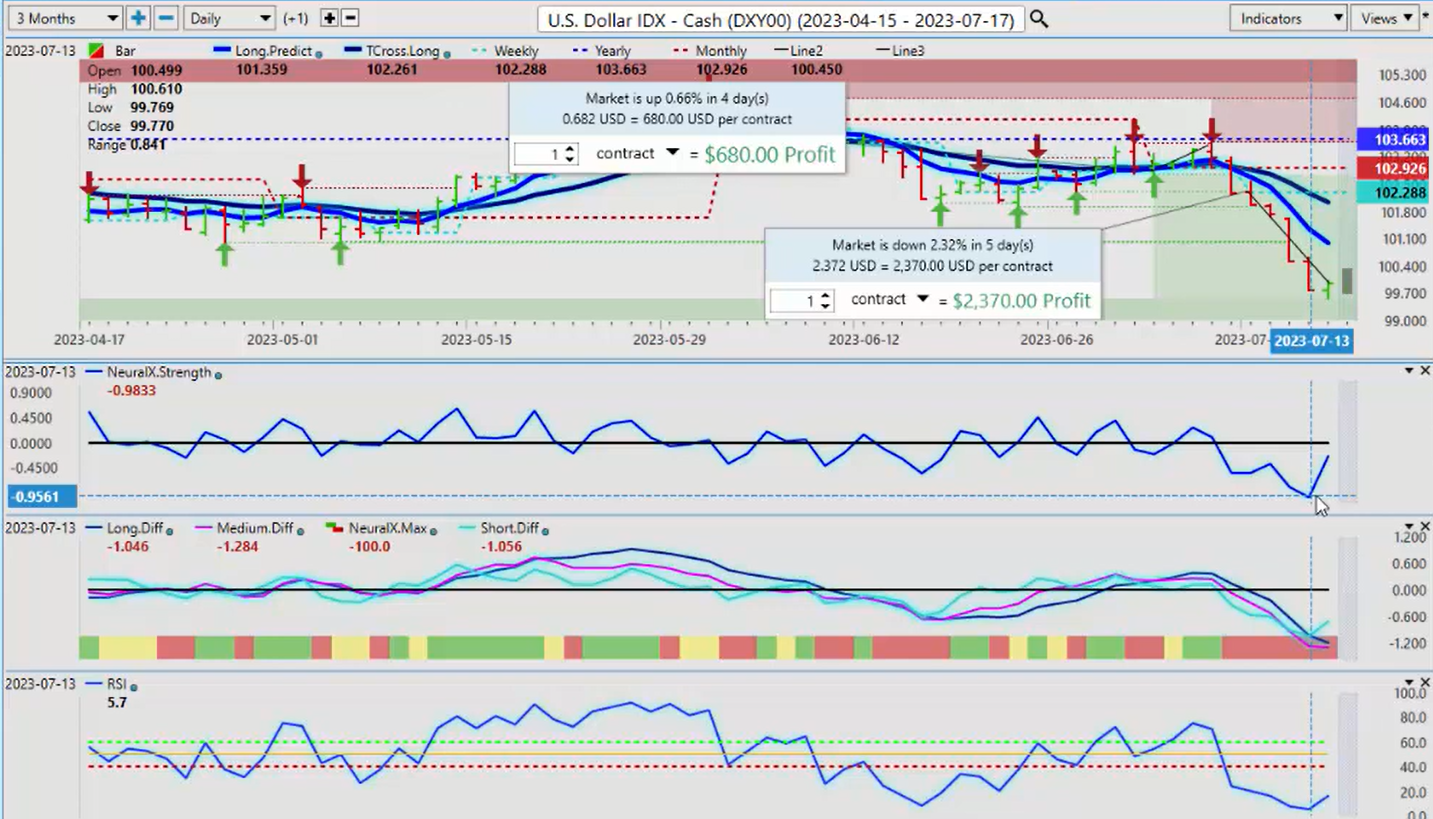
So what I had said in last week’s presentation before, not after this move occurred, is that once they’re done buying dollars, usually whether it’s a good payroll number or a bad payroll number, it’s irrelevant, guys. The unemployment numbers are lagging anyway, much like a rolling performance model. We’ve seen that firsthand on here. So when we look at this last week, this was predictable that the dollar, once the real money is done buying, you would see the dollar come under selling pressure.
Now, the economic numbers last week with the CPI simply accelerated what was going to happen anyway, but also remember the CPI is not a leading indicator, it’s a lagging indicator, just like that payroll number. So now we look closer at these VP indicators. Once we’ve had our dollar buying and our dollar sell off, now we would look for this to flatten out a bit.
And once again, when we look at the gap between the predicted high and predicted low and these predicted moving averages, it’s significant. In my respectful opinion, only at the very minimum we’re going to come up to the long predicted at 100.99. I think they’re overreacting a little bit to the CPI number, but that’s the market, guys.
So we want this gap to be filled. Again, when we look at the indicators, we’re getting very close to an MA DIF cross. Our predicted RSI is rising. Our neural index strength is pointing straight up. And the slope of this, a few of you guys were nice enough to comment in the comment section, Sam and a few of you guys, you’re absolutely right. The angle of the slope of this is, because you can see that the neural index is green, but the neural index strength inside that indicator is saying something very different. It’s pointing towards, if nothing else, a corrective move.
So when we get into the mid-month, the cycle around the dollar is again, what I’ve just shown you, strong at the beginning of the month, sells off the week after the nonfarm payroll, and then we basically kind of go sideways again to the end of the month. But remember, August is not a good trading month.
August is one of the worst trading months of the year. We’re going to go pretty much flat or sideways. And then the dollar is likely to regain its footing. So we would still expect some type of dollar buying at the beginning of August either way, but I would respectfully submit it would be much smaller. It could only be a couple of days, but it’s still going to be there but not as predominant as what we’ve seen in most of the months of the years.
So, remember, the two easy ways to gauge this. Do I want to buy stocks next week based on this? Probably not until we come down and we fill some of these gaps. Because again, this move was accelerated based around that CPI number and there’s a lot of chatter right now, but in my respectful opinion only, the Fed shouldn’t have hiked anywhere near 5%, but we can’t change that. We have to play the hand we’ve been dealt. So, again, watch for a slight dollar reversal next week.
Now, if we get that reversal, and it’s not going to be a trend change. The dollar has been in a downtrend all year despite again, what these lagging rolling performance models tell us, it’s not. The dollar has been down 80% of the year.
Gold
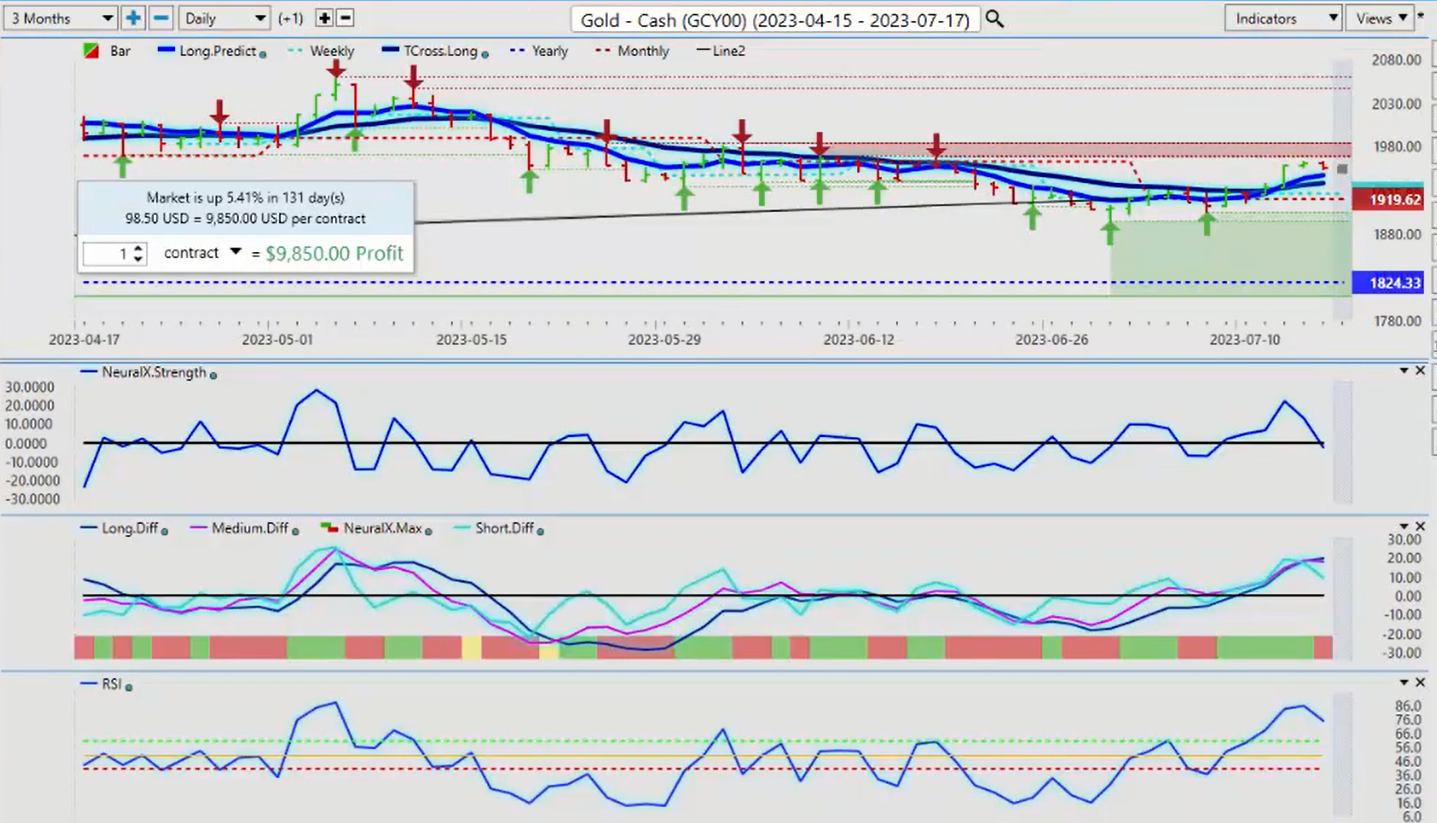
So when we look at gold right now, gold is coming up against some very significant resistance, verified resistance.
Now, again, very similar to a fractal, we look at a high point, two bars to the left, two bars to the right to create a price-based resistance and support zone. So right now that resistance is very significant at 19.67 and you can see we’ve come up to this. And despite that dollar strength, we’re not passing over it.
So, again, when we look at the predictions for Monday, this is showing us that we’re actually losing momentum. Now, we’ve had a positive neural index, but now the neural index and the neural index strength are actually in agreement, which is yet another sign that the dollar is not going to sell off much further next week. It could flatten out.
I would be, again, very cautious between the Monday, Tuesday reversal with what we work on in the VP live room. That’s that we have a fake price on Monday and then usually late Monday or Tuesday it reverses whatever it did off the open Sunday night.
So, again, these indicators are warning. We have an MA DIF cross. Our neural index strength and our neural index are both in an agreement. And we have this again, type of reverse check mark where the RSI is starting to roll over to the downside slow and not quickly, but at the very minimum next week, the VantagePoint T cross long is coming in at 1937 and I expect it would test that level and potentially even break it if we get the Fed pushing back and arguing about some of these levels.
Crude Oil
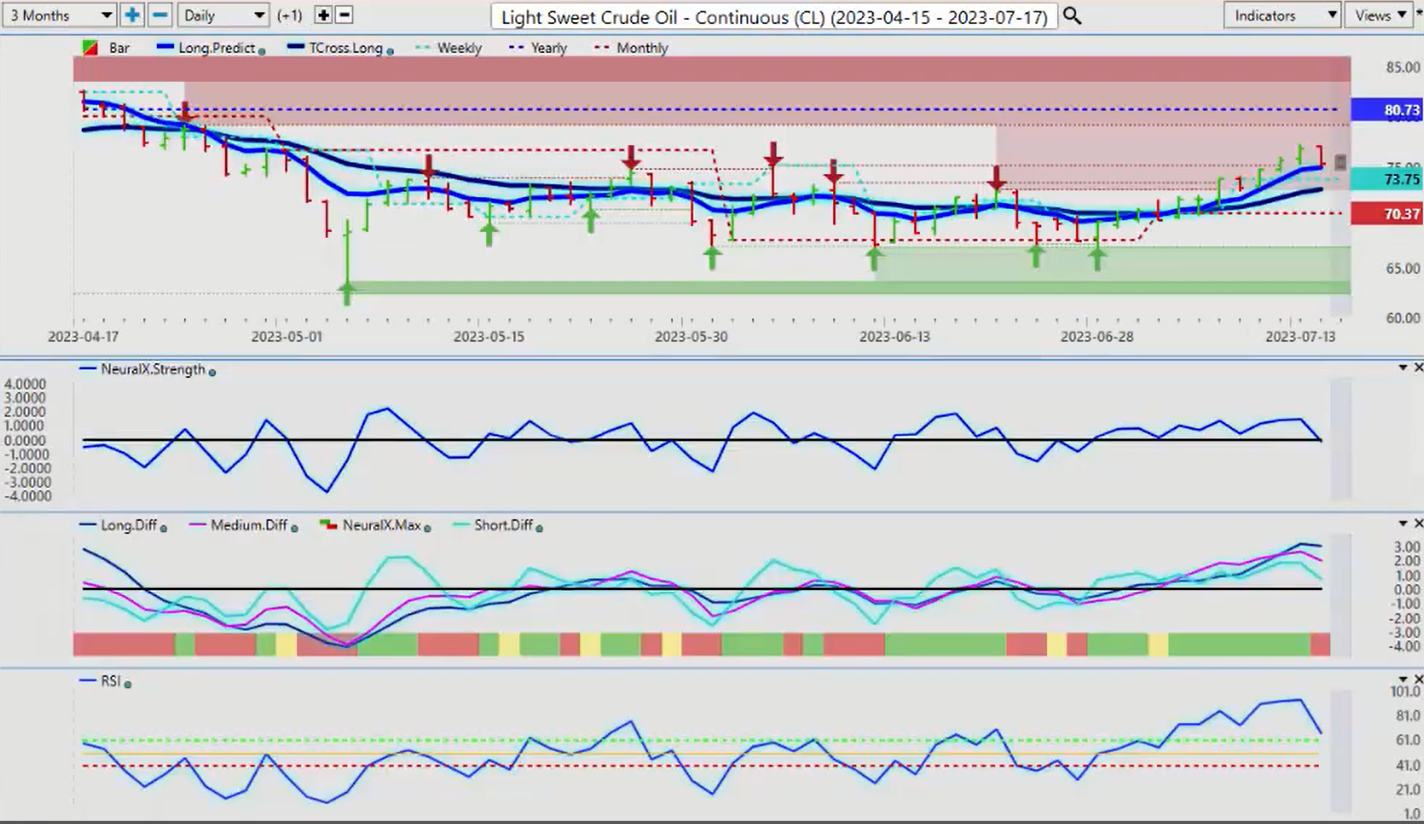
Now, when we look at oil, again, oil is rebounded and you can see where it’s rebounding from here, guys. Once again, warning you about these random five day points. If we look at a 30-day performance using a lagging indicator like rolling performance, the anchor point is in the wrong place. This red line is a point in time indicator in the VantagePoint software where each week, each month, each year, it automatically plots the proper pivot points for the open of the week, the open of the month, and the open of the year. And we can see three days in a row we are running along that monthly opening price, the VP indicators turned positive, excuse me, and oil made a significant rally.
Now, in my respectful opinion, this is a very good selling opportunity. We’ve got an MA DIF cross, neural index strength is pointing down and it’s crossed the zero line, the neural index is turned red itself, and the RSI is sloping saying we’ve lost our upward momentum. So this is how we get out in front of these things. But again, this was a very, very good long trade based on just using the VPT cross, the long predicted and of course that very important monthly opening price.
So, again, if you go back a random five days from Wednesday to Wednesday, Thursday to Thursday or you say, okay, the last 30 days performance is from the 15th of the month to the 15th of last month, then again, you’re creating lag in your analysis, guys. And we’ve seen that. I’ve discussed it over and over again in here with very clear examples. But March of this year is the best example I could use.
And I warned everybody that “Look, they’re telling you that the S&P 500 is in a bear market when it’s positive on the year because they’re using that lagging rolling performance.” Be careful with that, guys. I’m not saying you can’t use it. I’m saying always make sure you’re staying current with your pricing.
Bitcoin
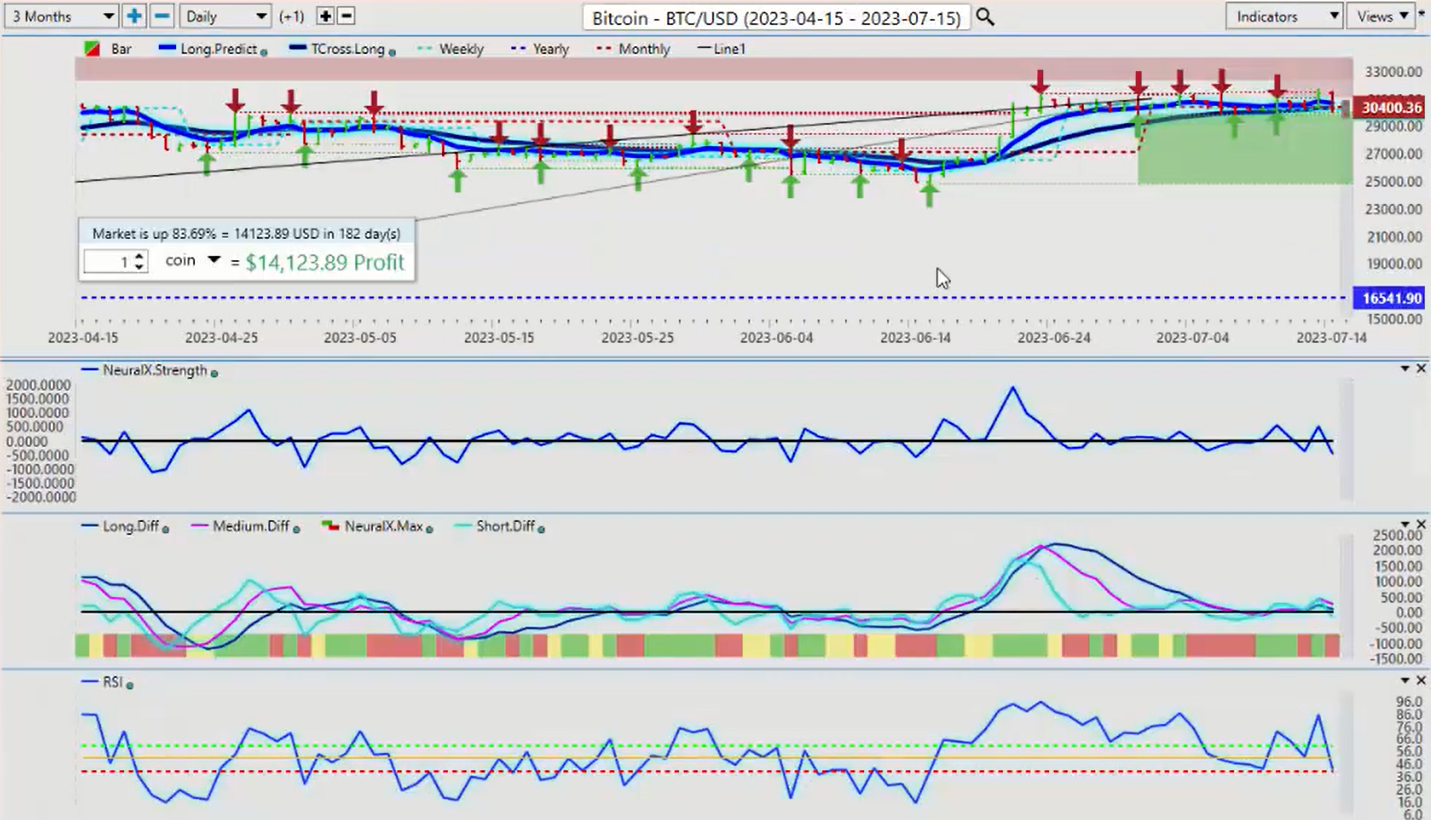
Now, when we look at Bitcoin, another big mover, but it’s starting to run out of a bit of steam here. Now, the big seasonal pattern that I follow, there’s usually a big one in the middle of July, and we’ve seen a pretty good rise here. But the main seasonal I look for is mid-September to late October is a very strong buying period. But for now, once again, just about every one of these inner markets point to some kind of dollar strength next week.
You’ve got oil pointing down, you’ve got gold pointing down, you’ve got the S&P pointing down, and now you’ve got Bitcoin pointing down. Now I believe that Bitcoin will move towards its own asset class, but for now I expect a little softness in this next week, so be cautious. The indicators are clearly warning us of that.
Euro versus U.S. Dollar
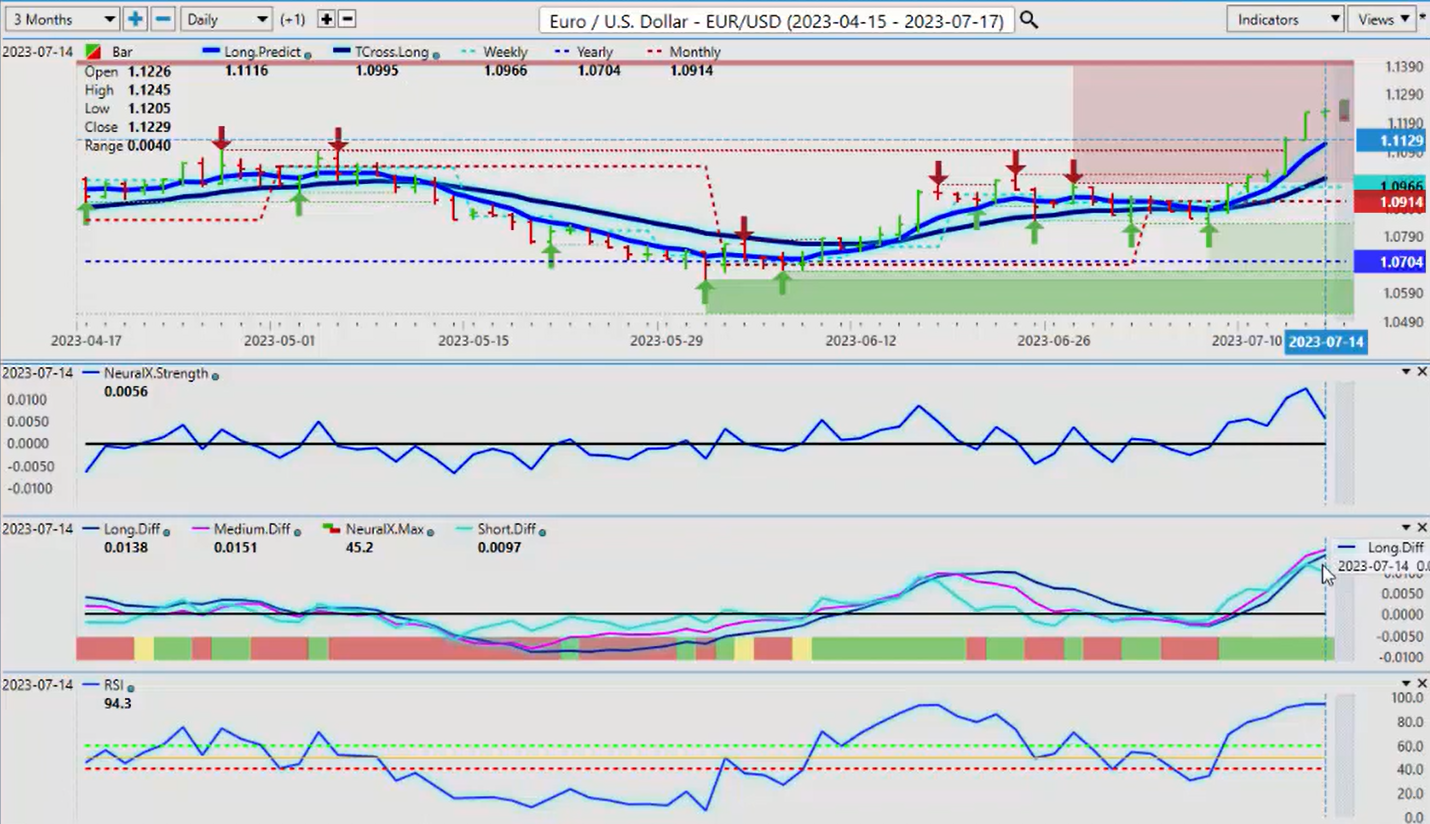
Now, when we look at some of the currency pairs going into next week, the euro grossly overextended here. It doesn’t mean it can’t go higher, guys, but the indicators, what you want to look for in your VP software is by probably midweek that we’re starting to roll back down. So, again, if we look at the predicted low for Monday is 111.99, we would, or I would argue that while the predicted high and predicted low are powerful indicators, we need to fill some gaps here guys.
So the first point to fill that gap is 111.16, the T cross long, the triple E MA cross just using the T cross long is coming in at 109.95. That’s a big gap for me to be buying up here. So I would prefer at the very minimum to let it come back to 111.16. But I believe we could pull back slightly further than that if we get an MA DIF cross.
Now, the predicted RSI is not turned down yet, but you’ll see that the neural index strength is pointing directly down, which is again another warning sign of some kind of correction in the US dollar is likely next week because again, this is an outlook, guys, not a recap of something that already happened. We’re trying to get out in front of these moves while at the same time avoiding bull and bear traps in the market.
So, again, be very, very cautious of that. And the minimum entry point for a long trade to stay with the primary trend, which I agree 100% is up, I wouldn’t even consider it until the 111 area.
U.S. Dollar versus Swiss Franc
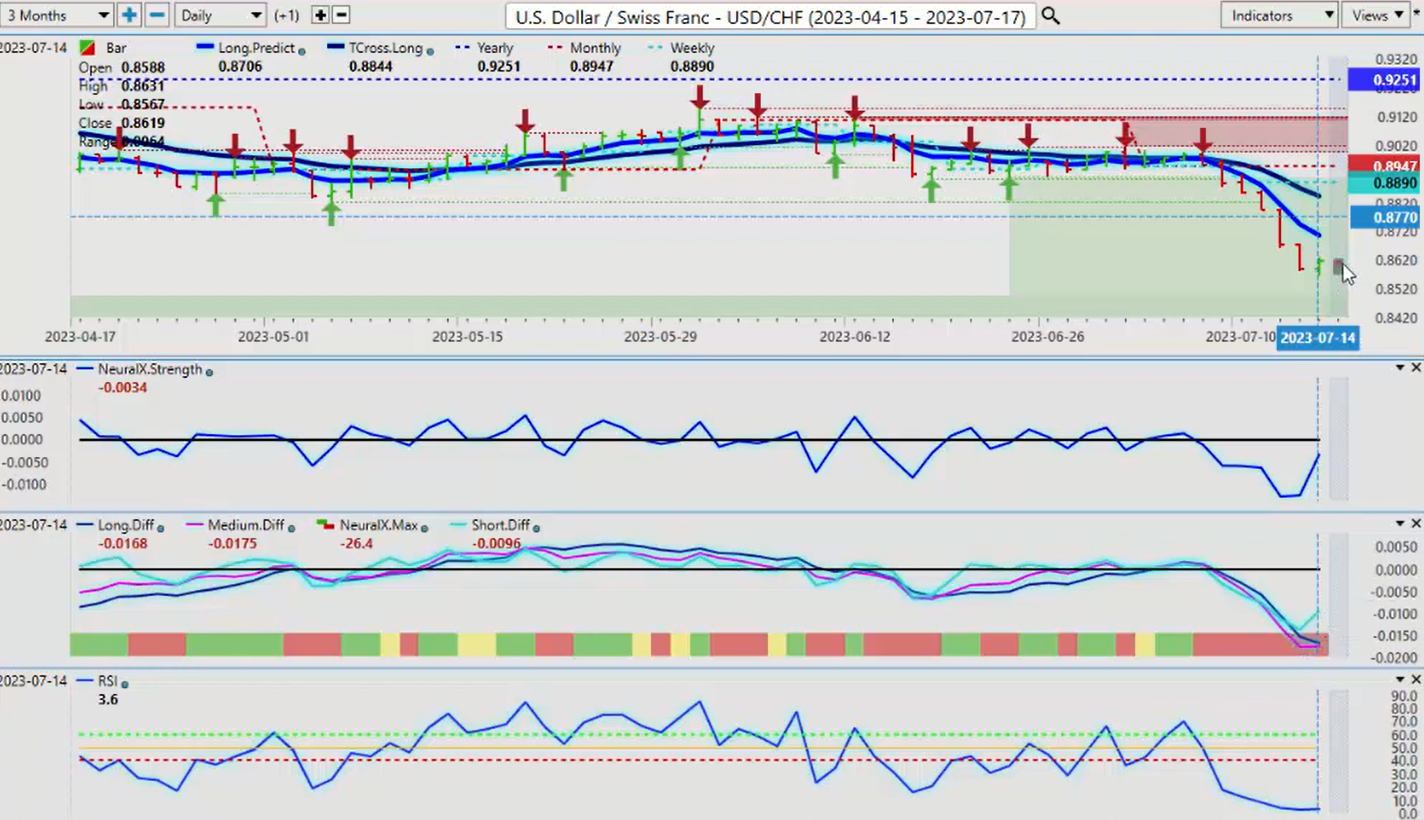
Now, the Swiss franc has really cleaned up this past week, and it really does show the depreciation between the US dollar and the Swiss franc and where money is really going. So, again, we would be looking for some type of way of filling the gap here. If we look at the indicators, our medium-term difference is about to cross back up. So you could have some very good short-term long opportunities here next week.
The VantagePoint predicted low in this case, is looking good, isn’t it, because our predicted low there is 85.75. And if we’re going to go to the long side on this, then our first gap up point would be 87.06. Our second gap point would be 88.44. But selling down here, I’m not saying no, I’m simply pointing out it’s not overly supported. Maybe on Monday, but be careful on Tuesday, Wednesday, Thursday, guys, because that Monday, Tuesday reversal, what we would actually be looking for is for this to drop lower on Monday and potentially look for longs on Tuesday because the indicators are warning us.
Very seldom, I might add, do I see the predicted RSI at 3.6. That is a very, very low number. It doesn’t mean it can’t go lower, but it’s certainly not the ideal time to stay with the primary trend. So what I’m respectfully saying is you could have a bear trap down here, just like a bull trap on Euro OUS. Be very, very cautious.
British Pound versus U.S. Dollar
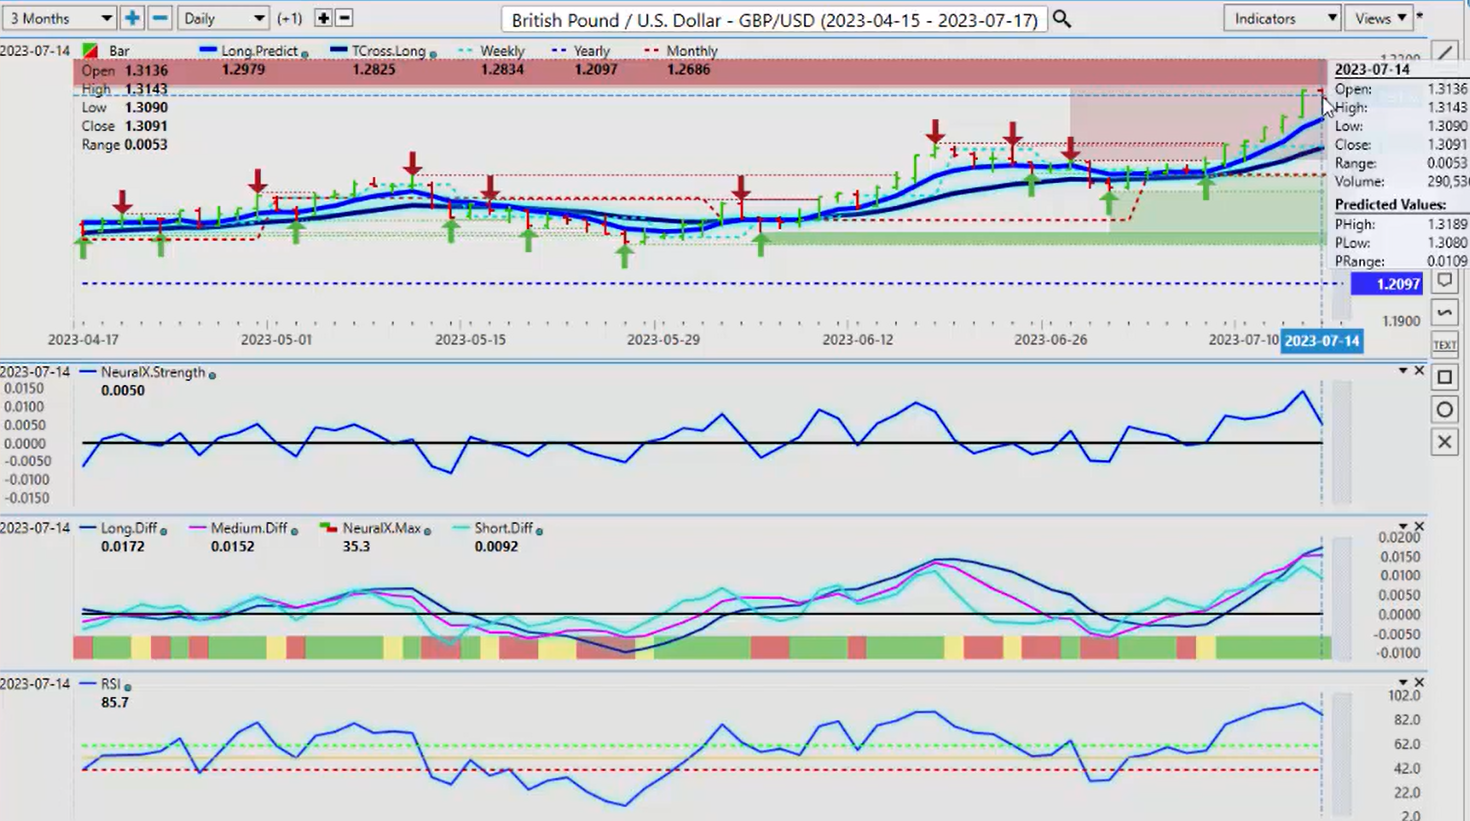
Now, the UK, I must say, I’m sure the traders are… Anybody that’s in the bear camp here on Great Britain must be licking their chops right now, pardon my French. But the UK, the probability of them going into a recession after these ridiculous rate hikes is extremely high. The jobs market’s starting to loosen up a little bit over there, the job postings, and we’re coming up against this dark red ominous cloud, which is a multiple verified zones identified in the software.
The verified zones identify failure points in the market where it’s come to and it’s simply failed. So this is a very dark cloud hanging over this particular pair. And the indicators in Vantage Point are already picking up on it. The neural index strength, again pointing straight down, we have an MA DIF cross, the predicted RSI is pointing down. Again, we’ve got some gaps to fill. The predicted low here, 130.68, that’s extremely aggressive to be buying up here.
We’re looking for filling gaps here. Long predicted, 129.75, T cross long 128.25. It’s very easy to replicate my charts here, guys, and that’s what we want to do is just say, “Okay, is this the ideal long trade up here?” I don’t believe that it is. I believe the UK has far problems than what’s being stated by the media, but they’re starting to pick up on it. So, again, be very, very cautious at these particular levels.
U.S. Dollar versus Japanese Yen
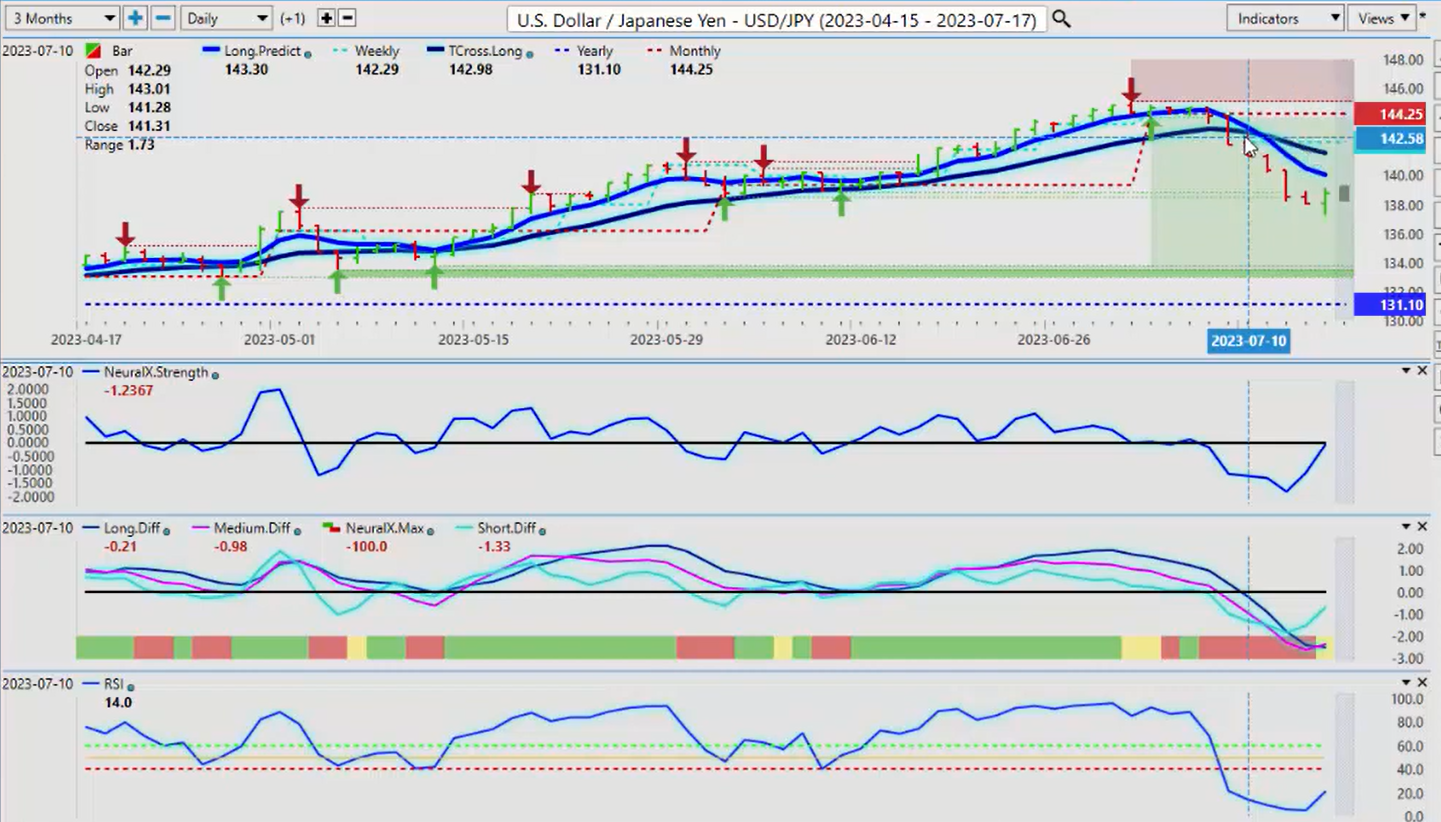
Now, the dollar, even this past week gave up ground against the number one carry trade out there, the dollar yen. Now, once again, guys, I’m going to point this out. This is the monthly opening price or what we would call the, not a 30-day rolling period, but a specific monthly opening price. Again, in my respectful opinion, this has absolutely zero lag. But if you went 30 days random back from here, then it would show something very different.
We must have consistent anchor points in our trading so we can gauge it exponentially, not from a lagging, rolling performance model. Three days in a row, I’m watching this and saying, “Okay, I’m coming into a period of known dollar weakness,” which was this past week, and I even stated on here last week, I don’t like the look of this, but it could go lower because of dollar weakness. And you can see that’s what’s happened.
Now, for next week, again, be very cautious, the neural index has turned yellow. The neural index strength is pointing straight up. We have an MA DIF cross occurring. The predicted RSI is rising. This is absolutely looking like a corrective long trade, but we are just looking to fill that gap here, guys. So that first point is 140. The second point, the T cross long is 140, 155.
So, again, this is very likely this is going to turn back up. But if it doesn’t, then you could have a risk off scenario, further problems in Russia, all these other things that are going on, we have no control over that. But the indicators are pointing that the dollar, that this was a corrective move lower on this pair and it’s potentially getting ready to turn back up.
U.S. Dollar versus Canadian Dollar
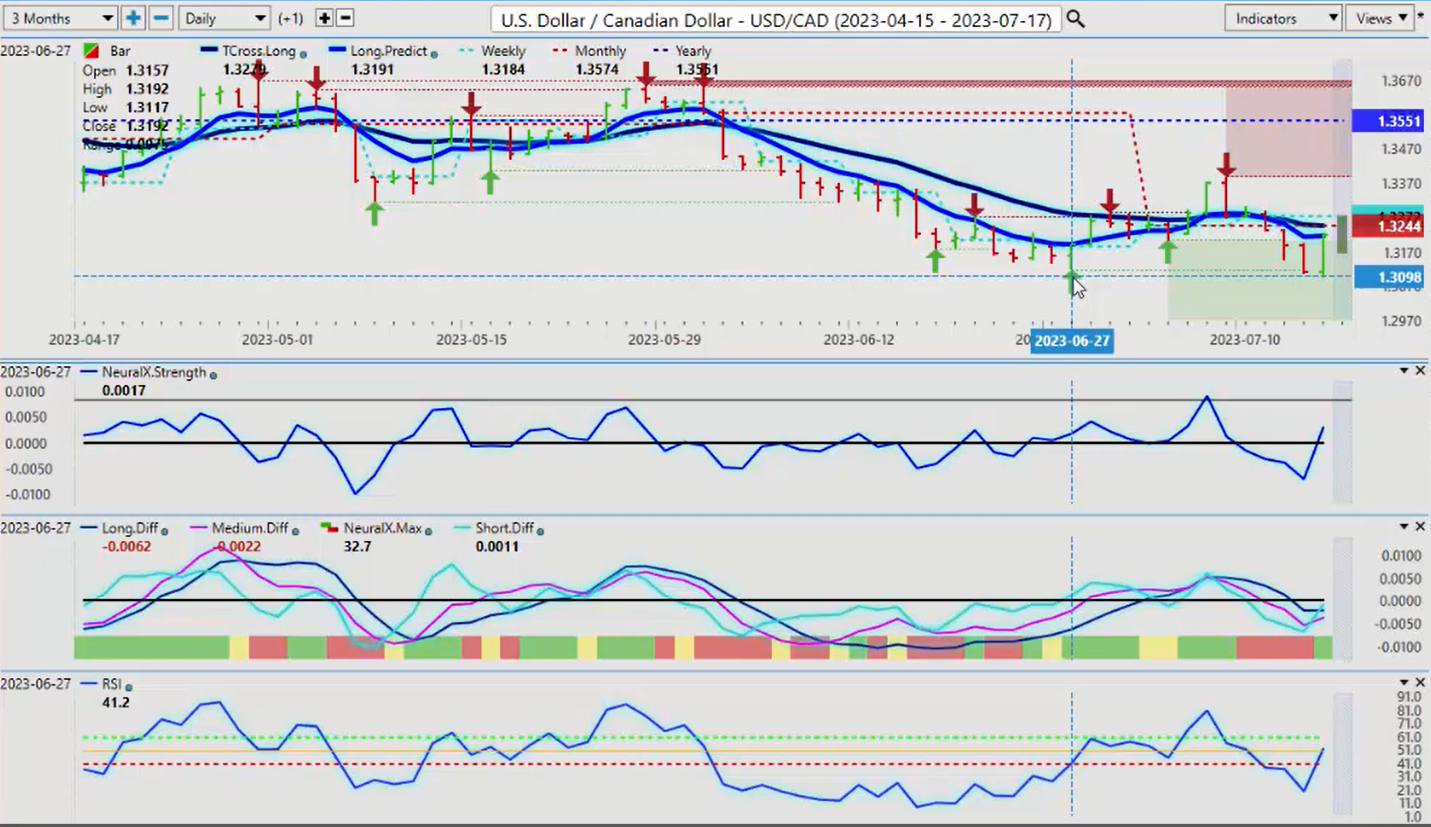
Now, when we look at some of our main commodities/equity-based currency pairs, the first one I’ll look at is US-Canada. Now, again, we’ve got a rate hike in Canada, but as you can see, the market is not buying into this. The market feels the economy… The general slogan here from the media and the competent economists in Canada is “More pain, zero gain.” They are absolutely against these rate hikes. What should the average investor would say this would help the Canadian dollar, it’s actually not because of the amount of money that was borrowed by the government, the amount of spending by the government here. The banks loving this.
But the fact remains is that again, there’s a growing dissension in Canada that this was wrong. And this could actually hurt the Canadian dollar, which you can see on Friday, that’s exactly what it did. So they had a couple of down days why they digested that rate hike. And then the media and the economists spoke out about this here in Canada and I 100% side with them. There should have been no rate hike. But again, there was. So this shows you in real time that rate hikes are not always positive for a currency, are they? Didn’t help Aussie as much, New Zealand as much Canadian dollar as much. So, again, these indicators are warning us that this may be more.
Now, I could argue that this gap is filled and we could say we’re looking at a short trade off the predicted high, but again, we have to let the market digest what the Bank of Canada is doing or saying because really, very little of it makes sense. Again, if the US is not hiking, why would Canada be hiking is the question? But either way, the banks got their bonuses, they all got raises here in Canada, and the media is pointing that out now too. So the Bank of Canada is going to come under pressure in the coming months, and I believe that they will have to cut by the end of the year, but we’ll see again.
So right now the indicators are warning, there’s further upside here, but we have significant resistance at the VantagePoint T cross long up at the 132.46 level.
Australian Dollar versus U.S. Dollar
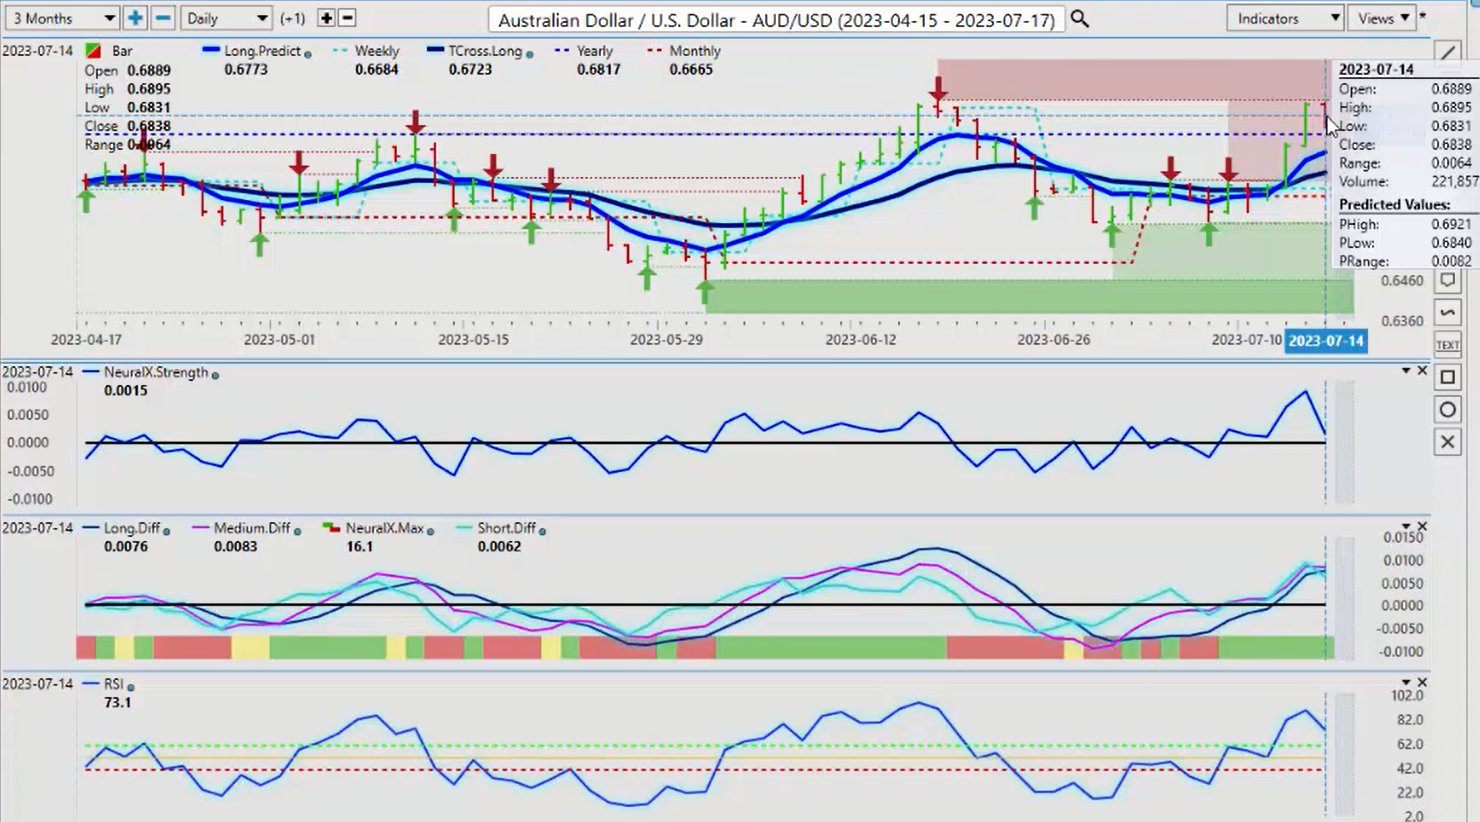
Now, the Aussie enjoyed a very, very good week. But remember guys, we talked about this in last week’s AI Weekly Outlook before it happened, not after. Again, this is an outlook, not a recap of something that’s already happened. If the S&P 500 goes higher this past week, I had stated that the Aussie will follow, the Canadian dollar will follow, the euro will follow, all these currencies will react to that dollar weakness.
So the Aussie has done that, but once again, in the VantagePoint software, is identified a verified resistance or a failure point. This is a type of fractal, guys. We don’t need to get into flags and polls and all this nonsense. It’s a failure point. We can agree, right? We don’t need to complicate it with some of these other strategies. We’ve failed at this level and we couldn’t go higher. Now we have retraced and we have come, which again, is absolutely nothing to do with Fibonacci.
We have come back up to this verified resistance high after forming a new verified resistance low, which was almost identical to the one from June the 29th. So we’ve got sellers on the Aussie up here at this particular level at the high of 6,900, and we’ve got sellers up here. And then we’ve got buyers, which included me this past week at the low of 65.66.
We were picking this up, talked about this one in the VantagePoint live room at 66.40, 66.32. But again, this needs to get moving quickly. This is the classic setup, guys, of a bull trap. So be careful up here is the only warning I can give you. If you believe that this is going to go long, then I would respectfully submit you should set up your buy orders above the verified resistance high or you can stay with the trend. But remember, we talked about this one last month and I warned everybody. And it was at the exact same time, which is a little frightening when you connect the dots that the Aussie failed last month at the middle of the month. We’re exactly there right now, and it’s doing the exact same thing.
So you can see that these markets are predictable based around the intermarket correlations, based around a study of price action, connecting intermarket correlations with price actions. But we want to back off some of these wild and wacky theories from the ’70s and ’80s, and we want to make sure we’re studying seasonalities, failure points in the market.
So this, if it repeats itself, we’ll know why. But the main thing is we want to identify where this level is and is there a potential for a bull trap? There is. I also think that the Aussie could break out to the upside once the S&P 500 has done its corrective move lower.
New Zealand Dollar versus U.S. Dollar
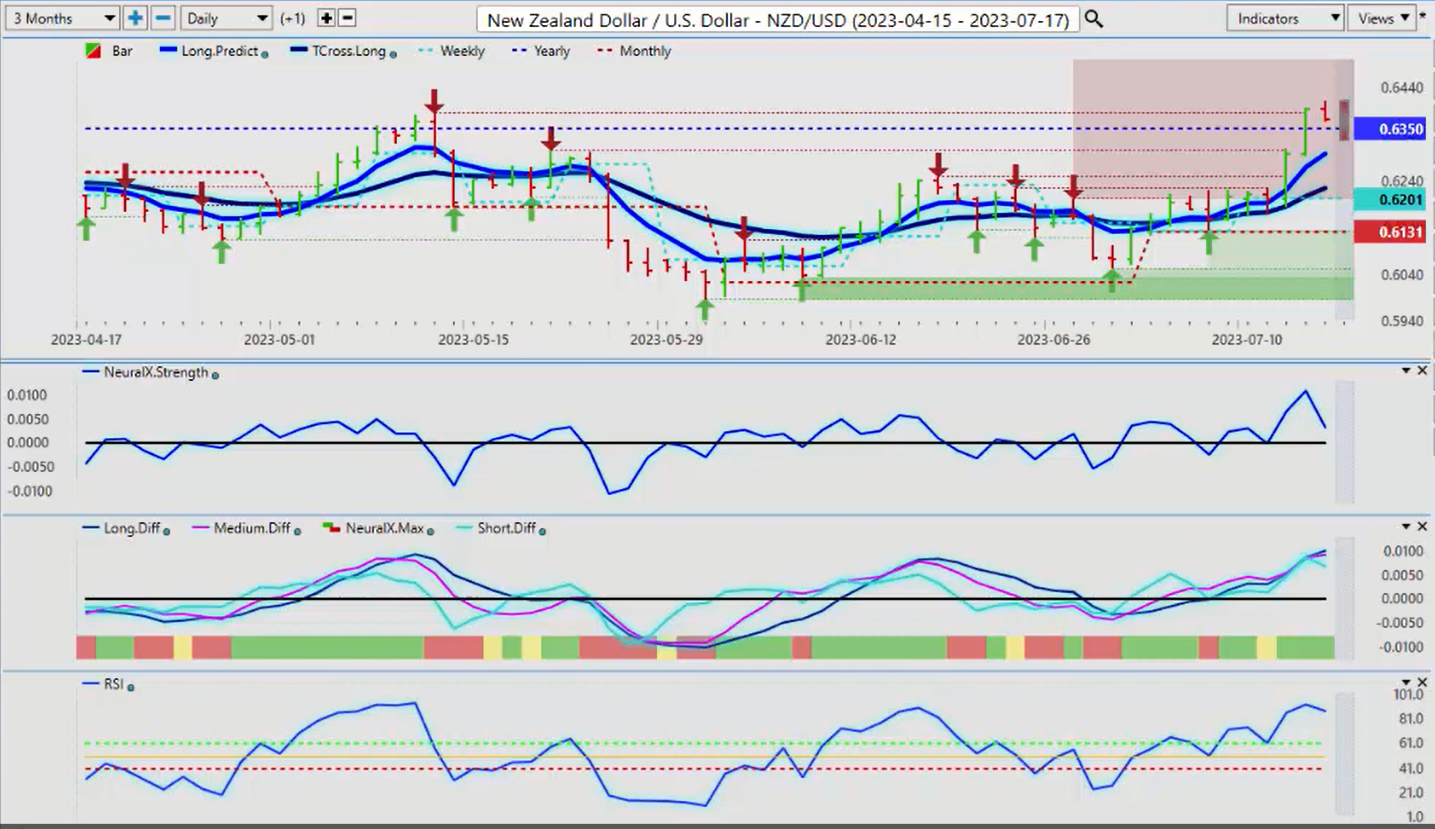
I would apply respectfully the same thing to New Zealand, and for some of you savvy forex traders will start working on that in the VP room. Aussie-New Zealand is rapidly becoming one of my favorite cross pairs because instead of going after Aussie-US or New Zealand-US, why not take them both via Aussie-New Zealand? And it’s been a very lucrative year on that pair, I might add.
But the same thing, we have a pretty strong verified resistance high at 63.85. We must clear this and break free and clear of it. But when we look at it, it’s funny how it’s always around the middle of the month when this thing sells off, much like the Aussie and the Canadians. But when we look at the indicators, these indicators are already warning us that this could happen next week. The neural index strength down, MA DIF cross, and again, I’m glad you guys are looking at the slope of this because it really is important.
It has a significance to it because it allows us to see inside the neural index. Not just a red, green, yellow, but an actual do we have upward momentum? You can see the slope of the neural index strength going up as the market went up, but then we still made a new high on Friday, but the prediction as of Friday at 6:00 PM, actually is Thursday is down, and look what it did on Friday. Very interesting stuff to say the least.
So with that said, this is the VantagePoint AI Market Outlook for the week of July the 17th, 2023.

