-
View Larger Image
Welcome to the Artificial Intelligence Outlook for Forex trading.
VIDEO TRANSCRIPT
U.S. Dollar Index ($DXY)
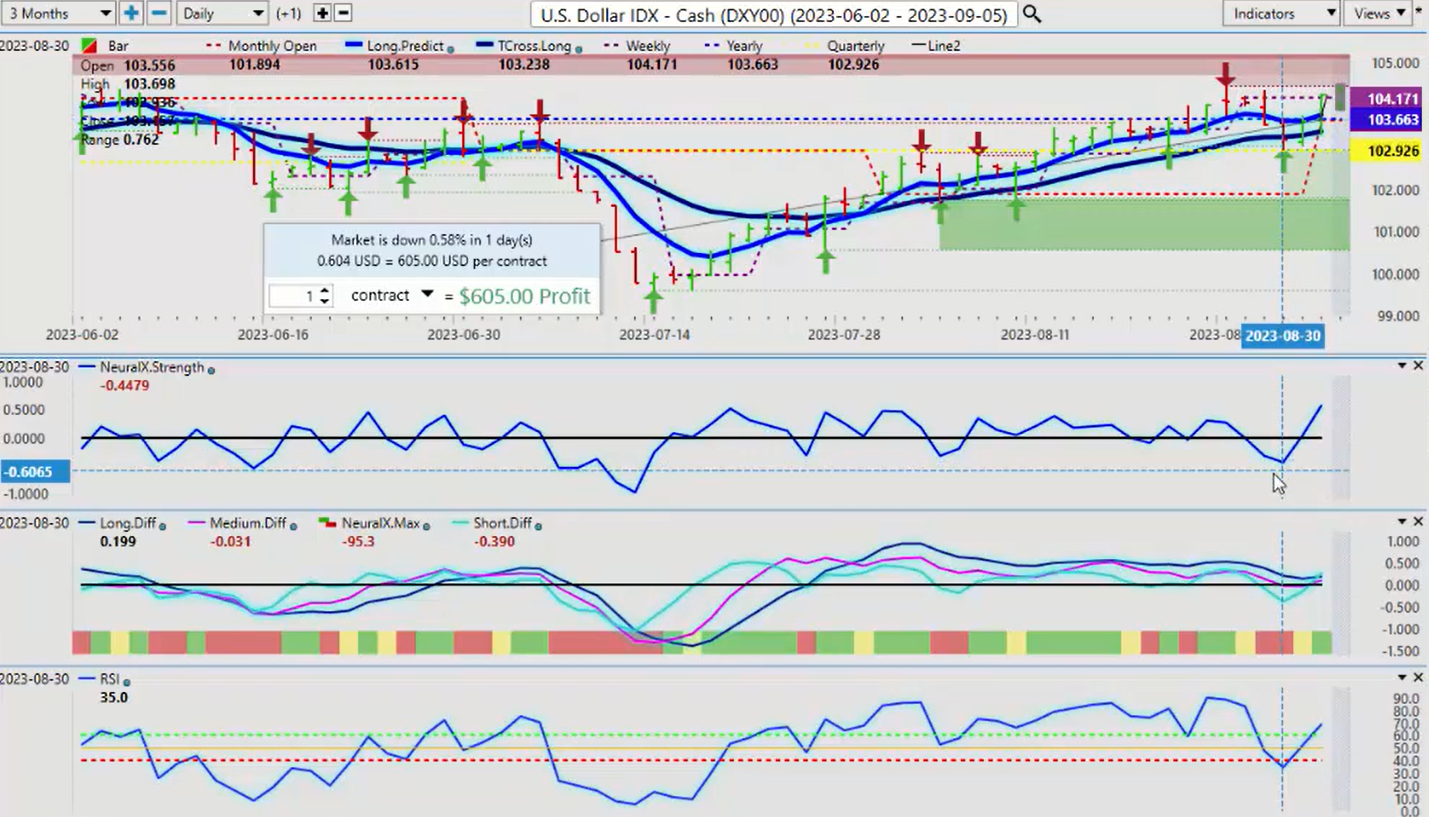
Hello, everyone, and welcome back. My name is Greg Firman, and this is the VantagePoint AI Market Outlook for the week of September the 4th, 2023. Now, to get started this week, we’ll begin with the dollar index and look at an accurate measurement of performance without the rolling performance model. We always want to make sure we remain current. Now, what I had discussed in last week’s weekly outlook is leveraging the accurate quarterly opening price. We can see this past week the market came down to the quarterly opening price two days in a row, and we’ve had a significant rally out of that area. This is exactly what we look for using their current weekly, monthly, yearly, and quarterly opening price. Now with the dollar index, we are in the fiscal fourth quarter of the dollar, and I’ve suggested that this is a known seasonal pattern of dollar strength, not just at the beginning of the month but in most cases right up until about mid-October.
So that, right now, we can see that the market is up 0.58% on the dollar index. The equity markets are down about the same to start the month. We’ll look at that in a moment, but the indicators right now are neural index strength. This started again, as I’ve discussed on here many times, the power of this particular indicator by its slope angle, it allows us to see inside the neural index, not just a red, green, or yellow. So we can see the actual neural index going from red turning yellow, and then ultimately, with its prediction to start the week, turns green, or predicted RSI failing to hold below the 40 level, we’ve rebounded, and now going up above the 60 level on the predicted RSI, which is telling us momentum is building in that monthly dollar cycle but also again in a strong seasonal pattern. Equity markets, not usually the best play to be buying stocks in the month of September, but buying dollars and some of the other markets have been very good.
So right now, again, to start the week, the quarterly opening price remains our key support level. Now again, we don’t want to look back five random days, 30 random days, 365 random days. We want anchor points in our trading. So again, as we tried to break down through that VantagePoint TCross Long last week, we had the additional support of that accurate quarterly opening price, two days in a row. Then we go higher, we get a retracement right back to the TCross Long on Friday at 103.69, and we accelerate higher. But again, this is something we’ve worked extensively on in the VantagePoint live training room last week. This is something we anticipated would actually happen regardless of that non-farm payroll number.
S&P 500 Index
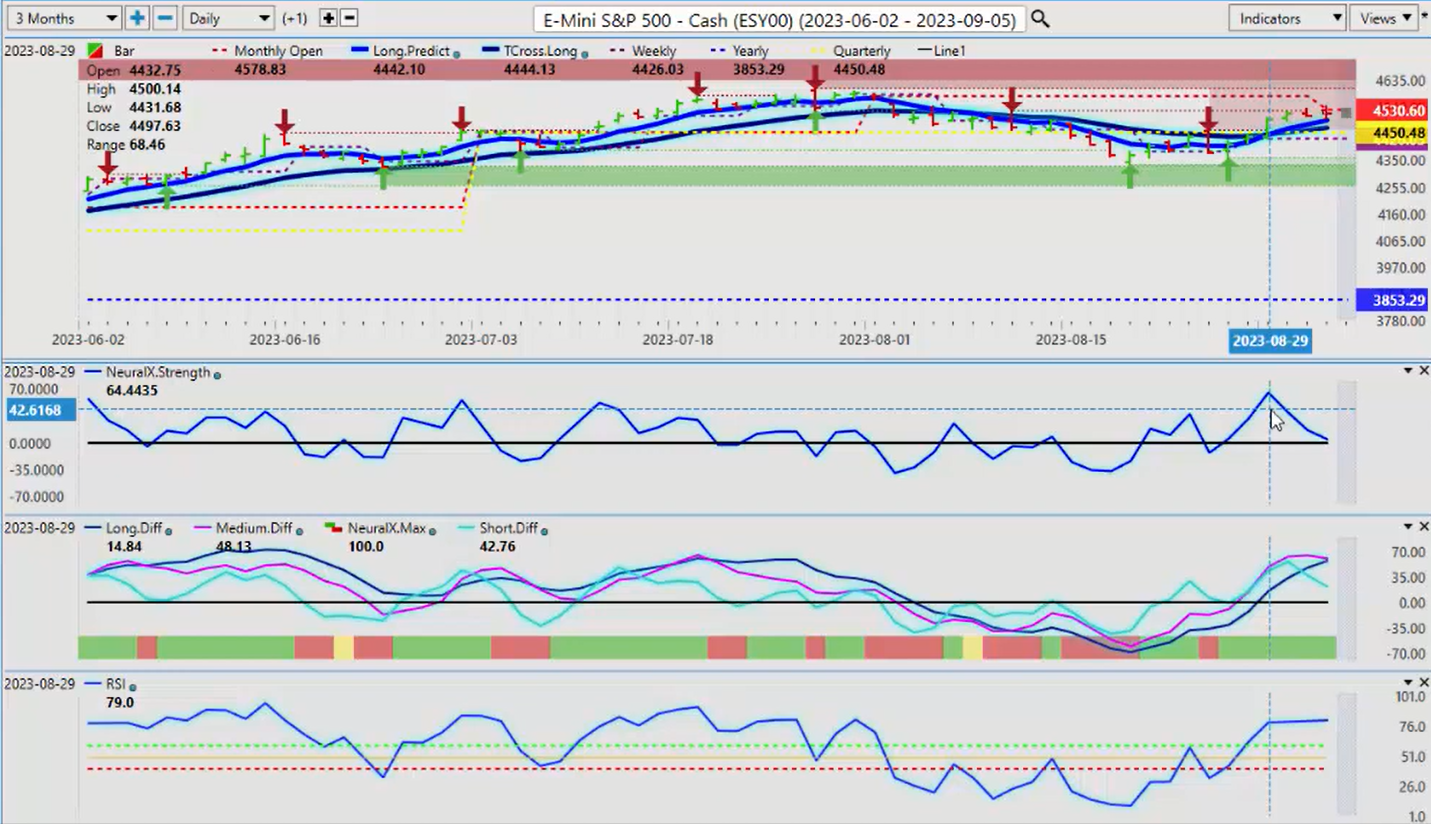
So with that, we can see, once again, using a current monthly opening price. The month of August was not good for stocks at all, but the month of September is not starting any better. We’re down about the same, about a half percent, 15 full points on the S&P 500.
We can see that same signal in it from an inverse standpoint, the dollar index pointing higher, the S&P 500 pointing lower, we have an MA-Diff cross that is forming to the downside, and again, when the pink line crosses over this blue line, but the neural index, once again, neural index strength, excuse me, is a powerful leading indicator. So our predicted RSI is going flat now, as money pours into the equity markets, the equity markets turn negative again. So again, we want to be very cautious about buying S&P 500 or even individual stocks in the month of September. We will have that opportunity, guys, from mid-October through to the end of the year, but not the best time historically speaking, looking at the seasonal pattern in the dollar and the seasonal in the S&P 500 also. This, of course, applies to the spies.
Now again, if we’re looking at moving our anchor points to random days, we’re not seeing what’s actually happening here. They’re already calling on Friday that the equities are bullish again when, in actual fact, they’re not. So when we look at this, if it comes down to which market, whether it be the dollar or the S&P 500, which one breaks lower? It’s heavily biased towards the S&P 500. Now nothing is 100%, guys, but looking at historical weather patterns, for example, we can gauge these markets the same way using very similar technologies with the correlated markets. So clearly, a cell signal is forming on the S&P 500, but remember, we’re coming out of summer trade here, and next week you still have a lot of people on vacation. So the week of the 11th is where we would put most of our focus, but I believe there will still be good opportunity this coming week.
Gold
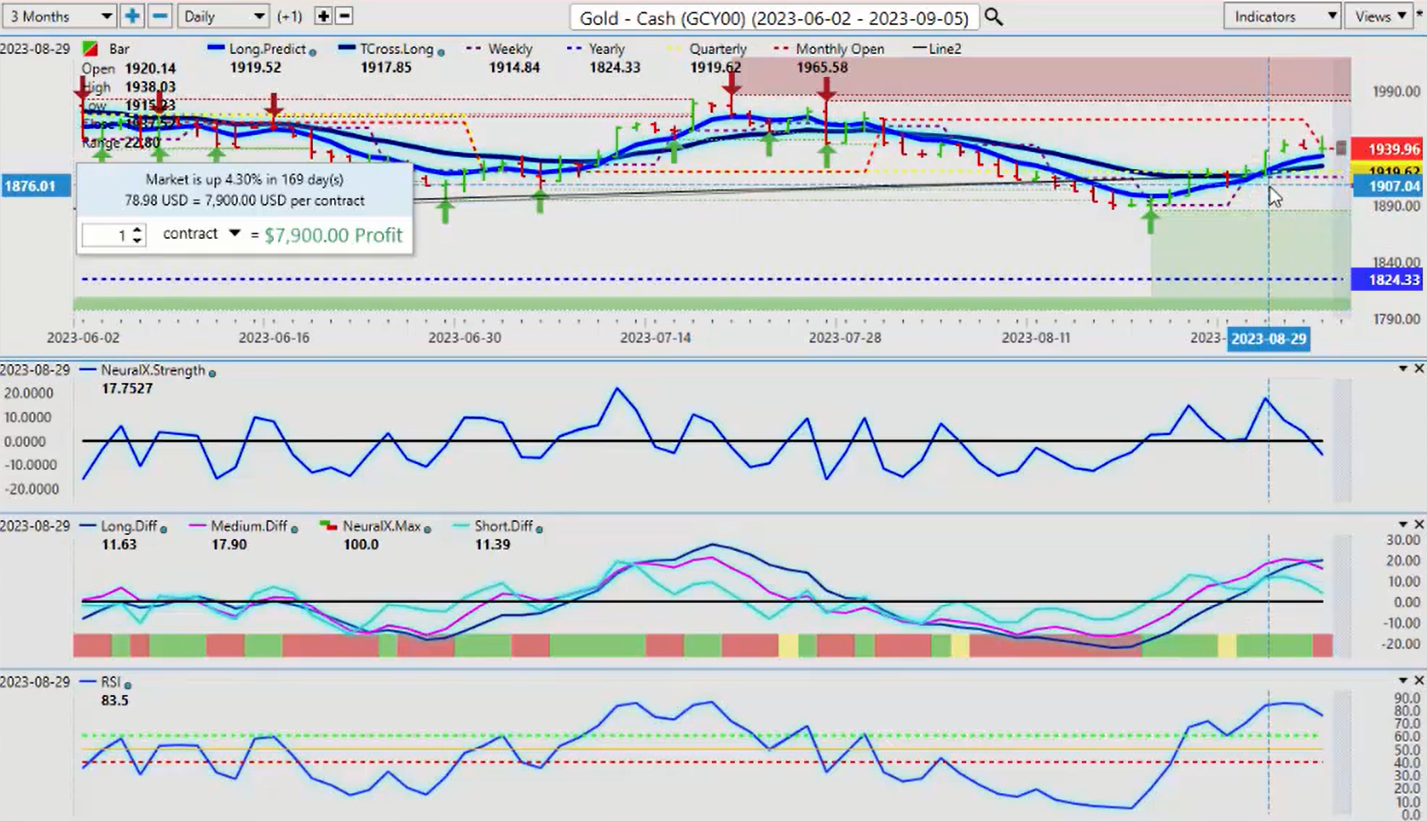
Now when we look at gold, gold has recovered again and again, very, very important to look and use accurate anchor points. So when we look at this, we’ve got the weekly opening price from last week at 1914, but more specifically, we’ve got the yearly opening price and my particular favorite at this time of year, the quarterly opening. So again, we’ve come down to that point. These are not random five days, random 30 days. We always want to make sure we start at the beginning of the month, the beginning of the week, the beginning of the year, the beginning of the quarter, so we can measure it accurately where this is. Now, it’s perfectly normal, I will say, for gold and the dollar to go up at the same time, but in most cases, ultimately, by mid-October, it’s the dollar that’s moving lower and gold is going higher, particularly into those September months.
But what’s of particular interest to me because the US, as we’ve seen last year, the dollar dictates all these other markets. So again, the neural index strength is pointing down. You can see it took several days for the actual neural index to get on board with this. But again, now we have an MA-Diff cross. We are closing on or about the monthly opening, 1939, so we’re closing just slightly above that in thinner or liquid holiday markets on Friday. But the monthly opening price here at 1939, we want to keep a very close eye on that, or a breakdown below the quarterly opening and the TCross Long, both of those two at 1924 and 1919. So again, a slight bias to the downside on a short-term basis on a more of a 30-day basis for gold as money pours into the US dollar.
Crude Oil
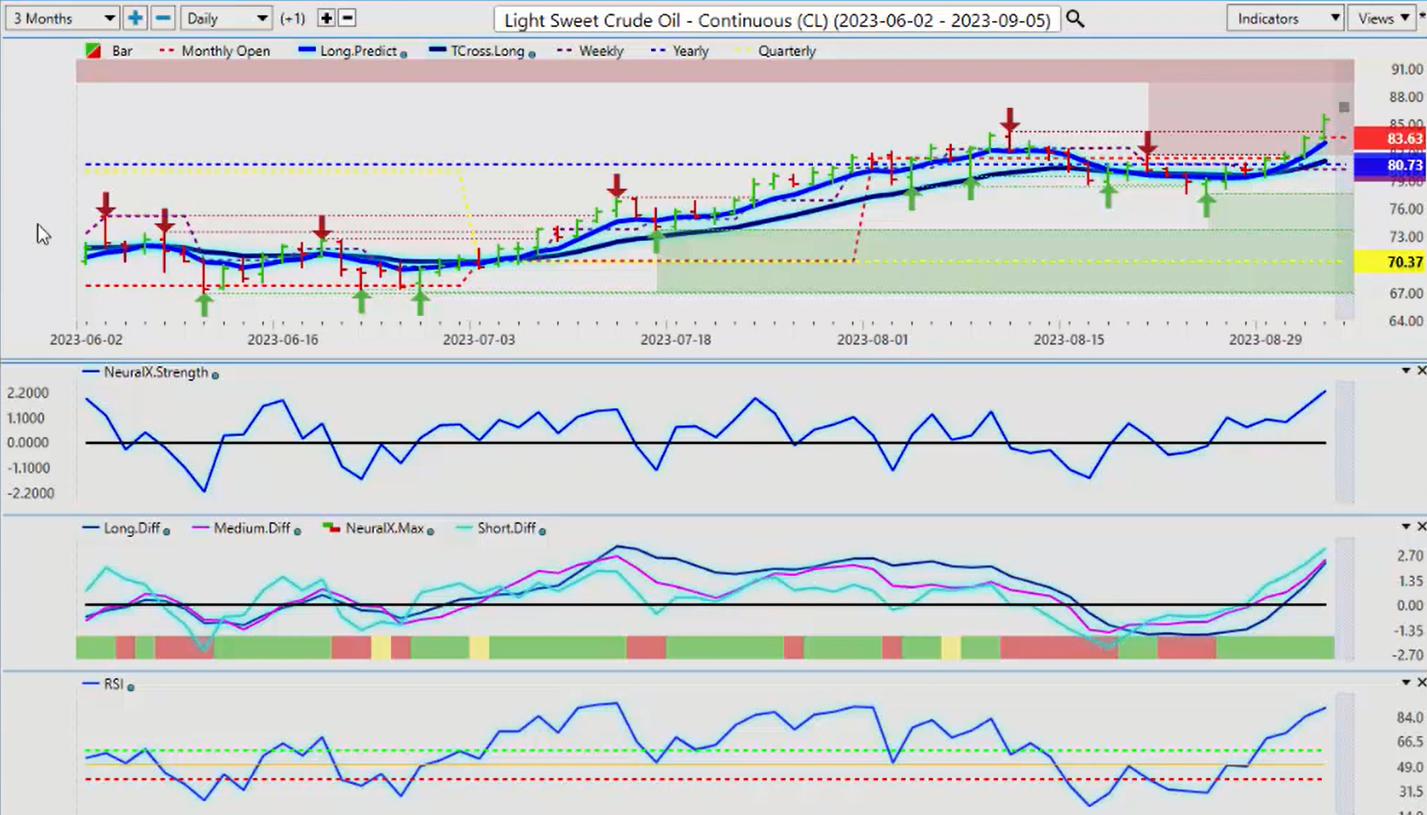
Now, when we look at light suite crude oil, a lot of manipulation going on here, guys, actually, a ton of manipulation with supply outputs, cuttings, artificially creating demand. Again, we’ve got to push through this verified resistance zone at 84.30, which I discussed last week, but be very cautious here, guys. This is the makings for a classic bull trap. And what I mean by that is most of the economies, particularly where I’m domiciled in Canada, they’re clearly showing contraction in the economy. They’re not showing expansion. So the probability that this is a bull trap is extremely high. So be careful of this. We watch our Vantage Point indicators very closely. I would respectfully submit, you watch for this neural index strength, the slope of it, to start pointing down. I’ve just given you three very good examples of how powerful that indicator is as a leading indicator. And if nothing else, we’re looking for a warning signal up here, that needle in the haystack that says, “Wait a minute, the fundamentals don’t really support this.”
Now we’re going to be at the end of summer driving season here in another week or two. So again, I would submit that oil is likely on the upside is on borrowed time here, predicted RSI, 90.2. Not a whole lot of momentum from here.
Bitcoin
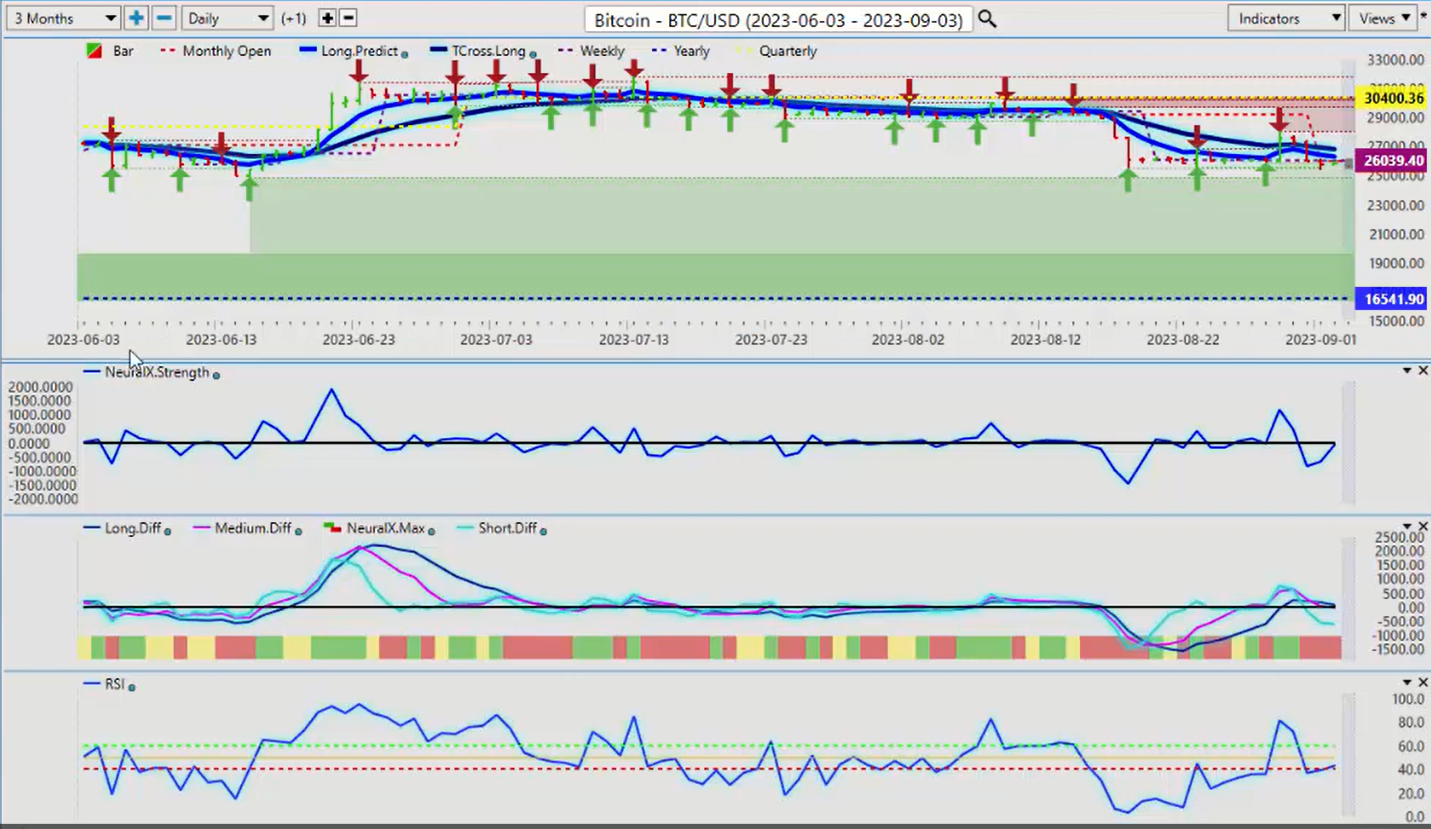
Now, when we look at Bitcoin, once again, I think we’re about three weeks away from my favorite, one of my favorite yearly trades, which is Bitcoin between mid-September and mid-October. Maybe we can squeeze it out a little bit longer than that. You can see that we’re all caught up in these verified zones down here, and no sellers, excuse me, down below 25,000. But again, I would expect them to try and flush the market out a little bit before we go into that known seasonal pattern towards the middle end of this month of September.
So be on the lookout for a potential opportunity to get long on Bitcoin or long on some of the Bitcoin stocks. HIVE, Hut 8 Mining, has been very popular since it was introduced last year as an inner market correlation to Bitcoin. Bitcoin goes up, blockchain stocks go up. So again, we’re a couple of weeks away. We’ve got to get through this US dollar strength, and once that passes, we should see Bitcoin starting to rise towards the end of the month.
Euro versus U.S. Dollar
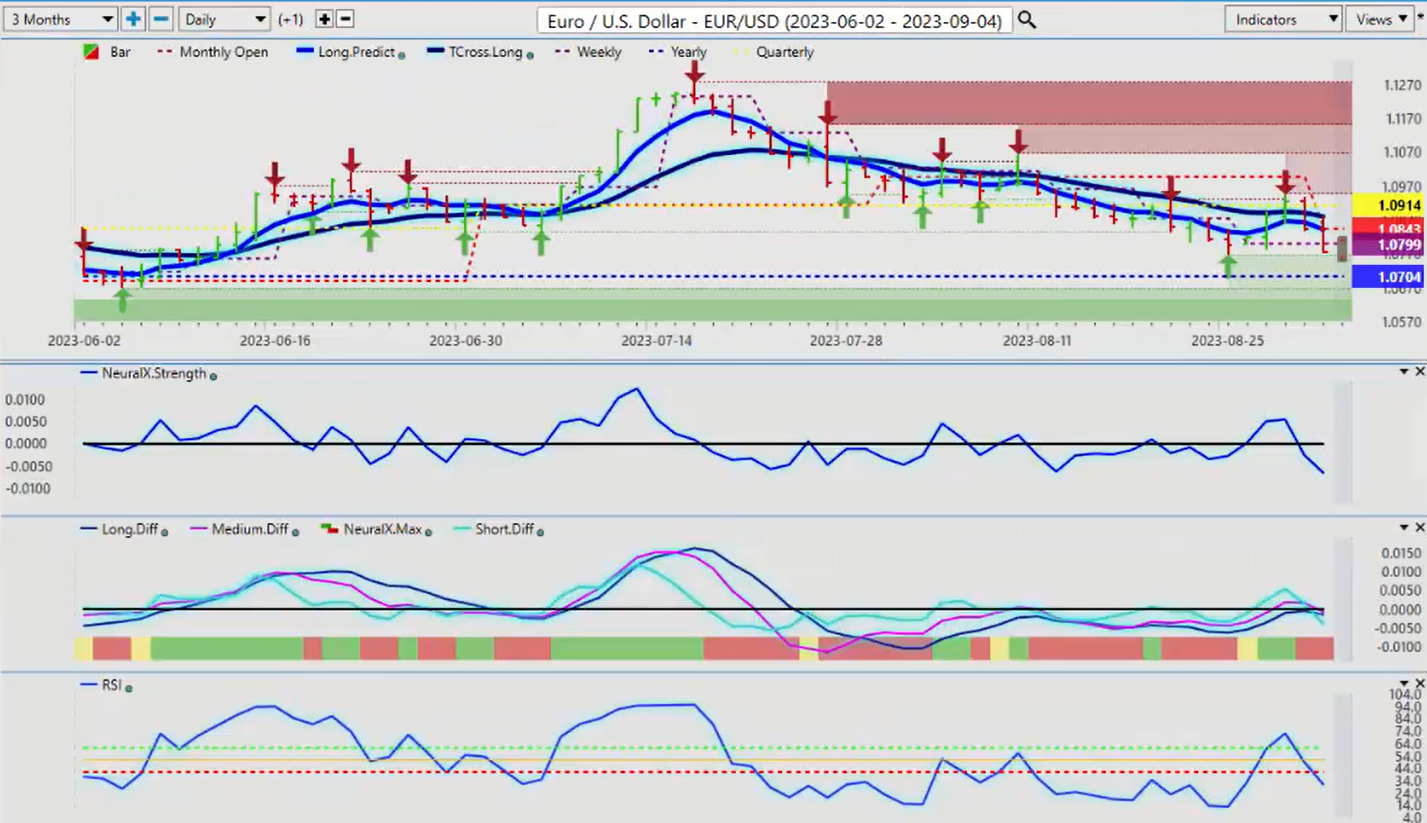
Now, when we look at some of the main forex payers again, the Euro unable to maintain, even though that payroll number on Friday was mixed. I would say it was not good at all, with the unemployment number going up, use six number rising, and the euro simply could not take it. Now, once again here, guys, I want to make sure that everybody can see this.
The yellow line is an accurate performance measurement of the quarterly opening, and you can see that the market is reacting to that quarter, trying to get above that critical level of 1.0914. And again, we worked on this on Wednesday and on Monday in the VantagePoint live training room, and what I had stated then, I’ll state here too very often, that’s what these banks do. They push it higher, and if they go higher, they’re getting a discount in selling euros and buying dollars. So again, a classic bull trap that you can avoid using proper anchor points and proper performance points, not the rolling 30 days, 365 days, 90 days, five days. These are random levels, guys, you’re going to get caught in these traps. That’s my only warning. So for me, this past week, this is knowing the US dollar is likely going to strengthen regardless of what that payroll number says.
Then you can see that’s a very strong anchor point. I suspect that we will challenge or break down below 1.0704 in the month of September because it’s one of the strongest months for the dollar. So again, the predicted differences are neural index strength. Guys, when you combine the predicted RSI, the neural index strength with the quarterly opening and the TCross Long, there was never a buy here guy. And again, I would caution everybody. I continue to have concerns about multiple media outlets here putting out false information, half-truths. We need to trade what we see, not what we hear, guys, and we can see, using this proper trade setup, moving away from this silly rolling performance model, we need to see, okay, can the euro turn positive in the US fiscal fourth quarter. Extremely unlikely from a technical, fundamental, or seasonal standpoint. So again, I would look for a fairly quick move over the next two weeks towards 1.0704 and a likely break of that particular level.
U.S. Dollar versus Swiss Franc
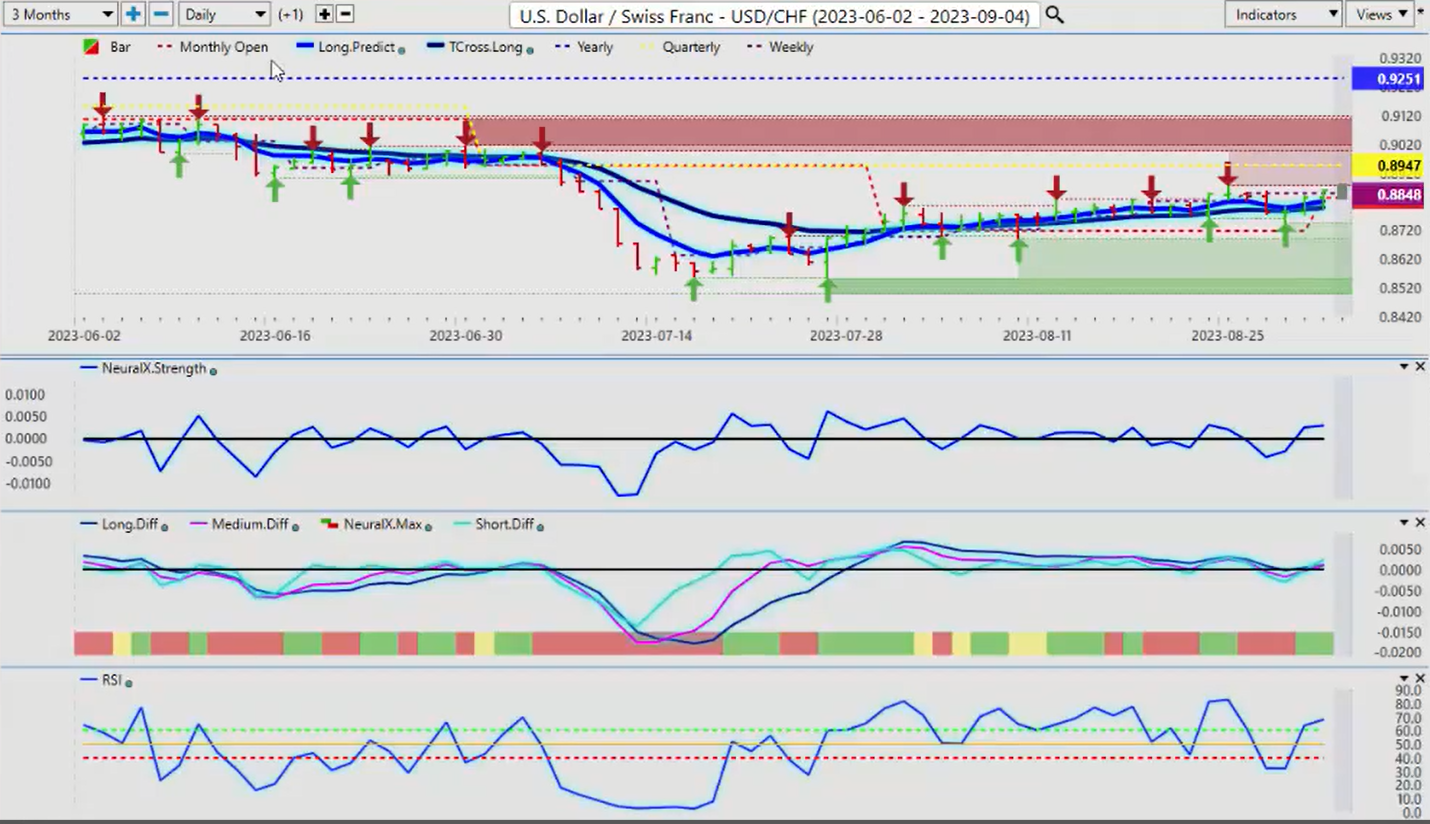
Now, if we’re looking for places of value to buy US dollars, even though it’s been in a very… the Swiss Franc has really been tough on the US dollar. There is a long trade here, guys, and using the VantagePoint TCross Long, you can see 0.8799, I can anticipate 0.8947 will likely be breached this month, barring any kind of risk-off scenario where there would be a flight to safety, not into the dollar but into the Swiss Franc and the yen. So be careful of that. But the indicators are setting up pretty good here, not bad at all, and I think we should be able to push higher, and this is likely a place of value only in the month of December and part of October to buy dollars against the Swiss Franc.
British Pound versus U.S. Dollar
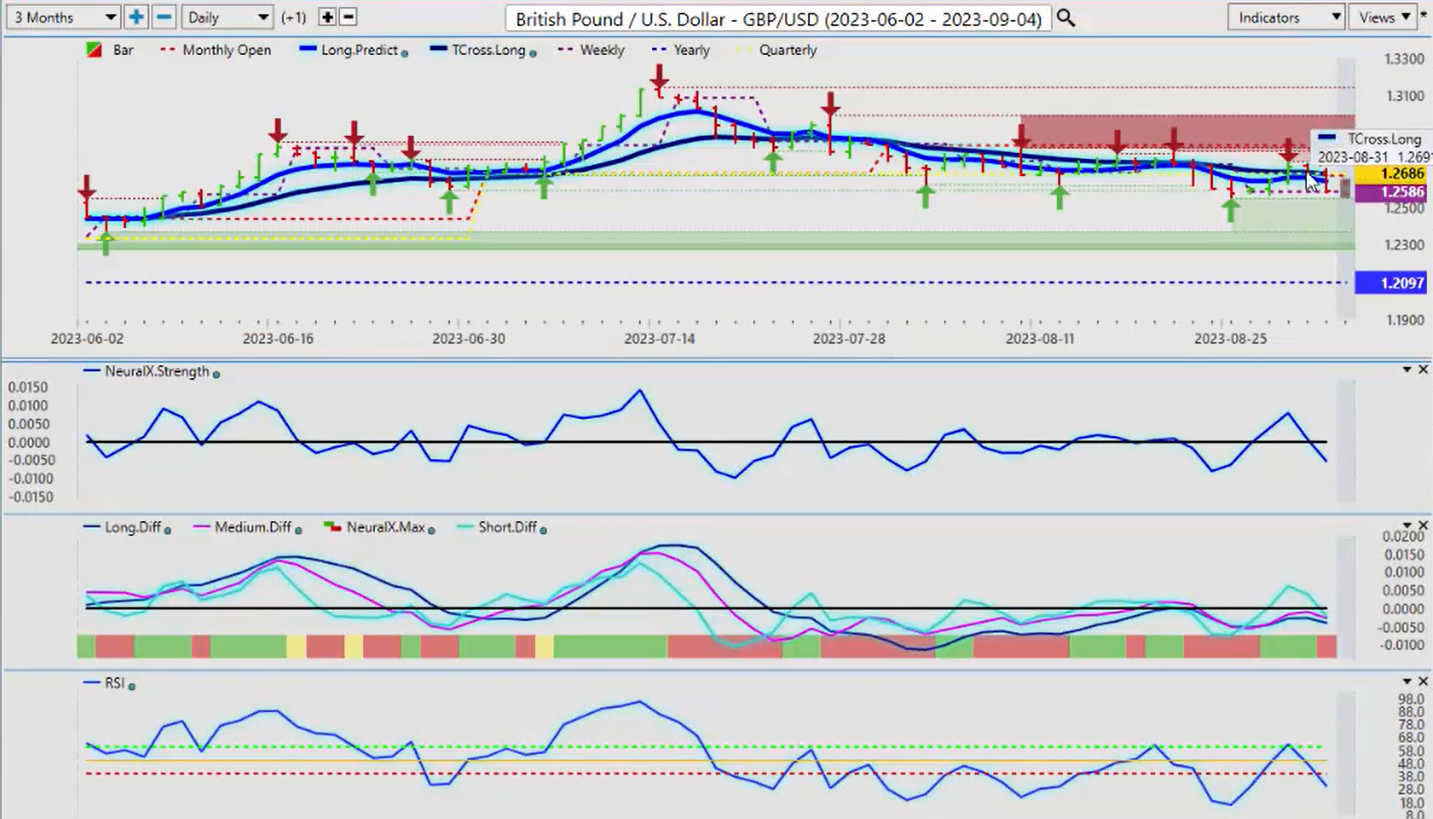
Now, when we look at the British pound for next week, again, succumbing to the current quarterly opening price. And again, guys, when we’re using intermarket correlations, we use these anchor points as intermarket correlations too. So if the dollar is holding above the quarterly opening price in the TCross Long, then I don’t want to buy cable here. I want to buy the dollar here instead. So a breakdown below this particular level, the monthly opening, we’ve already lost the quarterly opening. So again, if we lose that monthly opening price also at 1.2673, then you’re likely going to see a retest and maybe not of the 1.20 area, but I think this thing would drop pretty hard if the Euro breaks down also. The indicators there are in full support of that. The TCross Long, the Long Predicted, they’re all been breached. So barring, again, any kind of thing that would change Fed comments, I think that the Fed, it’s a wild card, guys. Okay.
U.S. Dollar versus Japanese Yen
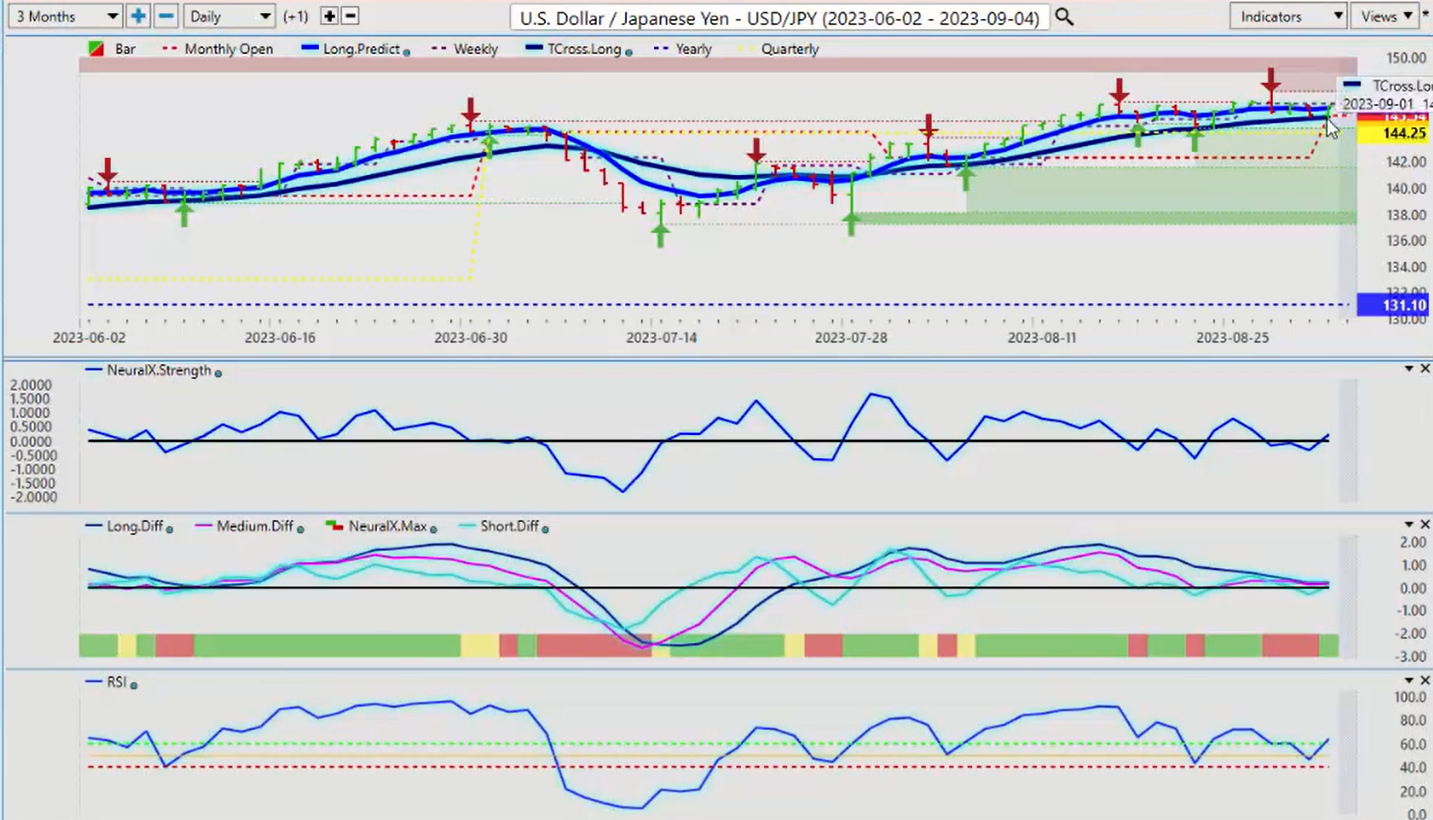
Now with the dollar yen, obviously the carry trade will continue to favor the US dollar here, but my concern is always whenever a central bank intervenes, like the Bank of Japan, it’s always a concern. Right now, we’ve got, again, a reverse check mark on that neural index strength, which is clearly pointing towards dollar strength. The interest rate differential alone, by definition, this is the carry trade, guys. The high interest rate from the Fed, the negative interest rate from the Bank of Japan, a hundred percent favors the dollar. That doesn’t necessarily mean it’s going to go higher. I want confirmation from these VP indicators, and I am getting it, but this pair will continue to be volatile. But again, guys, 144.25, the current quarterly opening price, that’s your pivot point. Make sure you’re not putting stops between there and that particular quarterly opening price, and as long as we hold above 144.25, the quarterly opening, then the bias remains to the upside even at these grossly overextended levels.
U.S. Dollar versus Canadian Dollar
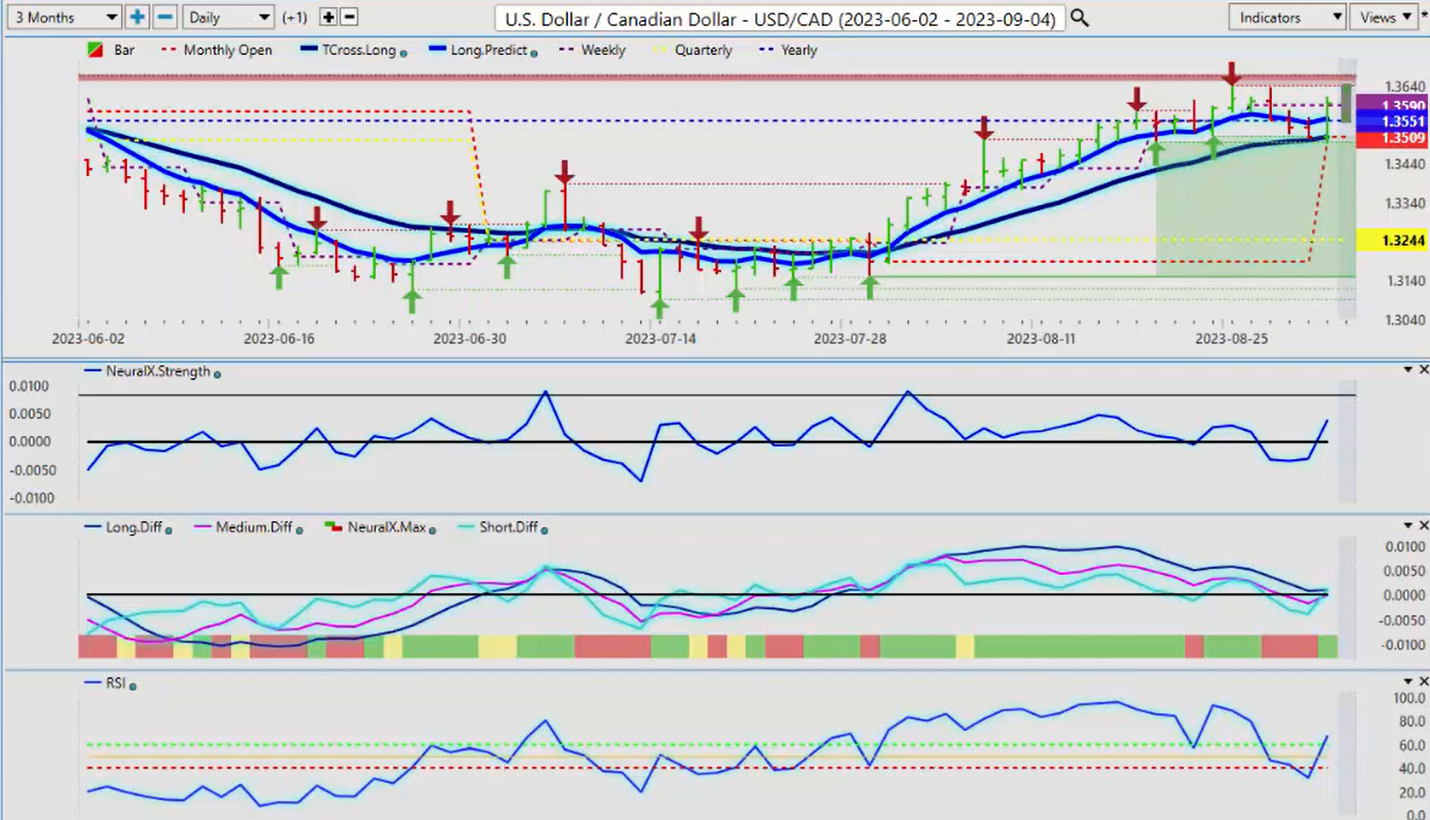
Now, when we look at one of my favorite pairs to trade, which is a… It’s been a tricky one, but I think the Bank of Canada has really put themselves in a very bad spot. The recent data coming out of Canada as I’ve stated along these rate hikes were unnecessary, and now they’re going to have to backpedal. So the volatility… the Bank of Canada is coming next week, and it’s going to be very difficult for them to spin any of this for further rate hikes. They should only be talking about cuts. The Canadian economy is clearly in contraction. It is not in expansion. The last rate hike here was overkill, would be an understatement. The Canadian Press in Canada here, they’re saying, “All pain, no gain.” they’re bracing for mortgage defaults. There’s a lot of things going on there, guys, but again, you can’t just borrow this kind of money over and over and over again and expect the banks not to hike rates on you.
So for now, the TCross Long is showing a very, very strong possibility of this breaking towards the 1.39, 1.38 area, the quarterly opening, 1.3244. This is in a very strong move here, the yearly opening price coming in at 1.3551. If we look at this for Tuesday trading, we’ve basically got the VantagePoint predicted low around the same area. This is a pretty easy trade setup, and even as we saw on Friday, oil prices broke higher. So did the US-Canadian pair. That tells me, right there, that the even higher oil prices, and even if the stock market goes higher, that is not necessarily going to save the Canadian dollar here. So watch this area very, very closely, and I think there is still a good long opportunity there.
Australian Dollar versus U.S. Dollar
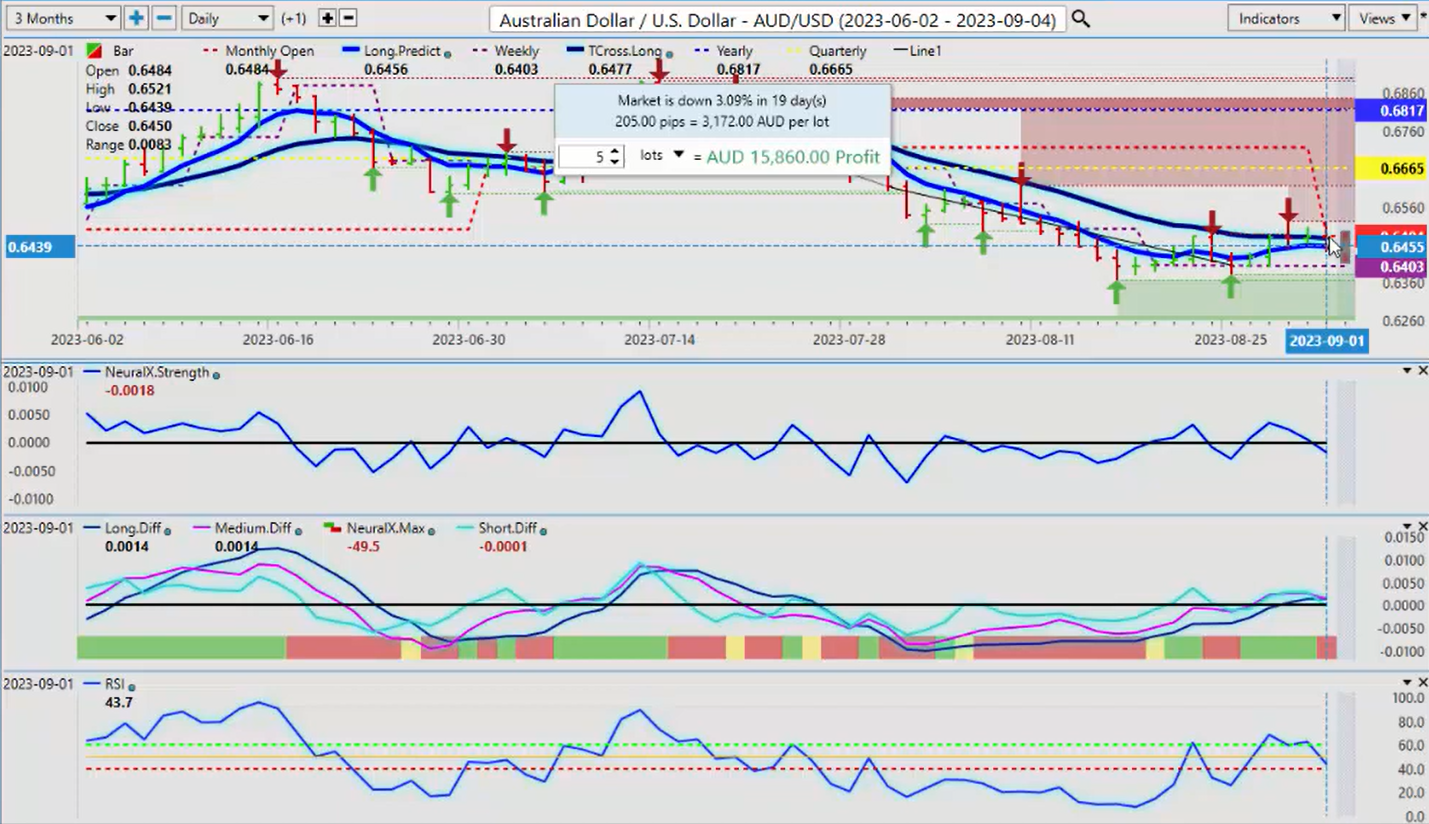
Now, as we look at the US-Canadian counterparts, we would immediately go to payers like Aussie US. Now, with the Aussie and the Kiwi, they are unlikely to have a good month either. When we look at the Aussie, this is a pretty dire looking picture here, below the yearly opening price, below the quarterly opening, unable to even get above the weekly or the monthly opening price. So right now we’ve got a fair bit of resistance around that monthly opening, 0.6484, a verified resistance high slightly above that, 0.6522. I don’t think an equity market rally is going to save this pair, but we do have the RBA this week. They’re going to be announcing their interest rates. We’ve already got a couple of shocks from them. So in my respectful opinion, I’d never trade the news guys, and I never trust that a central bank will do what I think they should because everything they’ve done to date is the exact opposite, in my respectful opinion, of what they should have been doing.
They promised us that even with the FOMC, 0.95, that’s as high as they were going to go, and they’ve ended up hiking almost to 5% or over. So this is craziness, guys. So the RBA is likely to flip-flop again, and maybe will they talk about cuts? I don’t think so, but they may remove the language of higher for longer.
New Zealand Dollar versus U.S. Dollar
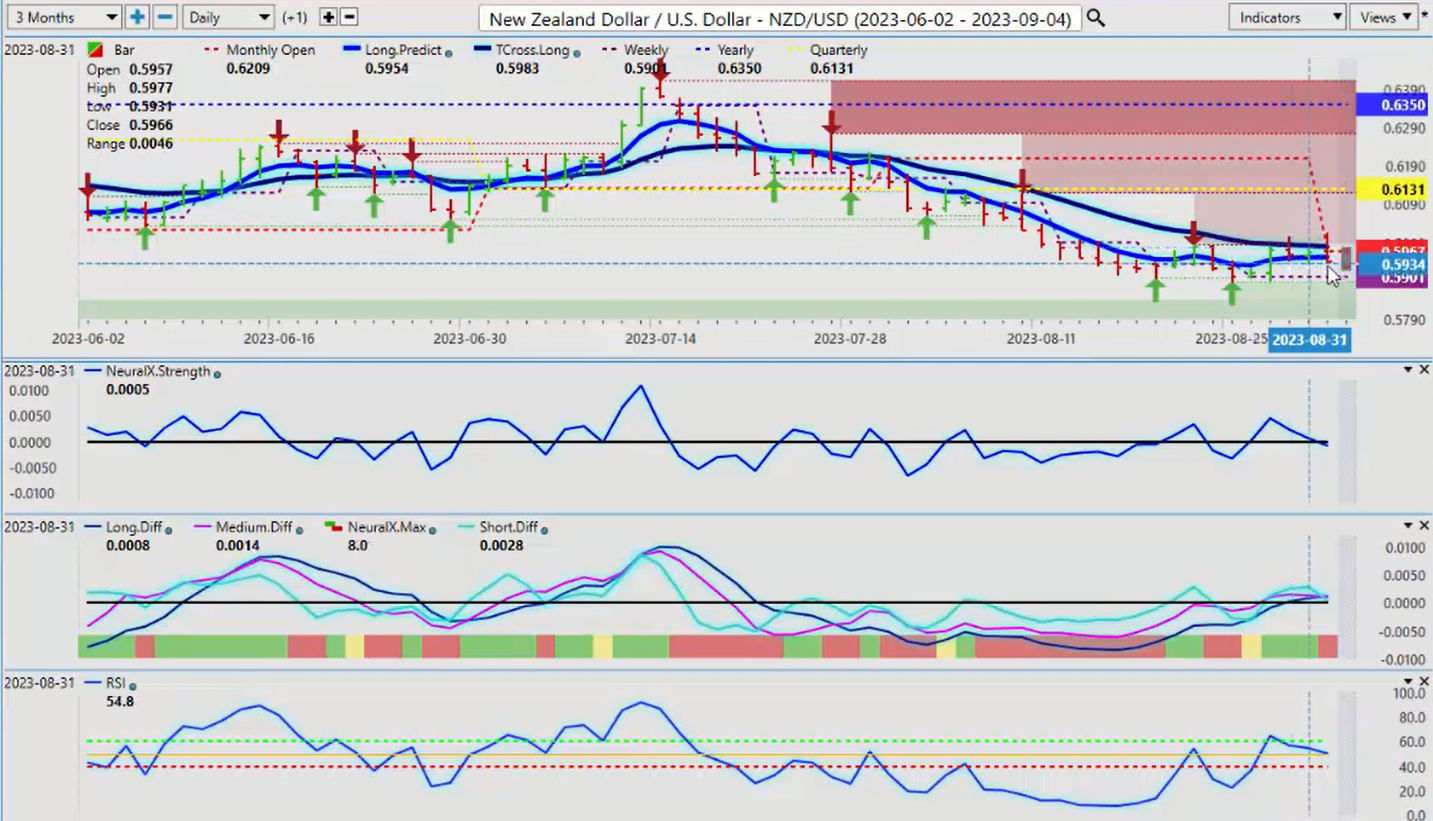
I think we will see something very similar with New Zealand, and you can see it banging into the VantagePoint TCross Long on a daily basis. But again, combine that with that neural index strength indicator, and it gives us that warning sign if nothing else, that while it may look bullish, it probably isn’t because the medium-term and shorter-term calculation, using the correlation of 31 other markets in that neural index strength, it’s saying, “These inner markets are not on board here,” and in actual fact, the rats are leaving the sinking ship, is what it actually looks like here.
So it’s these types of indicators we look for, guys, to not only point us towards better trades but to try and keep us out of the bad ones that the media continues to put people into. So with that said, this is the VantagePoint AI Market Outlook for the week of September the 4th, 2023.

