-
View Larger Image
Welcome to the Artificial Intelligence Outlook for Forex trading.
VIDEO TRANSCRIPT
Hello everyone. Welcome back. My name is Greg Firman, and this is the VantagePoint AI Market Outlook for the week of January the 8th, 2024. Now, to get started this week, we’re going to do things a little bit differently this week as we look at, again, the main intermarket correlations and what to watch for going forward into the start of the new year. And we do this by leveraging our current yearly opening price, quarterly, monthly opening price. It’s very important that we’re looking at these particular levels.
Crude Oil versus U.S. Dollar Index
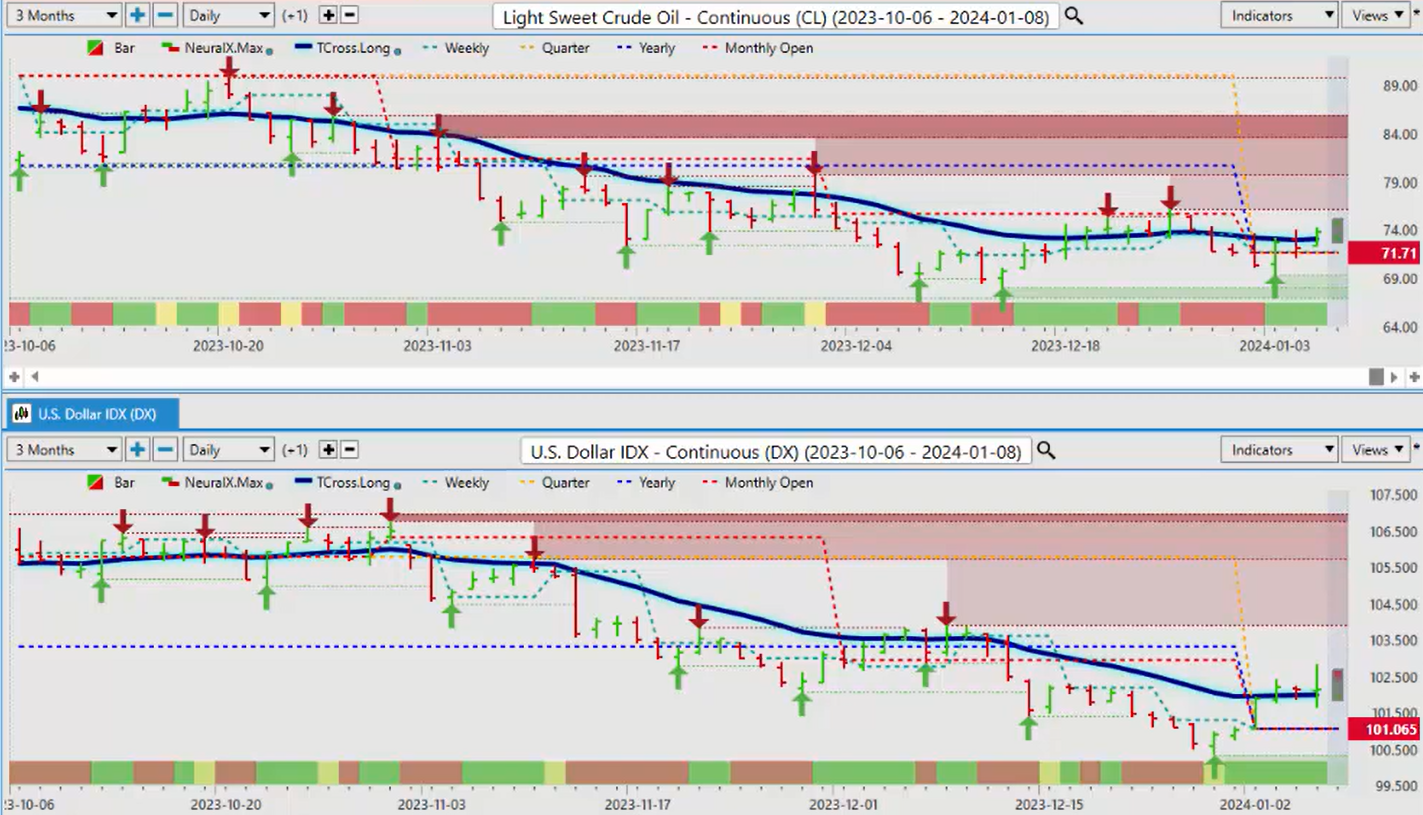
While at the same time identifying direct intermarket correlations. So when we look at the US dollar Index right now, it’s moderately bullish, but again, we’re in the first starting the second week of the new year, and very often price will move on either side of that current yearly opening price. Now our T cross long on the dollar Index is coming in at 102, and this is a critical level that we need to hold above because, again, in most cases the dollar Index sells off by the Tuesday or Wednesday after the non-farm payroll number. We have CPI coming out this week, but always remember that the CPI is a lagging indicator; it’s December, not January in that CPI. So the inflation data may not be quite as important as some people might think. But when we do a comparative, we can see a direct positive correlation to light sweet crude oil so we can look at both of these two not in isolation but against one another. So light sweet crude oil rebounding with the dollar Index , but if the dollar turns lower, oil is likely to turn lower also based around this positive correlation over the last 60 to 90 days.
Gold versus U.S. Dollar Index
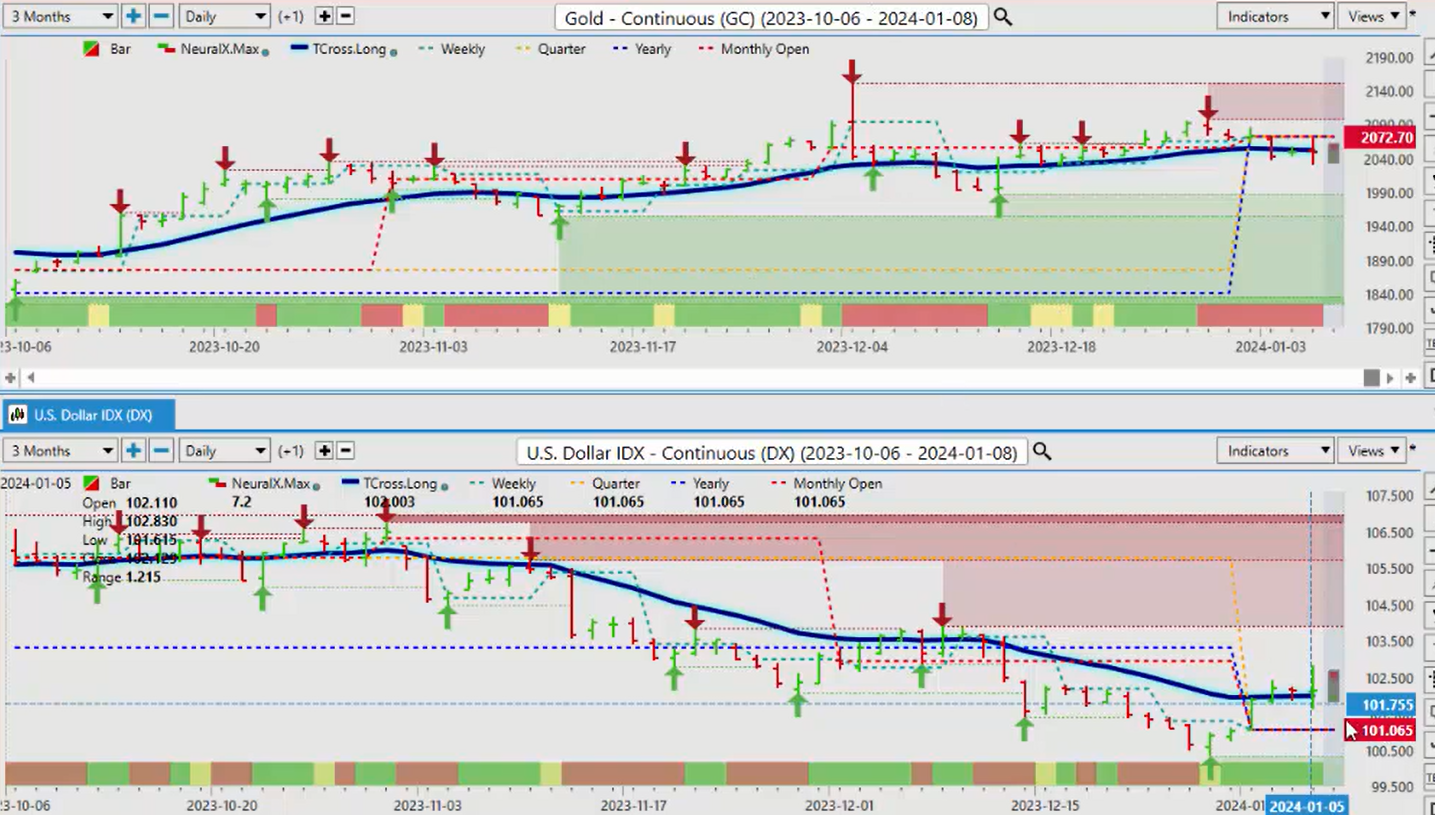
When we do a comparative analysis to Gold , we can see that as the dollar tries to rebound here to some degree still struggling around this 102 area, gold is also struggling but right against its current yearly and monthly opening price. That level coming in at about 2072. We would look for gold to break above that area to confirm an uptrend while the dollar breaks down below its current yearly opening price, which is coming in at 101.06. But the first trigger for the dollar again would not be able to hold above 102, but right now, gold looking slightly bearish but that’s normal for the first week or two of January.
S&P 500 versus U.S. Dollar Index
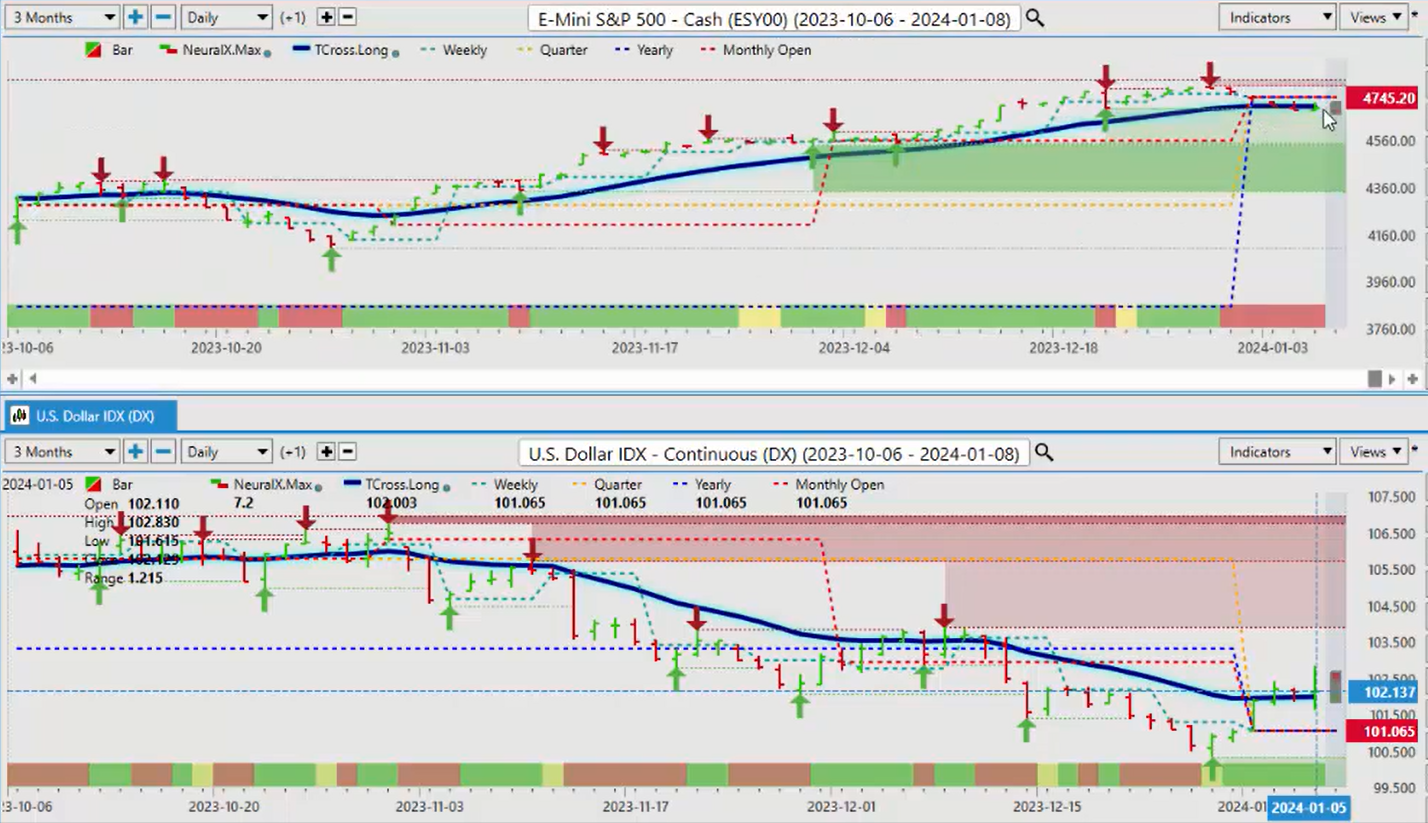
When we look at the S&P 500 against the dollar , we can see a direct inverse correlation meaning the dollar up, the S&P 500 down, but we’re struggling along the Tross long 4705. This is the area that we want to watch very, very closely on Tuesday, Wednesday, Thursday of next week. I believe we can rebound here but we need that dollar selling off first to confirm that stocks can move higher but very, very toppy up here I certainly would concede that point but if we can get above the current yearly opening price 4745. Another way to play this is that if we believe that ultimately stocks go higher in mid to late Jan or mid-January then we would put limit orders above that yearly opening price at about 4748 to trigger along as we start moving back up.
Bitcoin versus U.S. Dollar
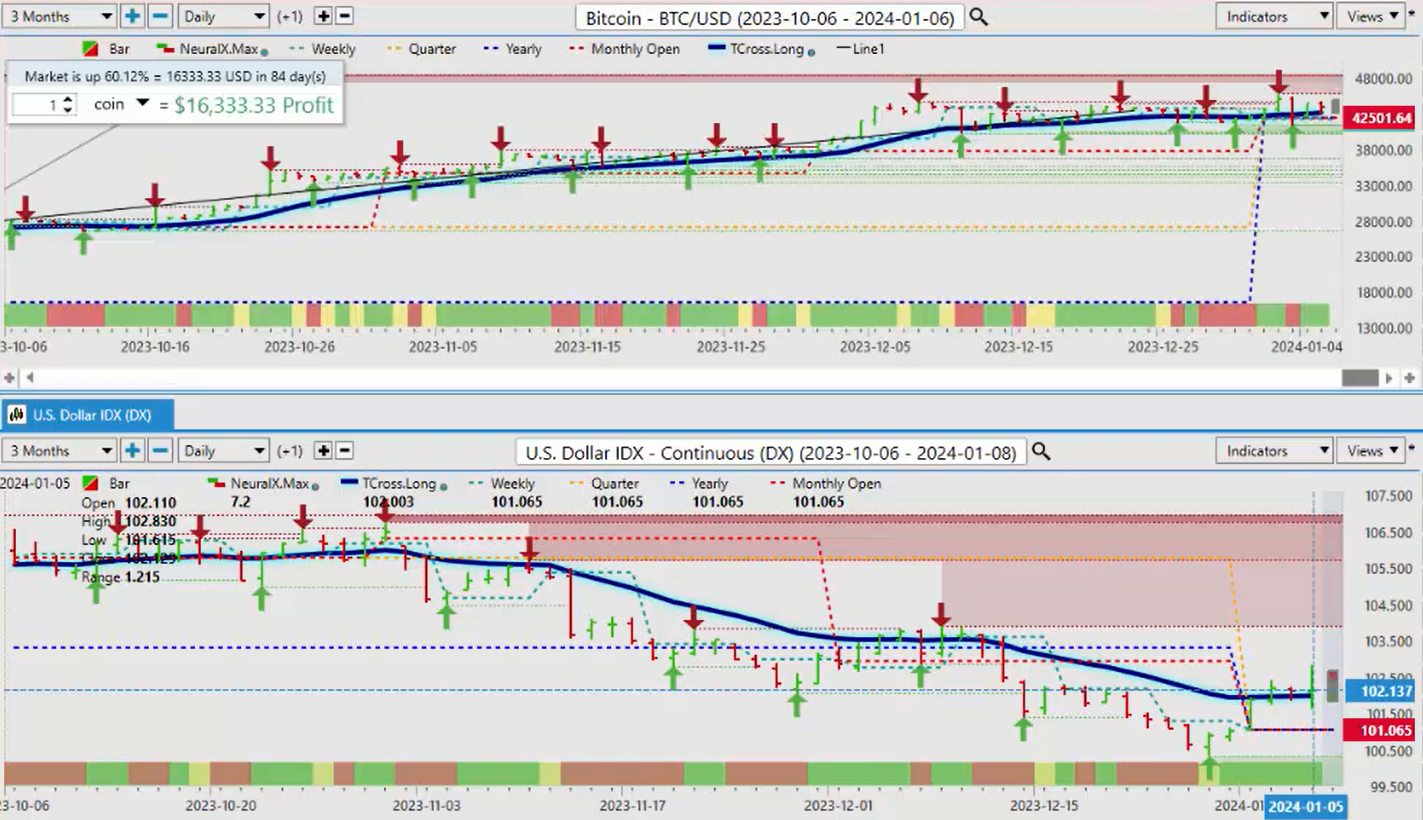
When we do an additional comparison to Bitcoin , Bitcoin’s come out of the year very strong, holding above its current yearly opening price. That level specifically is 42,501. We would look for Bitcoin, if we’re going to continue to buy Bitcoin or anything related to Bitcoin, Bitcoin ETFs like BITO , GBTC , or maybe Hut Mining . We want Bitcoin to remain at these elevated levels. I believe that 2024 will be another good year for Bitcoin, but we will always have those pullbacks, and we want to use those, currently at least, as a buying opportunity.
$VIX versus The U.S. Dollar Index
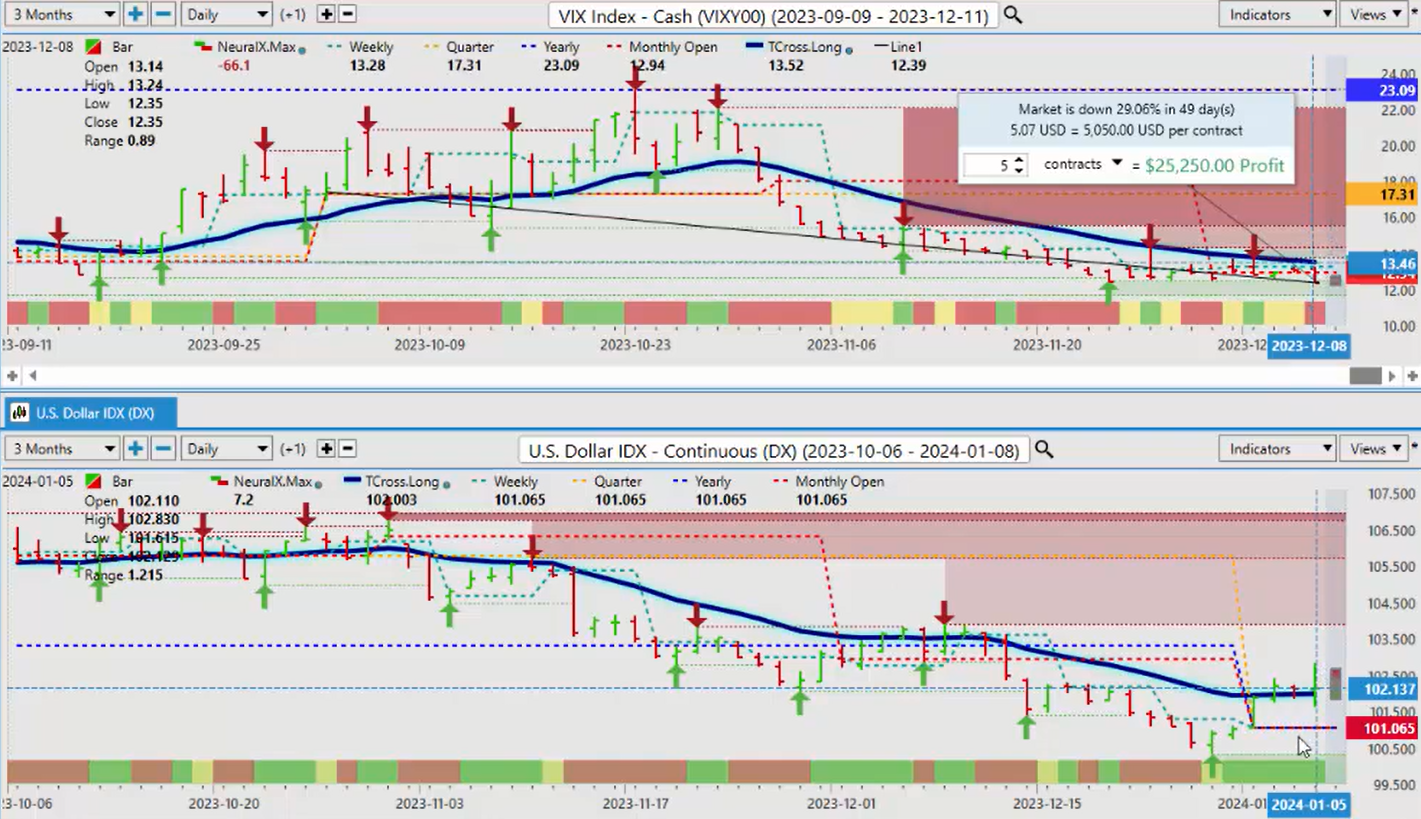
Now, when we do a comparative analysis here to the VIX , we can also see the very, very high correlation between the dollar Index and the VIX . Dollar Index rising, we should see some activity here with the VIX also because a very strong positive correlation to that. So again, we will see how this one plays out. But in my respectful opinion, only there’s a bias towards Equity strength versus dollar strength. But the dollar is the determining factor, but the positive correlation between these two if one goes up, the other one will likely follow. But right now, the VIX is saying any gains on the dollar are likely to be limited while we hold below 13.52 on the VIX .
Euro versus U.S. Dollar Index
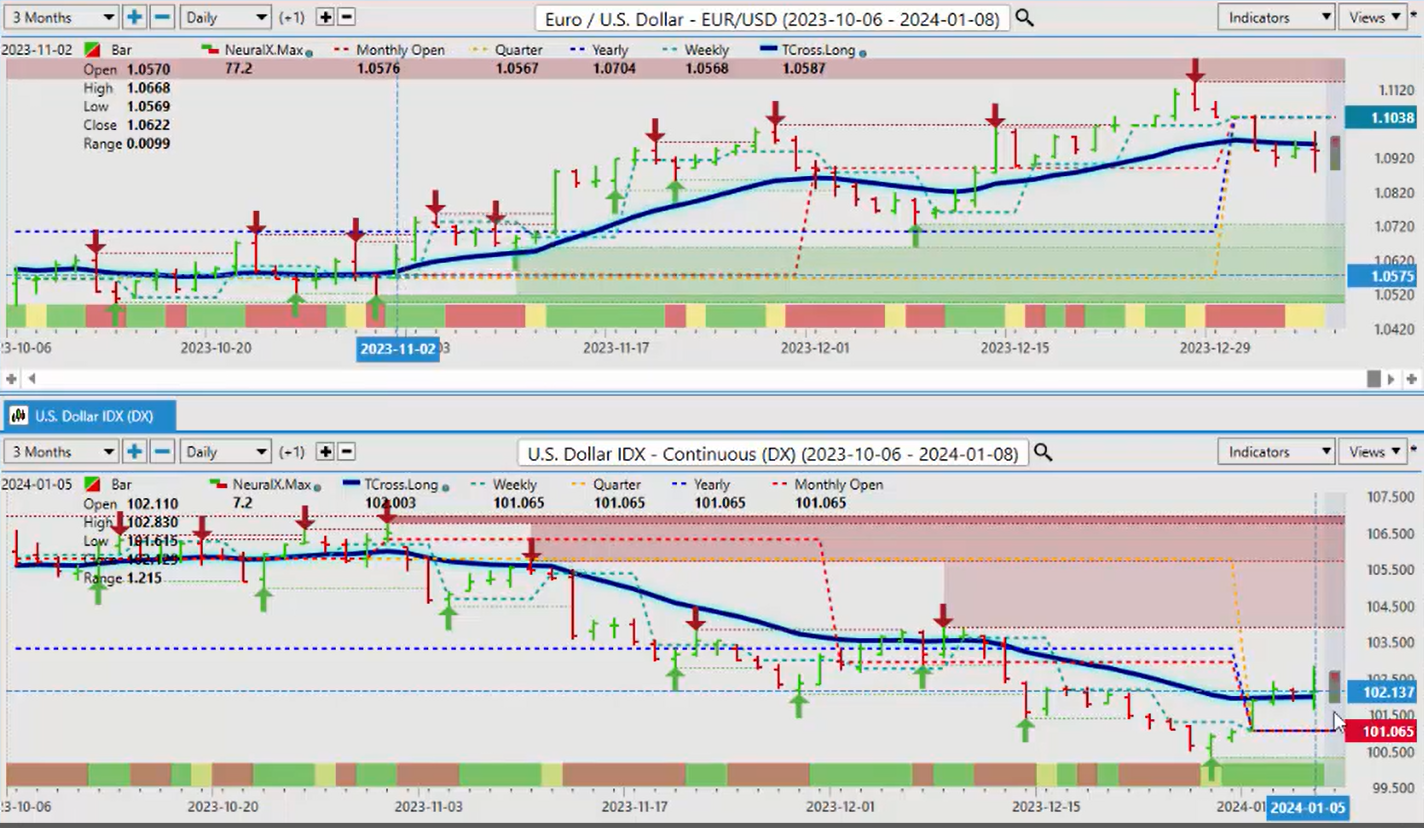
Now when we look at some of our main intermarkets, looking at those correlations, we can see the high inverse correlation between the dollar Index and, of course, the Euro US pairs. So the Euro , again, struggling to make any gains on the year, our yearly opening price there 110.38. The indicators right now we can see caution even though the Euro is moving lower, and we’ve closed below our T cross long. The neural index is not overly supportive of additional shorts at this particular area. So I would respectfully submit we would look for a rebound in the Euro , but we want to get above our T cross long at 109.59, and then we could put additional buy limit orders above that current yearly opening price of 110.38.
Swiss Franc versus U.S. Dollar
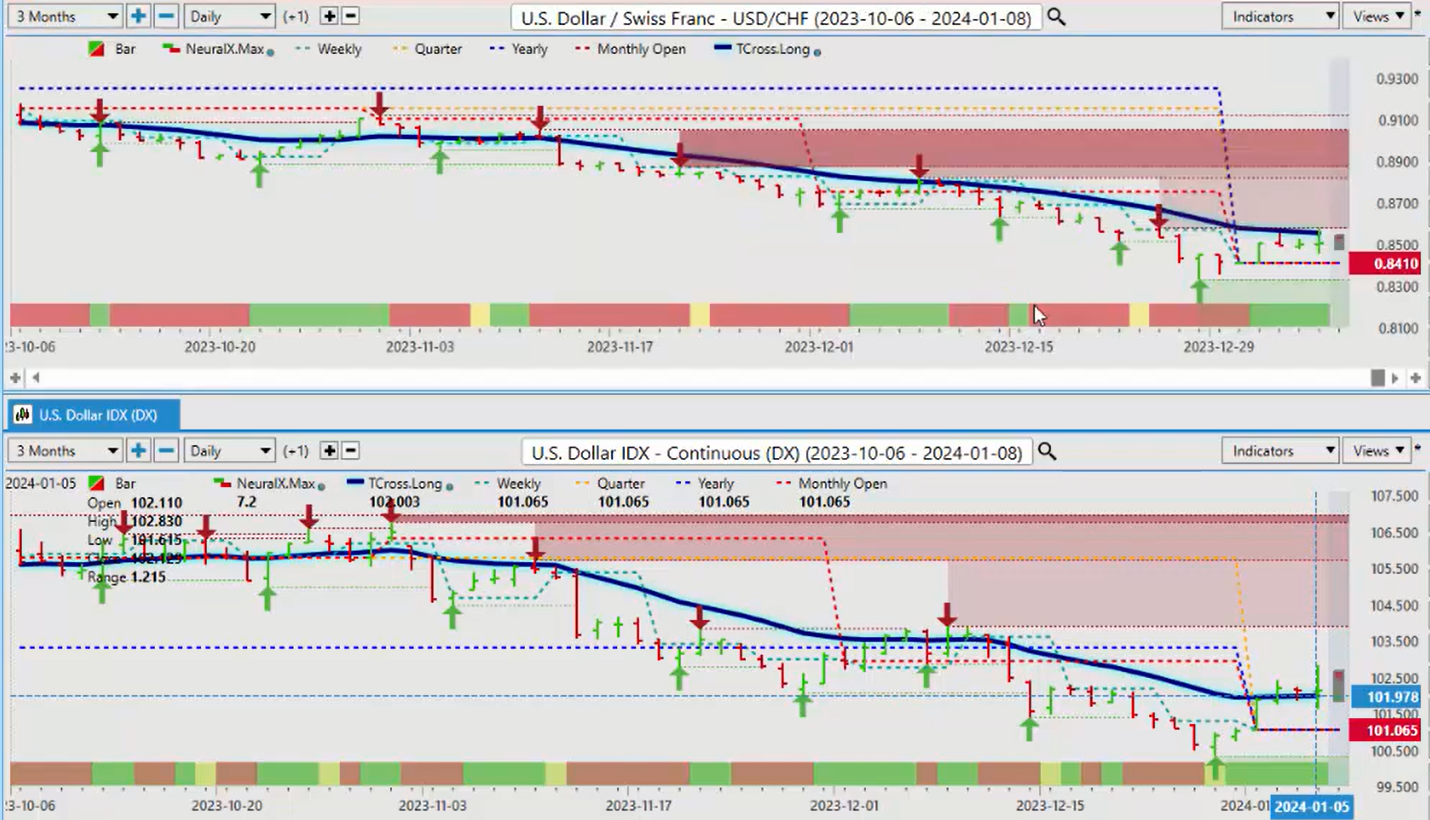
Now the US Swiss Fran c has come up again; it’s being contained even with the dollar strength. There’s a very, very high correlation between the dollar Index and US Swiss Fran c, so US Swiss Franc could be a leading indicator to warn us that the dollar weakness that predominantly occurs the week after the non-farm payroll number, the Wednesday after the non-farm payroll number is still a strong possibility. The US Swiss Franc holding above its yearly opening price, but we’re not getting past our Vantage Point T cross long at 85.54. This is the level we want to keep our eye on for next week. If we cannot break above this level, then the dollar is likely to weaken, making an excellent area to set up our short positions and also focusing on longs on pairs like Euro US . So again, we’ll watch that level very, very closely for a break.
But if we can’t break that, then US Swiss Franc would likely follow the dollar Index lower.
British Pound versus U.S. Dollar
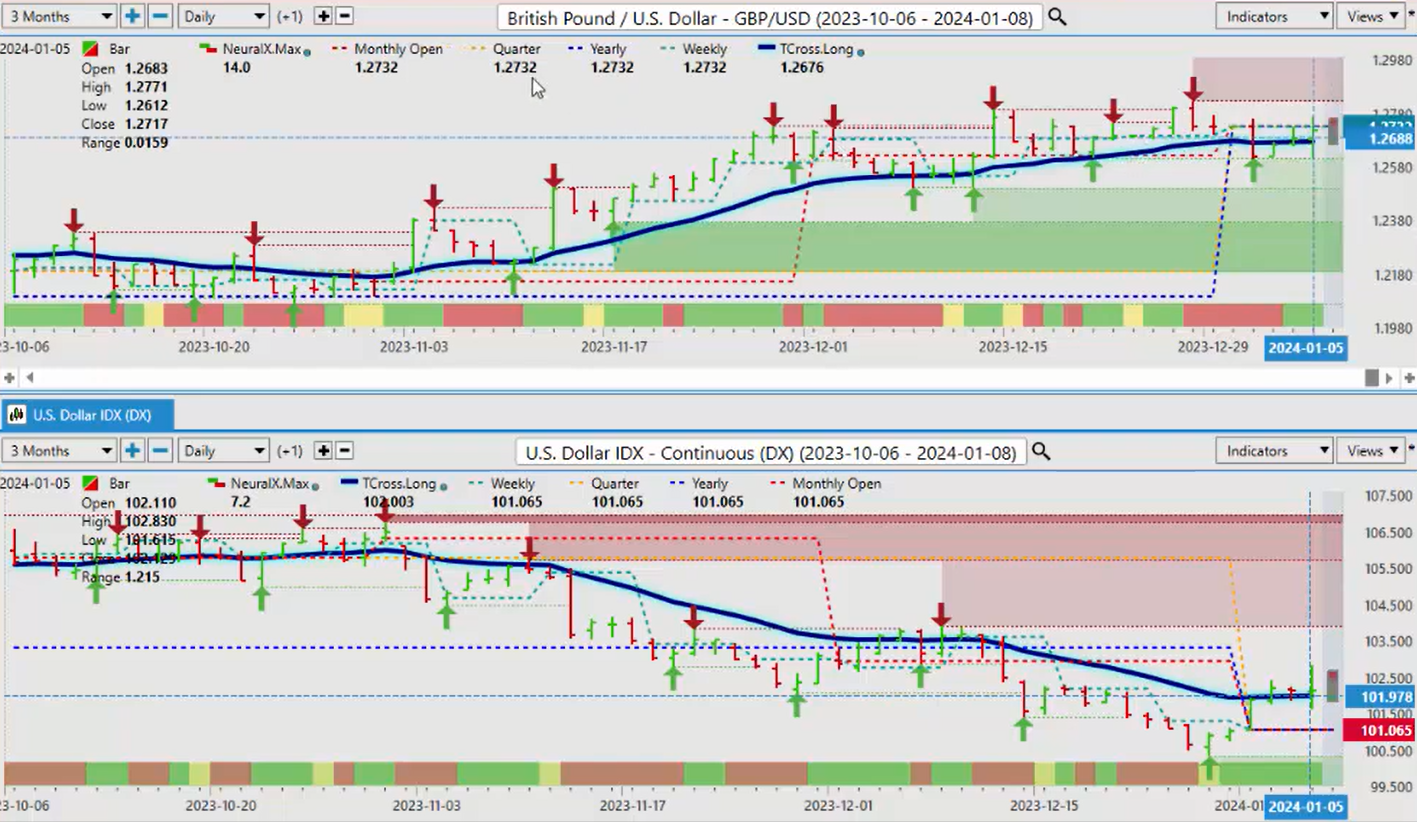
Now, as we look at the British Pound US Dollar , once again, we’re being contained by the yearly opening price but just barely 127.32. We’ve closed at 127.17, so a pretty good move for cable here trying to make that move higher, but we are still closing below the current yearly opening price but above our T cross long 126.76 is the key level for next week. We can see the clear inverse correlation between the dollar Index and the British Pound . Dollar down, dollar Index down, British Pound US Dollar up. We’ll continue to monitor this, but there is still a bullish tone to this particular currency pair if the dollar cannot advance.
U.S. Dollar versus Japanese Yen
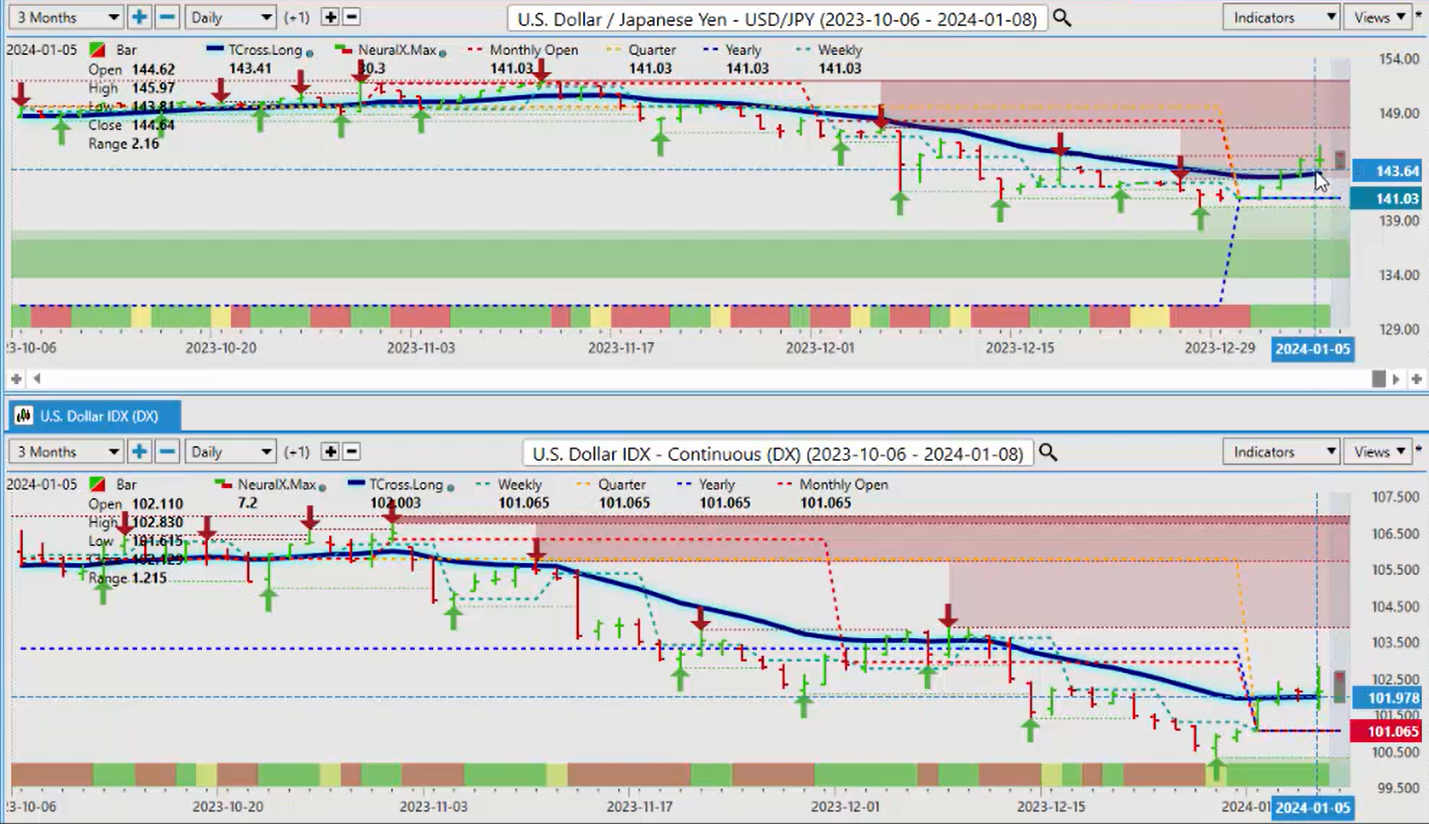
Now with the dollar Yen , I think the million-dollar question, going literally the million-dollar question in 2024, is will the carry trade continue? That is going to be dependent on the Fed’s next move. But I think either way there will be an interest rate differential change which still favors the US dollar. We’re holding above our yearly opening price, our T cross long. But with the volatility around the earthquakes in Japan, we have to be mindful that there could be a major repatriation of Yen back to Japan if that situation there worsens. So again, we’ll monitor things. Right now, the dollar Yen is only moderately bullish.
If gold breaks higher, this pair will be affected either way. So we’ll keep an eye on our T cross long coming in at 143.41, but the yearly opening price 141. Another way to play this is simply set up your sell limit orders below the TR cross Vantage Point TC cross long at 143.41 and additional shorts below the current yearly opening price at 141.03. But if we can’t get below our Vantage Point T cross long, then there’s still an upside bias, at least for the time being. But my concern is again, if the carry trade is being reinstated at the beginning of the year, then even if the dollar sells off against the other pairs, it could still make headway against the Yen.
Australian Dollar versus U.S. Dollar
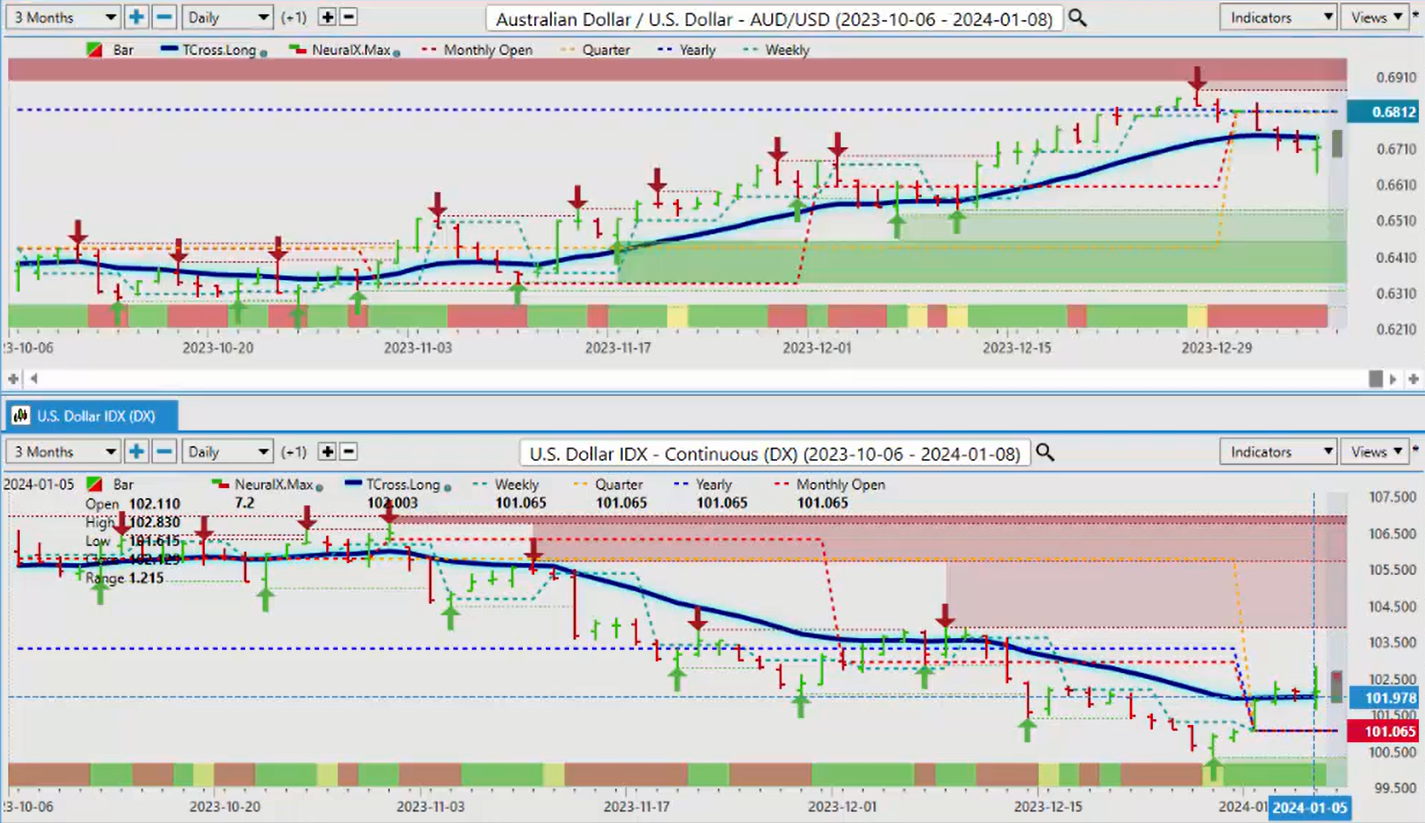
Now when we look at the additional pairs, I believe there’ll be some pretty decent value in buying the Aussie and the kiwi in 2024. So when we look at this right now, once again, the Aussie is not starting the year off well. We failed at the yearly opening price, but I believe this thing can turn around. It’s just a question of getting some momentum in the equity markets, getting the commodity prices back up. But our Tcross long 67.40 we need to break above this particular area to get the Longs in motion. Guys half the battle is identifying a key pivot area to buy and sell from. If you believe that the dollar is going to strengthen, the Aussie is going to weaken again, then the T cross long at 67.40 is where you would put those shorts and your stops above the yearly opening price at 68.12.
But again, I believe the dollar will follow its normal weakness in the month of January and part of February. And then we can reassess from there. But again, the Aussie does not make up any part of the dollar Index but still responds to Dollar strength and weakness.
New Zealand Dollar versus U.S. Dollar
The Kiwi is a very, very similar trade here. We can see that the Kiwi is slightly stronger than the Aussie but not by much. The Chart is basically the same. So we’re in a bit of a holding pattern as we start the official first week of trading again in my respectful opinion with the holiday short week, the banks, most of the banks out last week and on holidays, etc.
But everybody will be back in the market by Tuesday of this coming week. And that’s when we’re going to start to see the real price show itself. So with that said, this is the Vantage Point AI Market Outlook for the week of January the 8th, 2024

