-
View Larger Image
Welcome to the Artificial Intelligence Outlook for Forex trading.
VIDEO TRANSCRIPT
Okay, hello everyone, and welcome back. My name is Greg Firman, and this is the VantagePoint AI Market Outlook for the week of May 20th, 2024.
U.S. Dollar Index
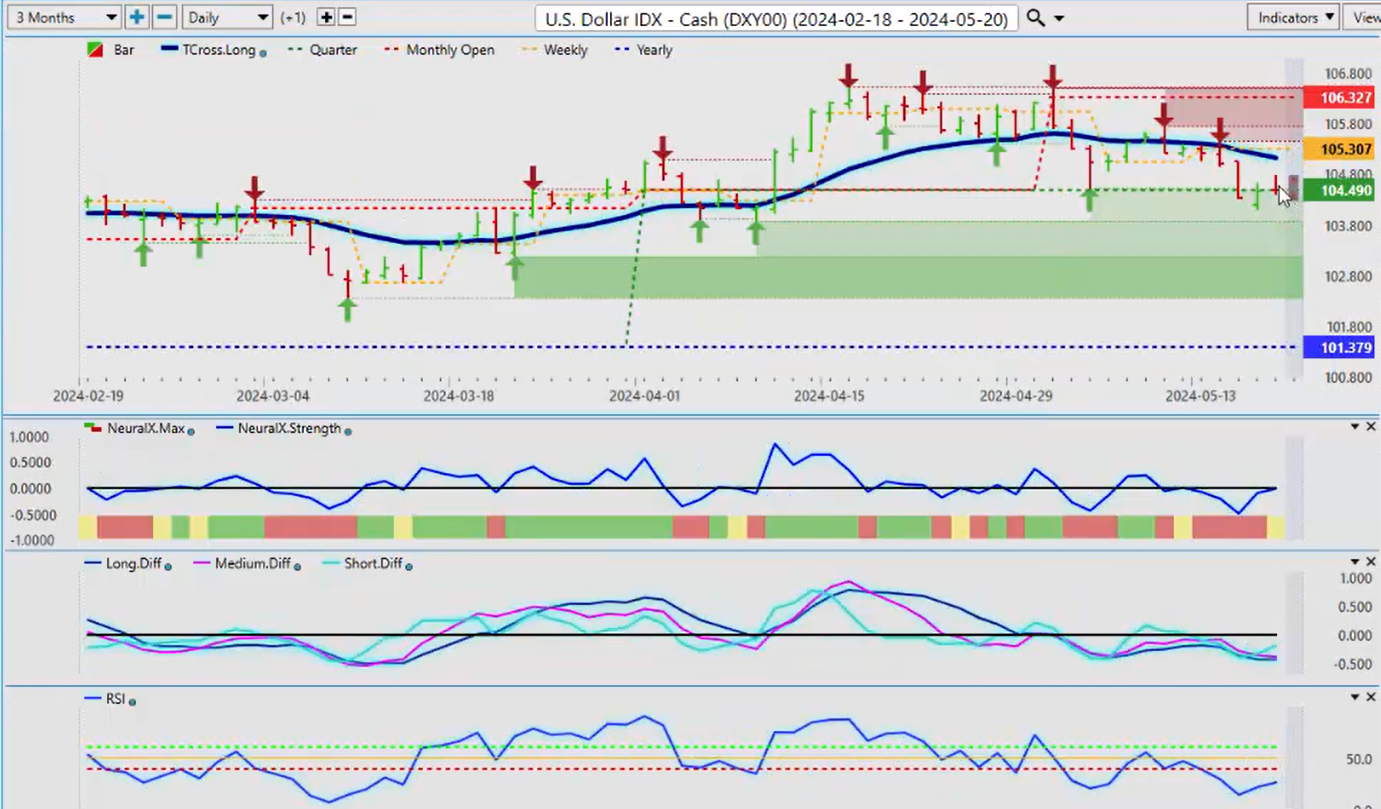
To get started this week, we’ll begin with the US Dollar Index, where we usually do. What I discussed last week was that the FED needs to hike and raise rates. That’s not what was stated. What was stated is there is no pathway to any further hikes in 2024. What we’re looking at is either higher for longer or rate cuts. My argument is that cuts are coming, and the data continues to support that.
So, again, fully cognizant of the fact that the FED has to hike and cut, but that’s not what we’re looking at here. We only have two options for 2024, in my respectful opinion, and that is the point that I’ve made. When we look at this right now, the dollar is again responding to that softer inflation data, specifically the CPI. Our T-cross long for next week is going to be 105.12, but once again, the quarterly opening price is the level we want to keep an eye on at 104.49. If we can hold below this level, then that would signal the dollar is heading lower.
The FED is speaking again next week, but it has been said this week that there will not be any hiking in 2024. So, when we take that into consideration, that should keep the dollar under pressure until the beginning of the month, where we get back into that normal dollar cycle of buying dollars for usually three, four, or five days. Our predicted difference is down, predicted RSI is pretty much flat, and we’re firmly below 105.12.
Gold
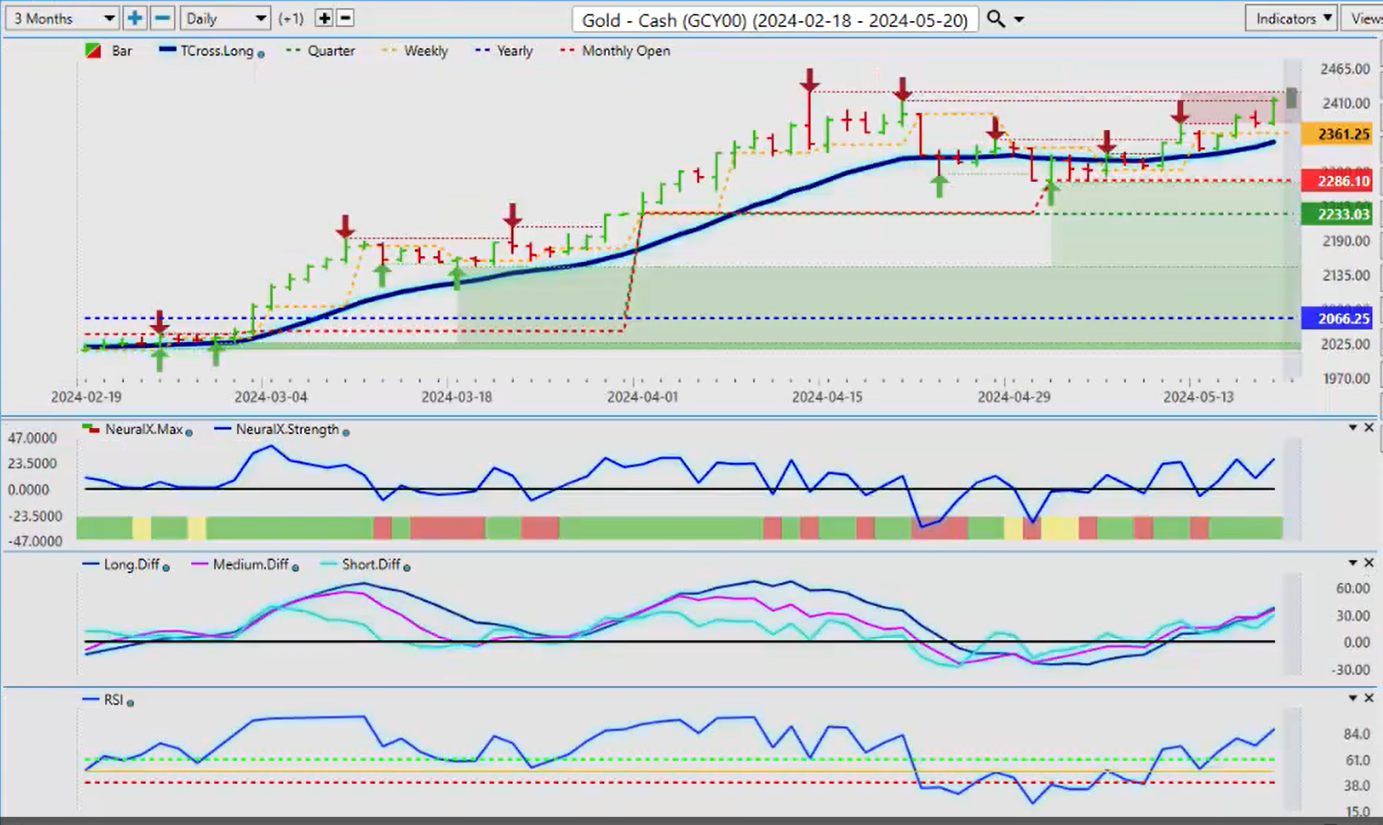
This is giving gold a boost. Once again, we’re approaching a very strong level up here, and these verified zones come in at or about the 2427 area. As I discussed in last week’s outlook, my upside target for the month of May is 2478. I’ll still be surprised if we get there, but we absolutely could. For now, that weaker dollar and softer inflation data should fuel additional gold longs. Our T-cross long will be coming in at 2347, which is our main support level, provided we’re holding above that. However, you can see that I’ve got the yearly opening price at 2066, the quarterly at 2235, and, of course, the monthly, a very important level which we’ve been discussing over the last several weeks. We were simply waiting for a break of the T-cross long. All these levels look pretty good, but I will give everyone the same warning I did last week: be careful up here because we could see some gold sellers, at least in the short term, come out as that seasonality starts to unwind.
Bitcoin
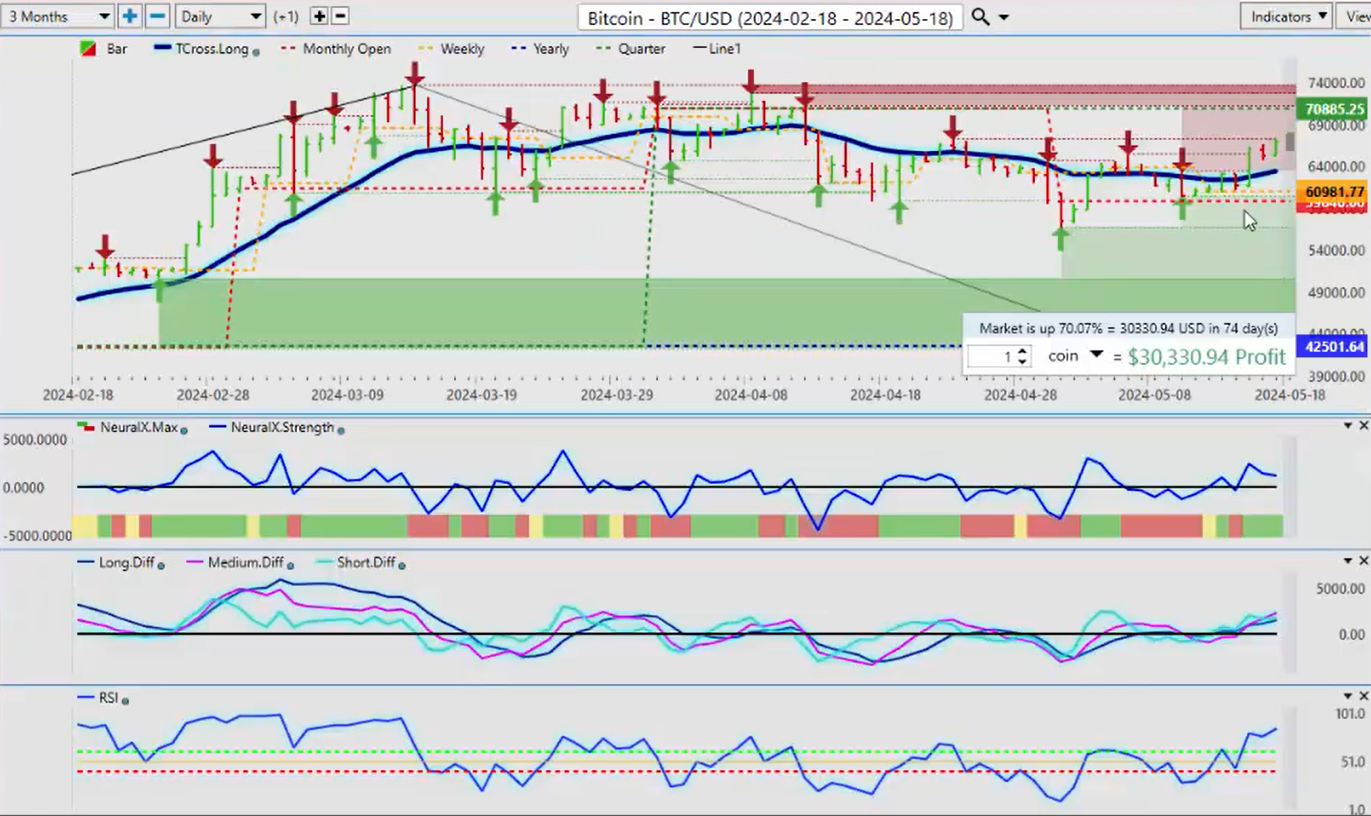
The asset class that is really benefiting from the dollar and the data of the US is, of course, Bitcoin, making another big move up here, closing the week at almost 67,000. Very likely, we’ll see a break of that current quarterly opening price, coming in at about 7,885. I anticipate we will see a break of that level, but maybe not next week. I do believe it’s coming. The key level you want to watch here is 63,404, and, of course, this very, very important monthly opening price just a little bit lower, coming in at 59,840.
S&P 500 Index
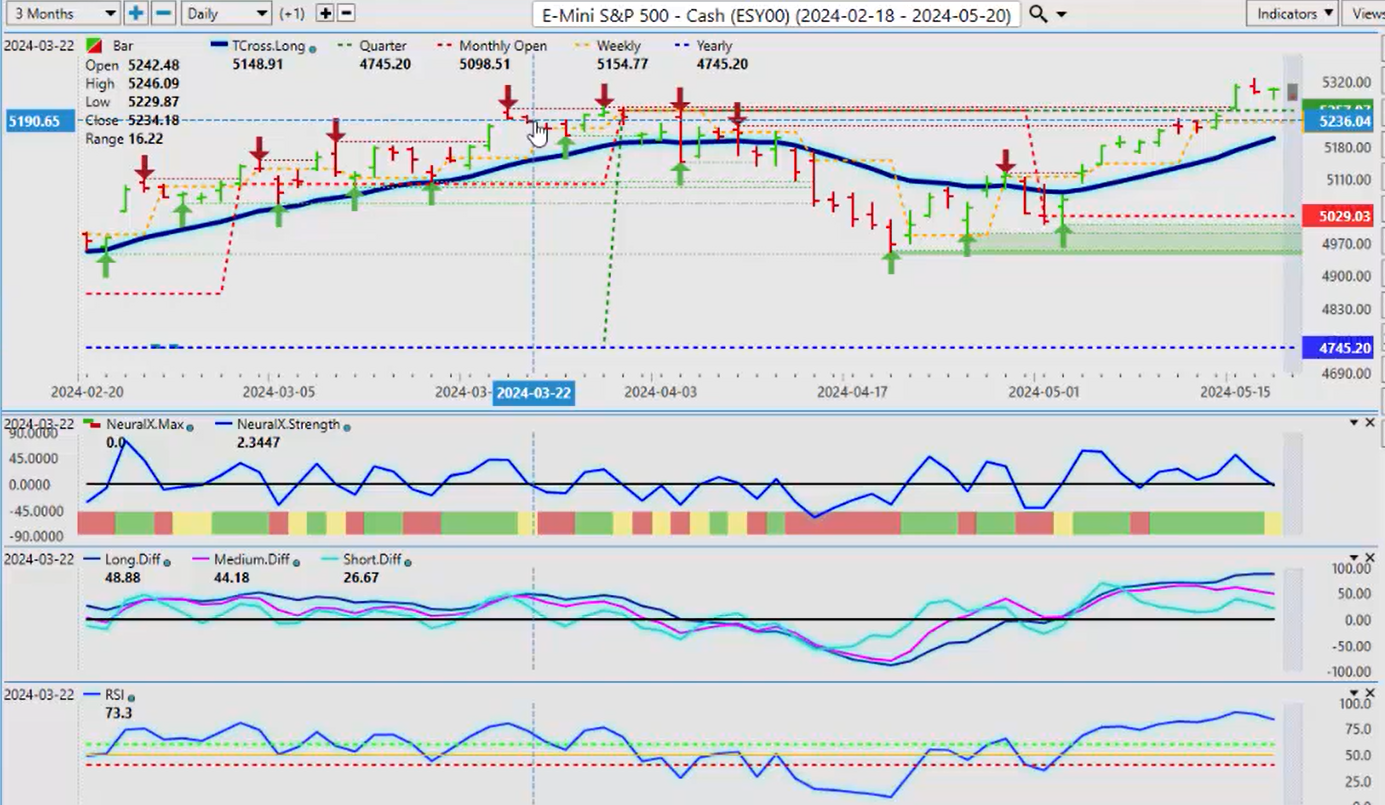
The equity markets are responding very well globally to the FED basically being backed into a corner on these issues. Even higher for longer is going to be difficult to argue going forward, but I’m sure they’ll try. Right now, we do have a breakout. My concern here is whether this is a true breakout or a bull trap. Just because the data is softer on the CPI and the economy is slowing in the US to some degree, a recession would not necessarily benefit stocks; it would benefit gold.
Right now, we are above some key levels, but our T-cross long is at 5198, which is our retracement point. The quarterly opening price is sitting at 52,797. Keep a very, very close eye on that area. My concern right now, looking at the predictive indicators in VantagePoint, is that the predicted medium-term predicted difference is starting to move lower, meaning that the uptrend is losing momentum. We should keep that in mind, and if we can’t hold above that breakout point, then a deeper correction could be in the cards.
We want to make sure that when we’re looking at all of these markets, we’re really taking a look at them globally. I like to bring up the DAX because it is also a significant player here. Right now, we’re starting to have some problems up here, which I’m surprised at, at 18,845. We’re holding firmly above the quarterly opening and the T-cross long. For next week, our T-cross long is 18,432—that’s the big level. In the DAX, in the European equities, this is clearly showing some weakness. We would say, okay, is it possible this could affect the US also? In my view, yes, it could. We’ll watch this carefully. If the DAX continues to slide, then we should expect some kind of corrective move, if nothing else, on the S&P 500.
Volatility Index ($VIX)
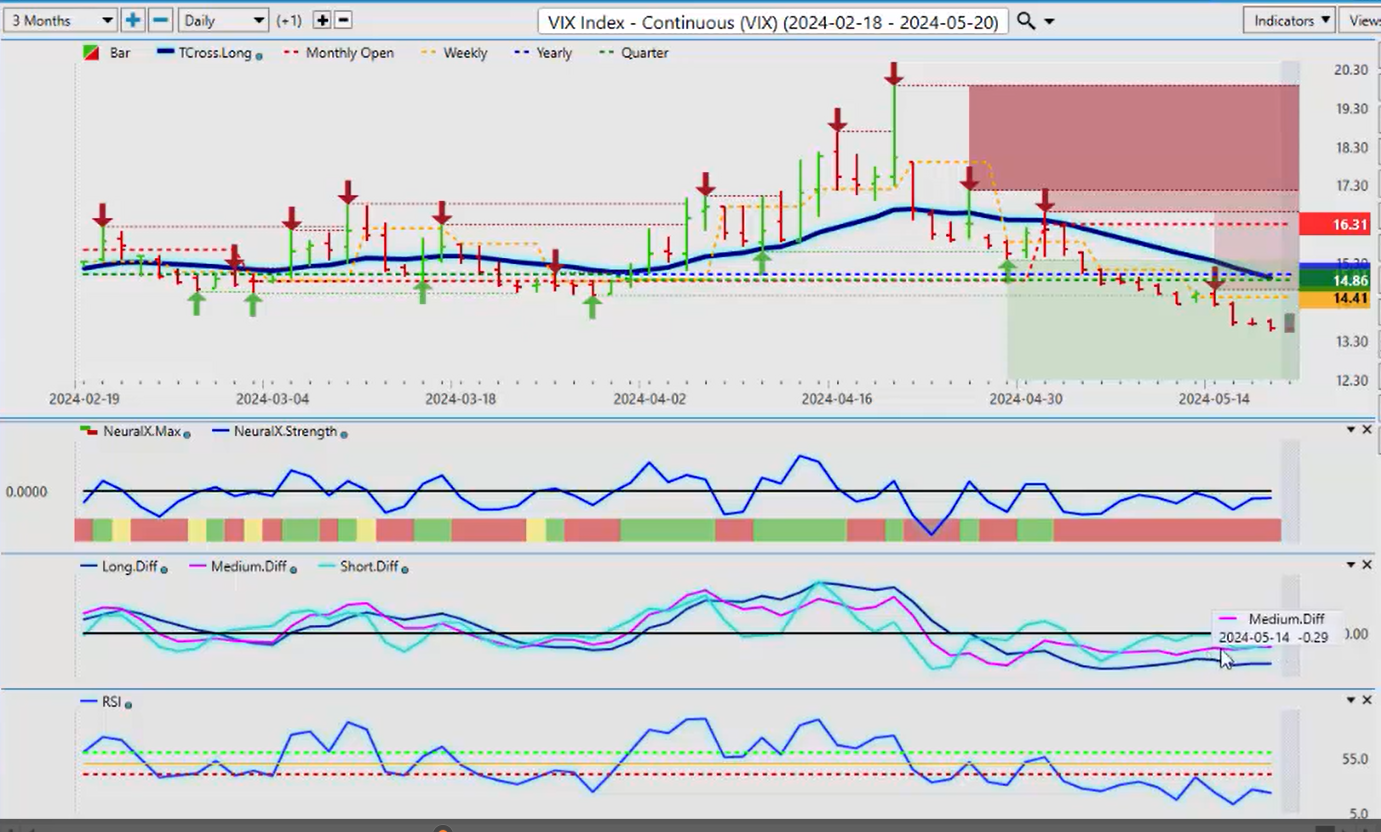
The VIX is starting to bottom out here. We’re running sideways on the predictive indicators from VantagePoint. The neural index is still down. I’m looking for some form of a bottom here, but we don’t have it quite yet. Watch the VIX very, very carefully next week. We can click on our F8, and 1415 is the first major resistance level. Look to see if we break that. If it does, then more likely than not, the equities are going to struggle a bit here, which would favor Bitcoin potentially and more so gold. We’ll watch that very carefully. The indicators are losing downward momentum on the VIX, which could mean we could be looking at a global corrective move on some of the equity markets.
Light Sweet Crude Oil
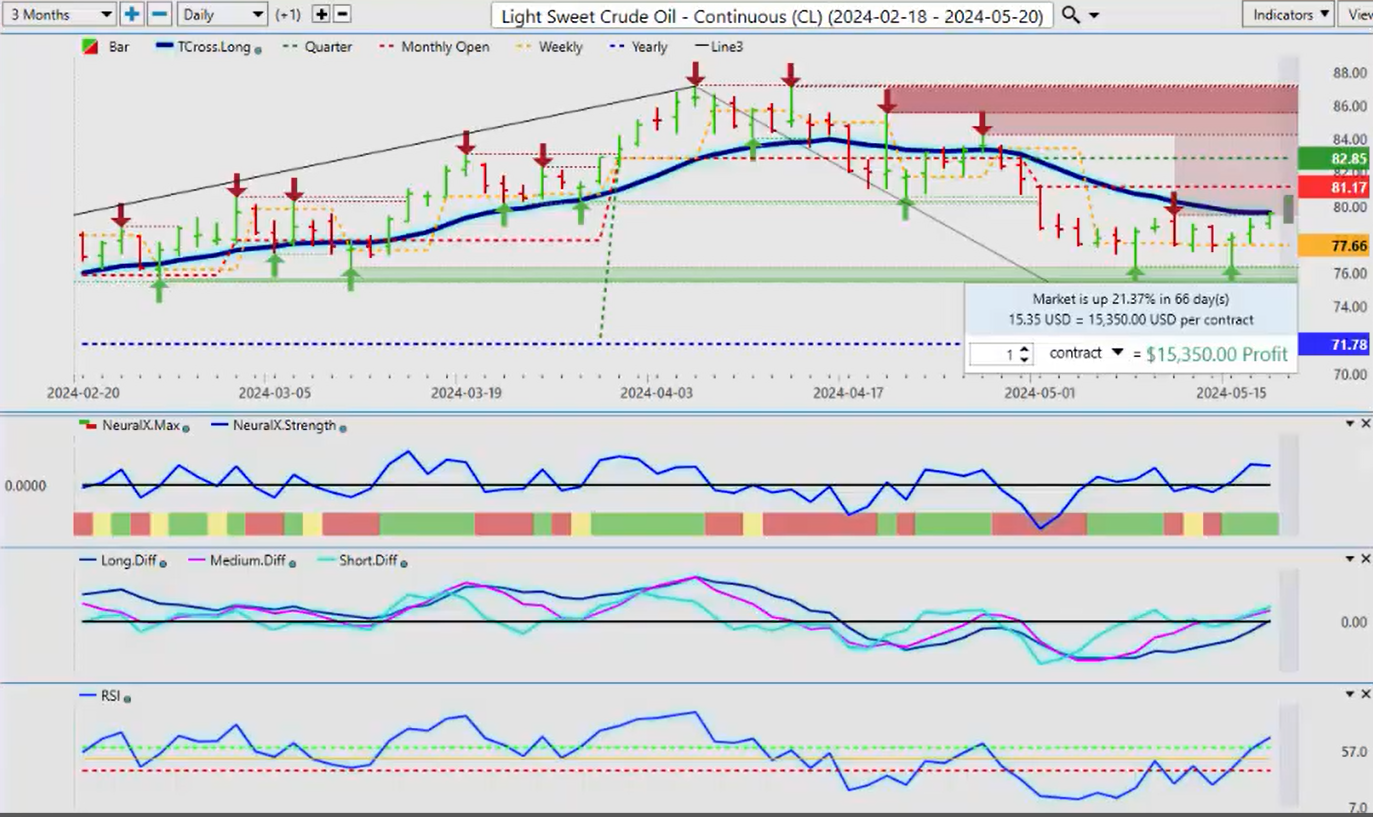
When we come into some of our other main commodities, which of course is light sweet crude oil, in my respectful opinion, it does look like we are starting to form a pretty strong bottom here, and that low is coming in at 76.36. That is my monthly projected low for May. We’re starting to rise. If you like the idea of a long on light sweet crude, I would respectfully submit that you should keep an eye on your oil ETFs, oil stocks, and some of these things because this is pointing towards momentum building here. We’ve got our predicted differences starting to break above the zero line. We’ve got momentum by a break of the 60 level on the predicted RSI. The neural index strength is a little bit concerning because it is flattening out, but I suspect it will straighten itself and start pointing back to the upside once we clear the T-cross long, which is coming in at 79.63. This is the big area. If we break above that, we’re going to be targeting 81.17 and 82.85. and then ultimately, I suspect we will be targeting back towards this 87 level, but maybe not until next month.
Euro versus U.S. Dollar
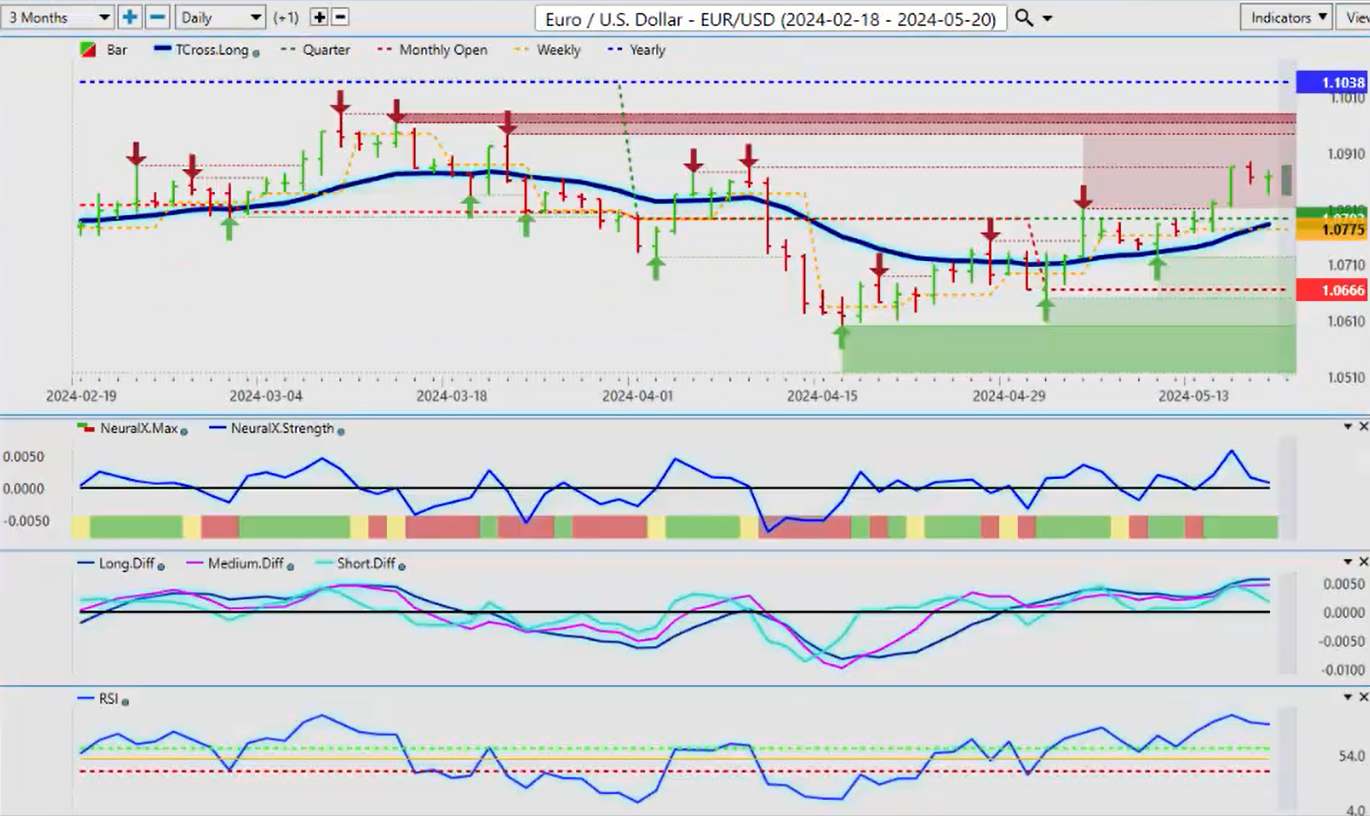
Now, as we look at some of our main Forex pairs, providing the dollar continues to slide, the Euro should extend higher. However, I do want to bring it to everyone’s attention that the Euro has never been in an uptrend for the calendar year, and it’s not necessarily in one now. We are still negative on the calendar year at 1.1038. The indicators on VantagePoint are starting to get a little bit toppy here, so again, be cautious up here in my respectful opinion. We have a verified resistance high coming in at 1.0885, and you can see that’s exactly where we have failed all week. A corrective move is likely, with 1.0782 being a more comfortable buying region. We’re about 100 pips away from the T-cross long, and that’s where I would be more comfortable executing new longs.
U.S. Dollar versus Swiss Franc
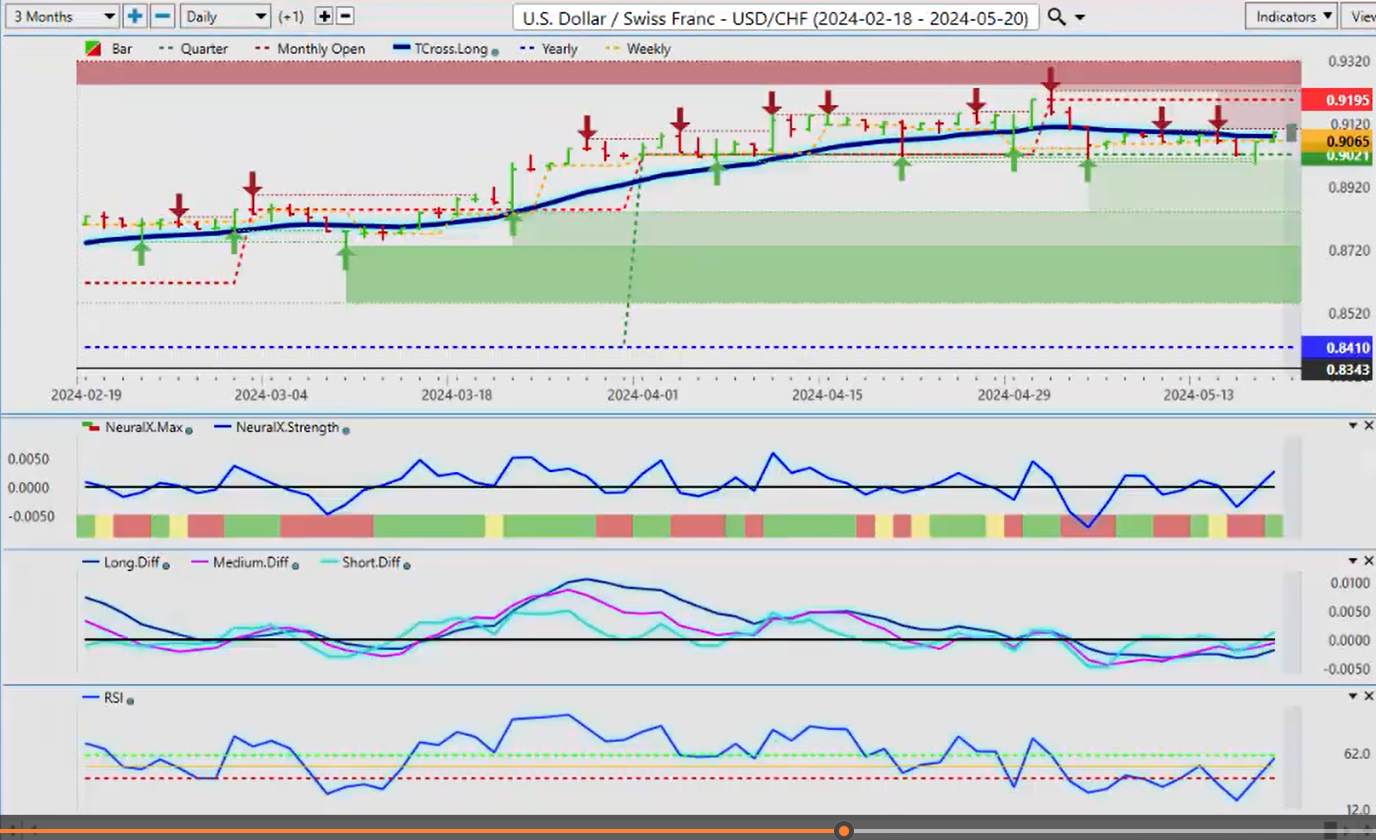
With the US – Swiss Franc, it’s holding in there, but once again, if the dollar turns to the downside, this pair will move lower. We are holding below our monthly opening price, but the indicators are still showing the neural index strength and the predicted RSI. They rarely have the exact same signal, but they do, warning of some pending dollar strength. It may not be a big run of dollar strength, likely just corrective, but we’ll watch that quarterly opening price on the dollar index to make sure we get below that. If we don’t, then we could retrace higher up to the 0.9195 area, where we would be sellers anyway.
British Pound versus U.S. Dollar
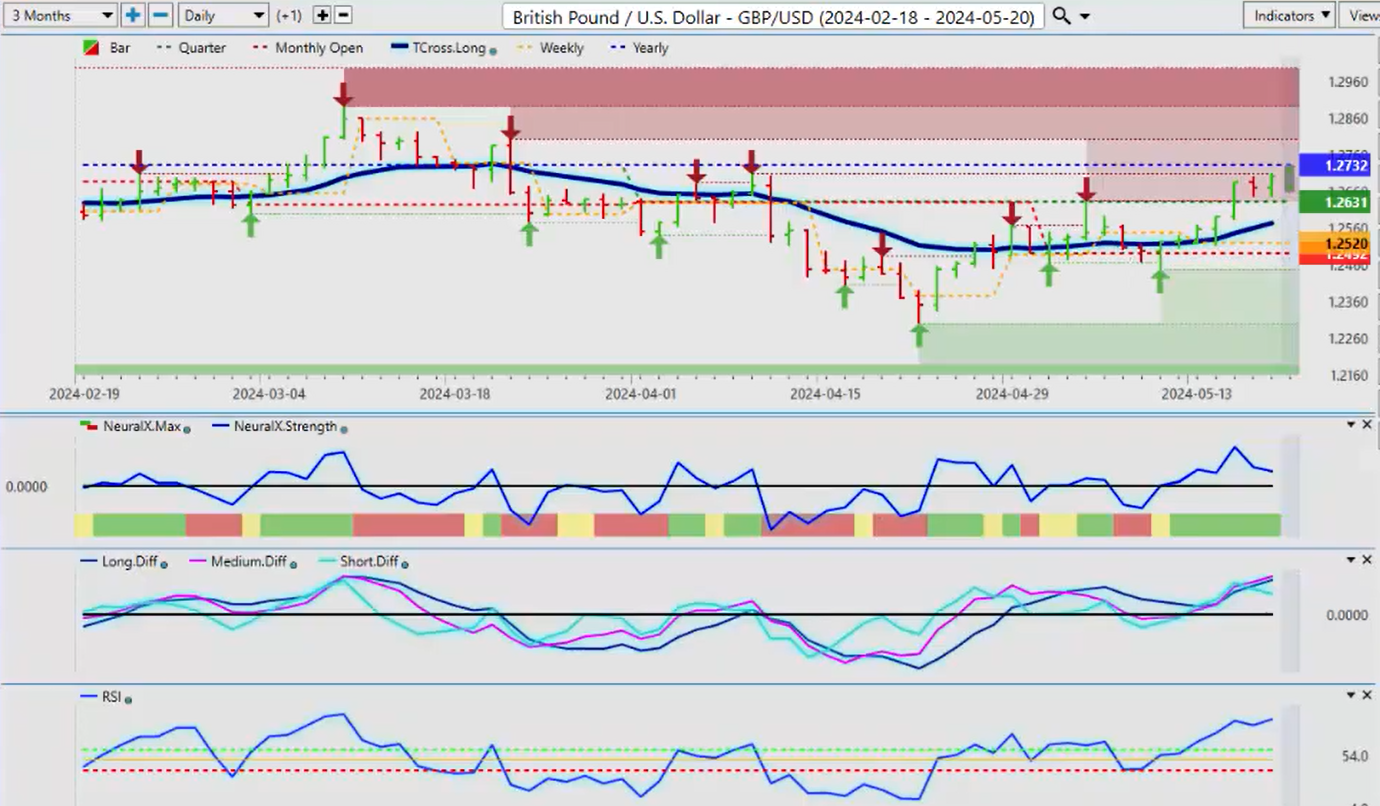
Now, when we look at the British Pound US Dollar, it has had a very good week. Once again, I will draw it to all Forex traders’ attention that the yearly opening price is 1.2732. Once we overtake that and close above it two days in a row, we should have a very clean run much higher on this pair, but we have to get above that hurdle of 1.2732. The indicators are suggesting we could be correcting first, so we’ll use our T-cross long at 1.2573 and all the way down to about the 1.2492 area. I would still be looking at longs on this pair.
U.S. Dollar versus Japanese Yen
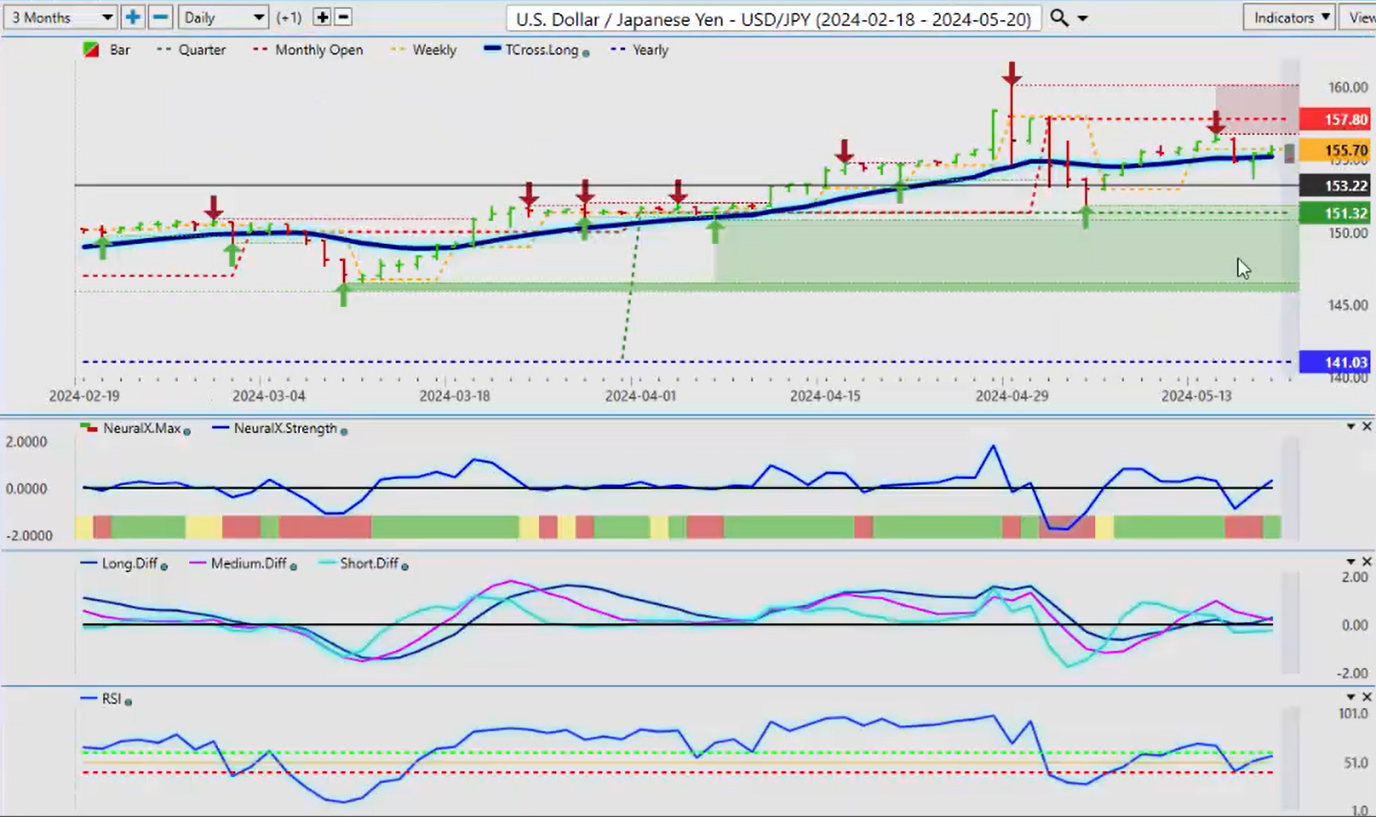
The Dollar Yen is just moving sideways in a channel. The low end of that channel is at 153.06, and the immediate top side is about 179.99. I’m looking for a break of either one of these levels, but I suspect it will be to the downside because of the potential of the interest rate differential changing between the FED and the Bank of Japan. I don’t think it’s going to change overnight, but I do think it’s going to change going forward, so I believe the next bigger move on this pair will be to the downside.
U.S. Dollar versus Canadian Dollar
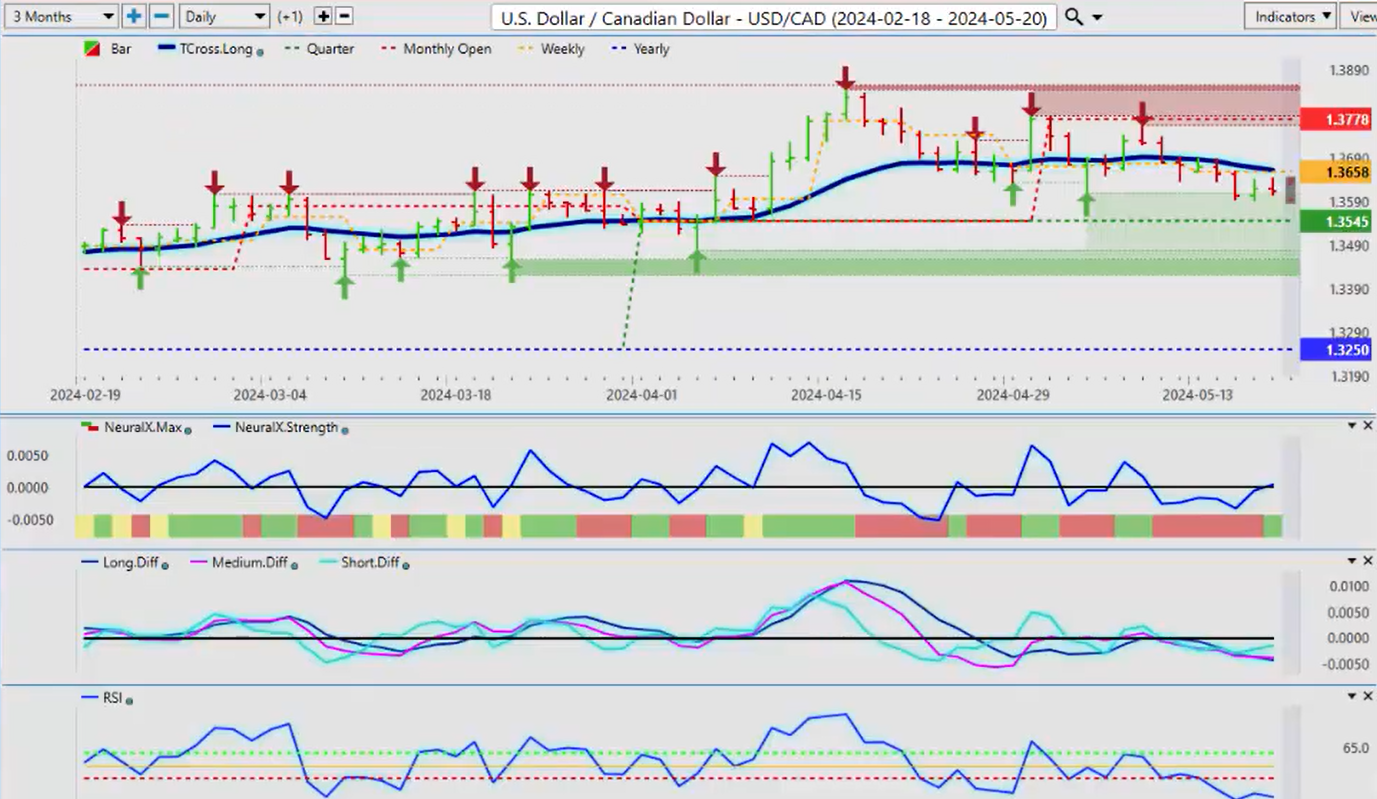
When we look at US Canada, just a reminder that it’s a holiday in Canada on Monday, so don’t take the price on this pair seriously on Monday or on light sweet crude oil, because those markets are going to be a little thin. Right now, I do believe that oil is ultimately moving higher in the months ahead, which should push the US Canadian pair lower. The biggest fundamental risk we have is the Bank of Canada. I’m also pretty confident they’re going to cut based on the Canadian economy. If that happens, it will initially hurt the Canadian dollar, but I believe this has already been priced in, and the next move is going to be down. We just need a little bit of a corrective move, and we could hit back into the 1.3778 area. It’s possible here, but I think it’s unlikely because we have to clear the T-cross long and close above that level to even think about going long on this pair again.
Now, for next week, much like what I showed you last week on a monthly basis, it’s not always about looking at one timeframe.
Australian Dollar versus U.S. Dollar
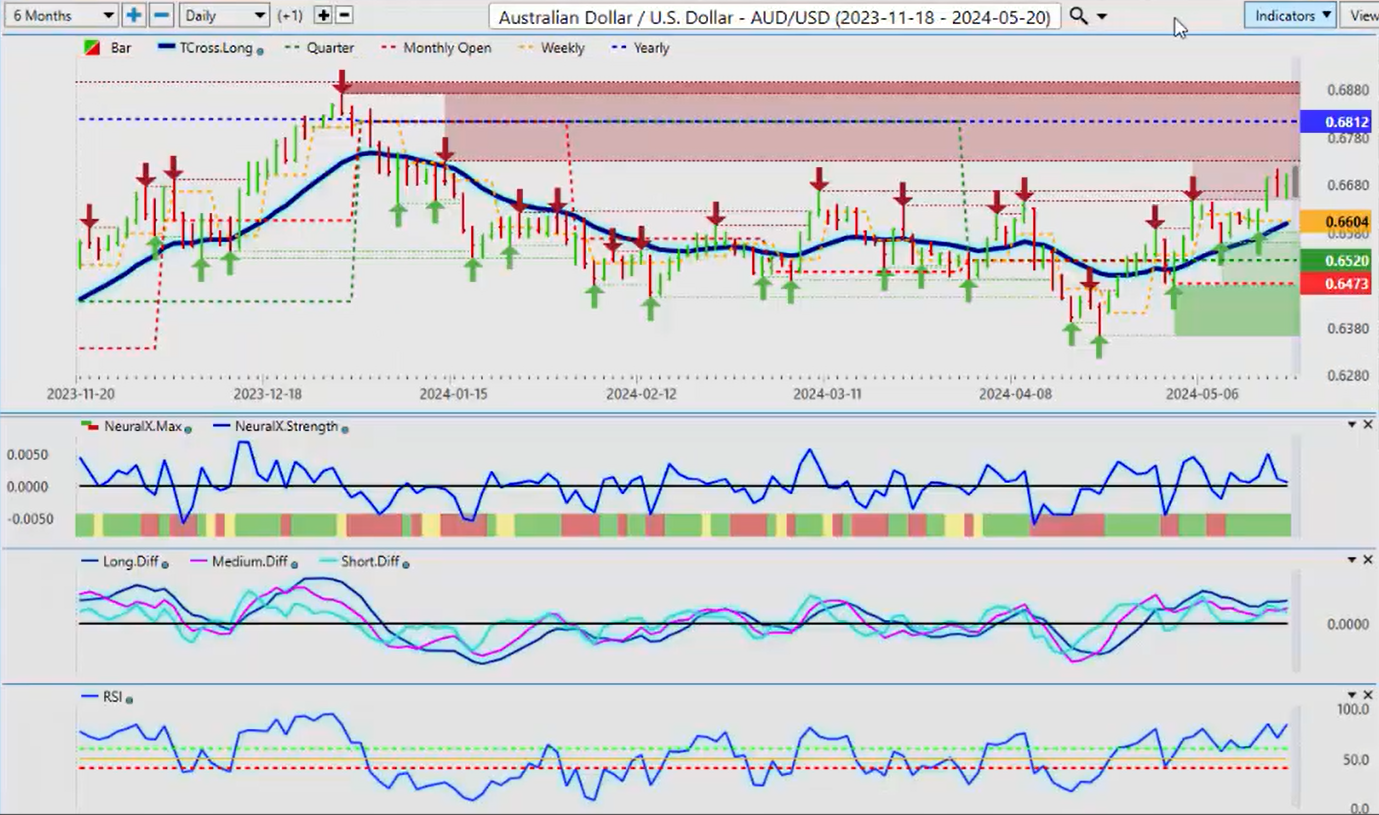
If we look at the Aussie US over the last three months, which I talked about last week, we’ve got very significant resistance that finally appears to have broken, and the top end of that is sitting at about the 0.6667 area. This could be a false break, but I don’t think so. I think the dollar is getting ready to ultimately move lower. The Aussie at 0.6812, the yearly opening price, needs to be surpassed in the next month or so, preferably in the next couple of weeks. If we can get above that, we should start to see broader dollar weakness.
New Zealand Dollar versus U.S. Dollar
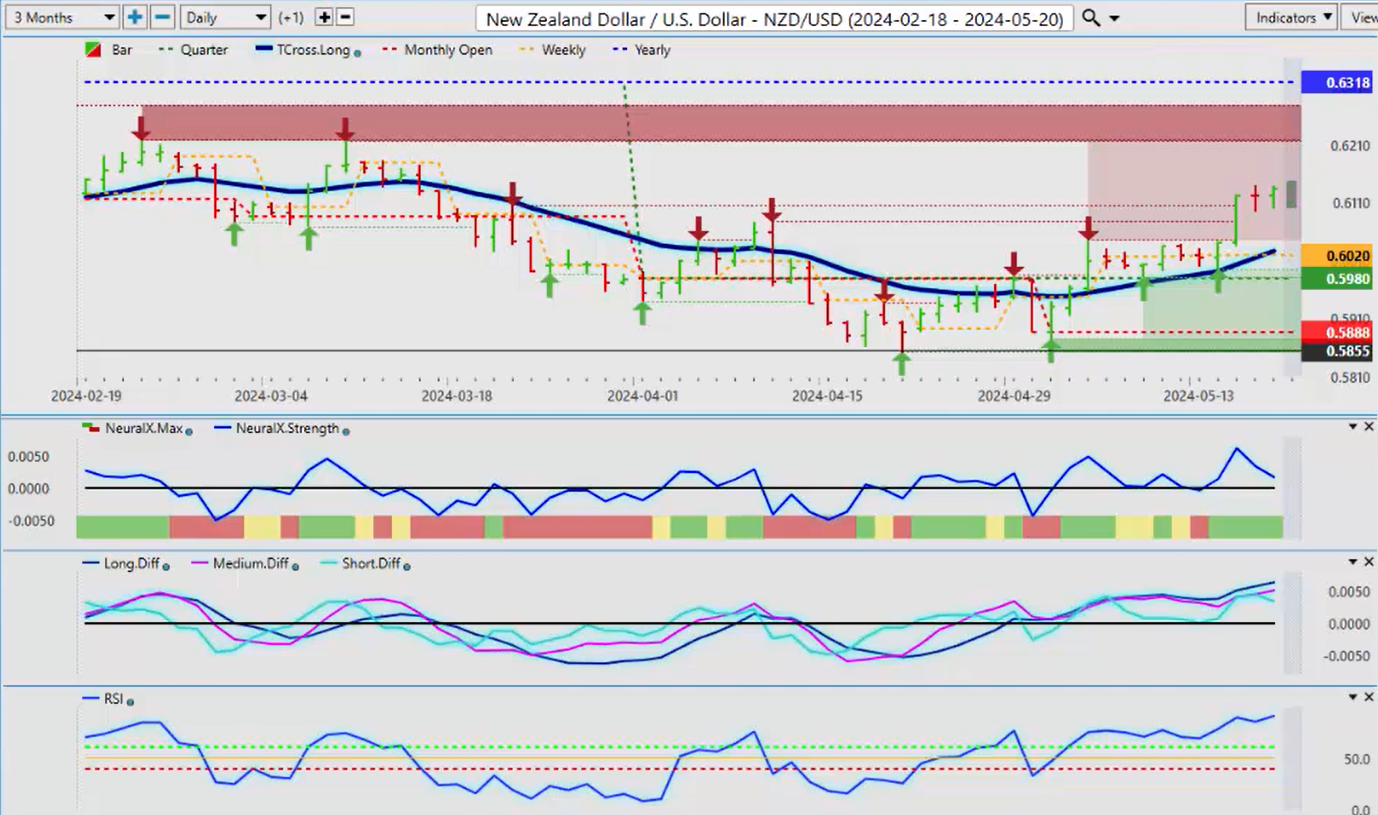
You’re not going to see much difference with New Zealand US, as both pairs are holding above their T-cross long. I think a corrective move on both first, and then ultimately both these pairs go higher.
With that said, this is the VantagePoint AI Market Outlook for the week of May 20th, 2024.

