-
View Larger Image

General Motors (GM)
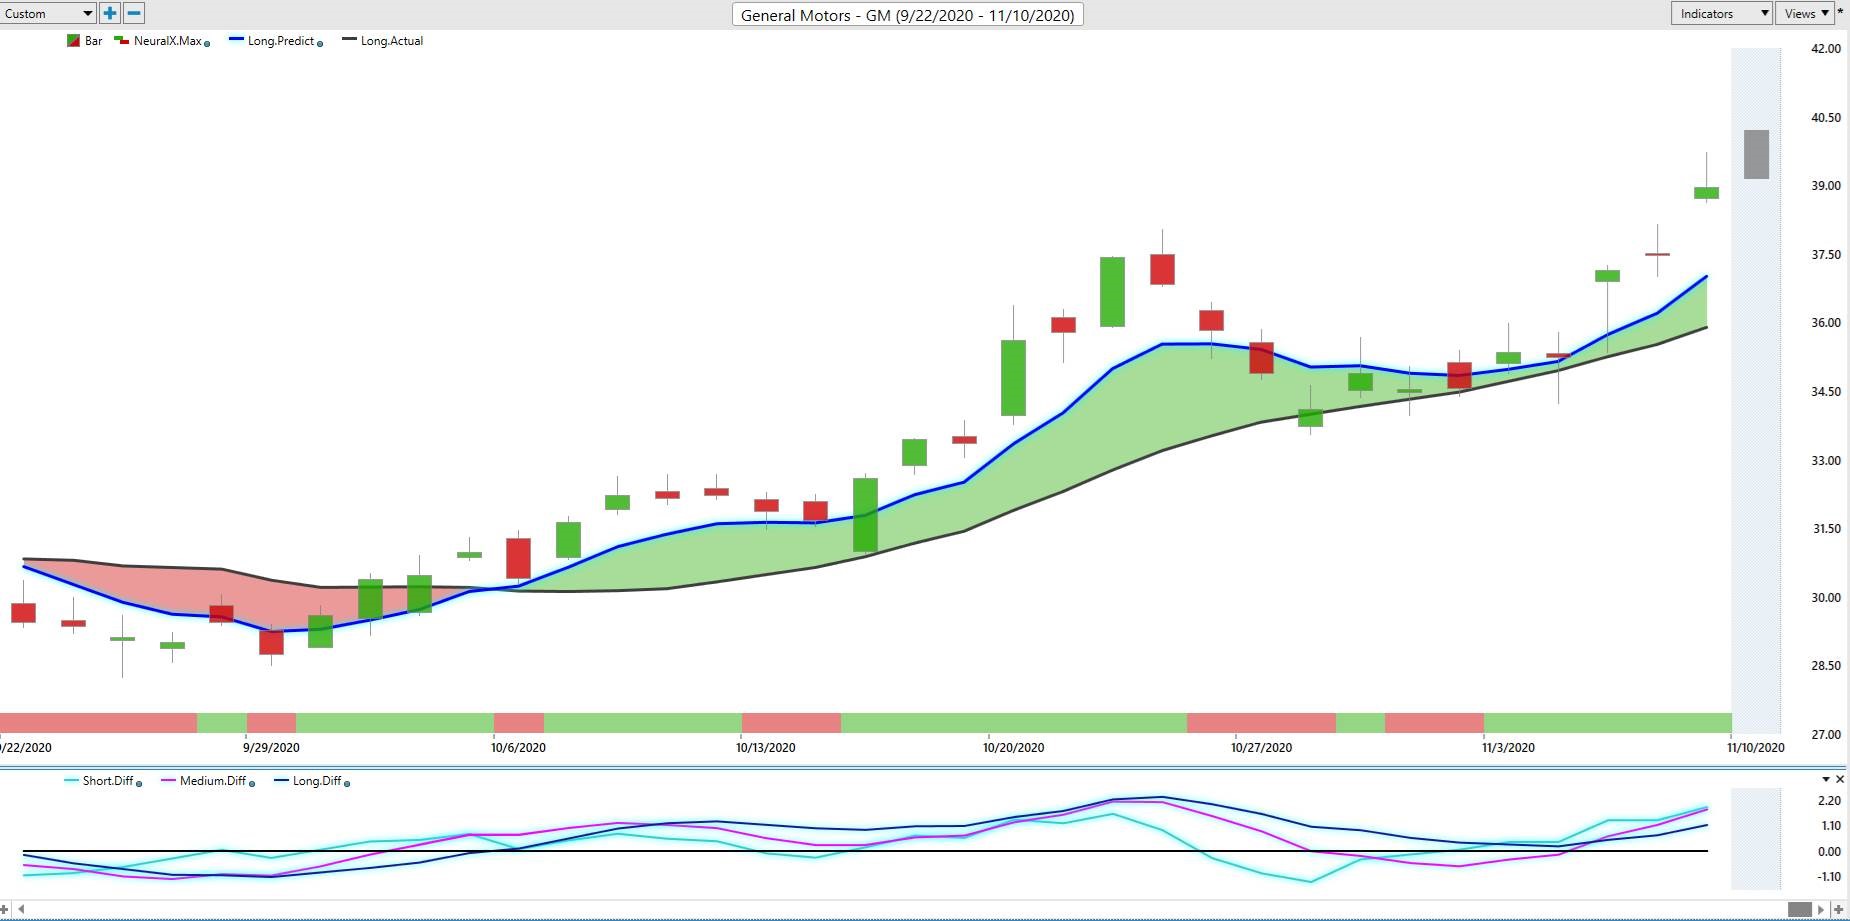
This week’s stock analysis is General Motors (GM) which showcases a huge opportunity this month for potential gains. From the cross-over on October 6th to the current chart data below for November 10th, GM has showcased an upward trend of around 24% in 24 trading days.
Let’s dive into how artificial intelligence could have helped you locate this opportunity.
VantagePoint Software Prediction
When using the VantagePoint software in your trading, it is important to take into consideration every predictive indicator available.
VantagePoint began to showcase signs of GM gaining momentum back on September 30th when the Neural Index (The Green/Red Bar below the candles) turned green.
When that momentum shifted in the Neural Index, the three-day predictive indicators also began to shift upward, which added an additional layer of confirmation that this trend may reverse in the coming days and turn bullish.
As momentum is rising, the Artificial Intelligence begins to approach a cross-over. For a cross-over, you’re looking for the blue predictive line on the chart to cross-over the black line – this is A.I. telling you that the trend is reversing.
Even with momentum weakening between October 30th and November 4th, the A.I. still indicated the trend will continue to remain on an upward trend and it has.
With the VantagePoint software helping you to monitor this stock, you would have been able to ride this opportunity up around 24% in 24 trading days.
About General Motors (GM)
General Motors Company is known for building and selling automobiles worldwide. Founded in 1908, the company operates through GM North America, GM International, Cruise, and GM Financial. It also offers security services alongside their vehicles such as crash assist, stolen vehicle assistance, and navigation. GM falls under the Consumer Cyclical Sector in the VantagePoint Market tree for U.S Stocks.

