-
View Larger Image
Amarin Weekly Stock Study (AMRN)
Amarin Corporation is a biopharmaceutical company founded in 1993 and headquartered in Dublin, Ireland and Bridgewater Township, New Jersey. The company develops and markets medicines for the treatment of cardiovascular disease. It has developed the drug VASCEPA®, a prescription grade omega-3 fatty acid.
Amarin´s sole product VASCEPA® came on the market in 2013 for triglyceride levels >=500 milligrams per deciliter. In December 2019, the FDA approved the use of Vascepa (icosapent ethyl) as an adjunctive (secondary) therapy to reduce the risk of cardiovascular events among adults with elevated triglyceride levels (a type of fat in the blood) of 150 milligrams per deciliter or higher. Patients must also have either established cardiovascular disease or diabetes and two or more additional risk factors for cardiovascular disease. VASCEPA® is the first FDA approved drug to reduce cardiovascular risk among patients with elevated triglyceride levels as an add-on to maximally tolerated statin therapy.
Amarin (AMRN) is widely followed and traded on Wall Street.
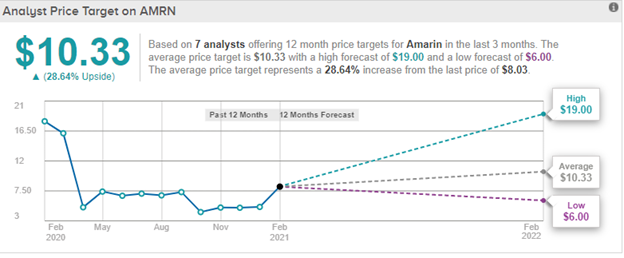
Based on 7 analysts offering 12 month price targets for Amarin in the last 3 months. The average price target is $10.33 with a high forecast of $19.00 and a low forecast of $6.00 . The average price target represents a 28.64% increase from the last price of $8.03 .
Let’s start our analysis with the commonsense metrics.
Over the last 52 weeks it has traded as high as $18.35 and as low as $3.36. This tells us that the annual trading range is $14.99. The average weekly trading range is .28 cents.
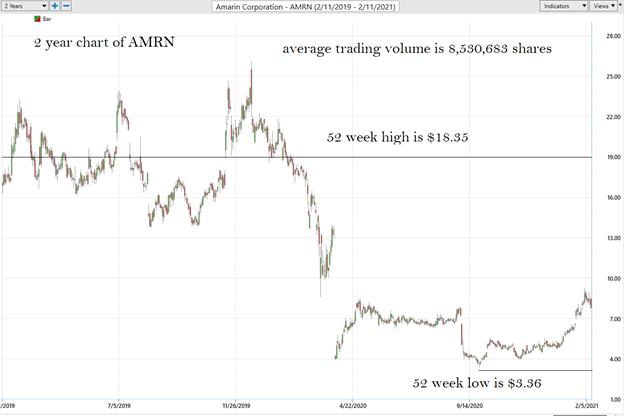
These numbers are what we refer to baseline metrics which help us define and understand what is “normal” price action. Naturally, we look to amplify these results using artificial intelligence and machine learning.
The Vantagepoint Analysis
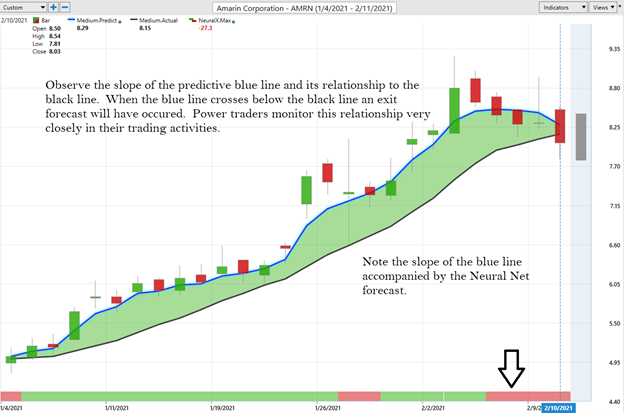
In studying the chart above pay close attention to the relationship between the black line and predictive blue line. The black line is just a simple 10 day moving average. It Is calculated by taking the closing prices of the last 10 days and dividing that sum by 10. All that the black line tells you is what has occurred. It tells you where prices have been.
The predictive blue line, on the other hand utilizes VantagePoint’s patented Neural Network and Intermarket Analysis to arrive at its value. It looks at the strongest price drivers of an asset through artificial intelligence and statistical correlations to determine its value.
Whenever we see the predictive blue line move above the black line we are presented with an entry opportunity. This is what occurred on November 23 rd , 2020.
Power traders use the predictive blue line in helping to determine both the value zone as well as the trend direction.
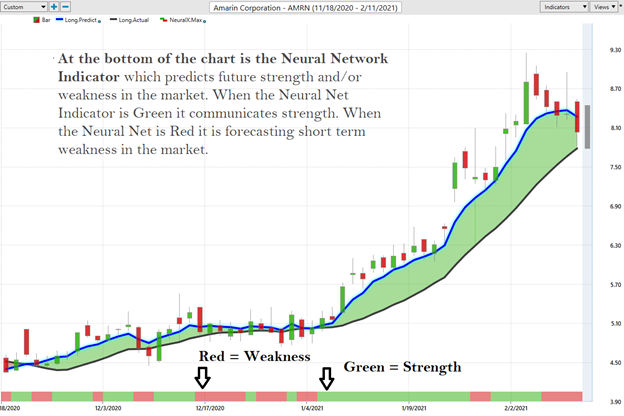
We advocate that Power Traders cross reference the chart with the predictive blue line and neural network indicator to create optimal entry and exit points. These forecasts are updated every single day.
Power Traders are always looking to apply both the neural network and a.i. to the markets to find statistically sound trading opportunities. In rising markets the ideal entry opportunities present themselves by trying to buy the asset at or below the predictive blue line.
Power Traders were alerted to an entry opportunity at $4.46 a share on November 23 rd . On February 10, 2021, AMRN close at $8.03. If you look at the most recent VantagePoint forecast you can anticipate that the blue line will cross under the black line indicating an exit from this trade.
Over the past ten weeks AMRN price increased almost 100%. Traders who monitored the A.I. forecast were well positioned to harvest these kinds of profits.
The VantagePoint Daily Price Range Forecast
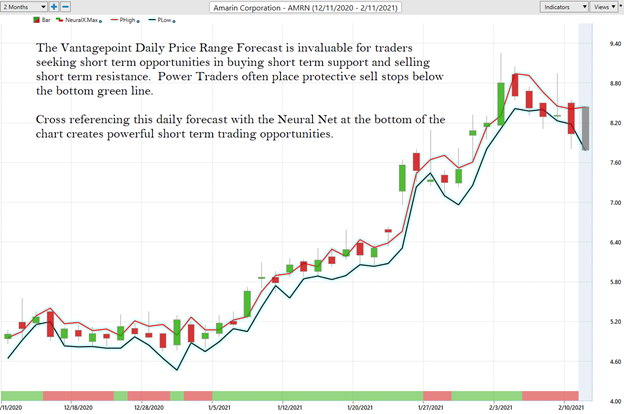
A picture is worth a thousand words. Look over the daily price range forecast that Power Traders study daily for the assets that they are trading.
At the bottom of the chart is the Neural Network Indicator which predicts future strength and/or weakness in the market. When the Neural Net Indicator is green it communicates strength. When the Neural Net is Red it is forecasting short term weakness in the market.
Intermarket Analysis
We live in a global marketplace. Everything is interconnected. The billion dollar question for traders is always what are the key drivers of price for the underlying asset that I am trading?
Small changes in Interest rates, Crude Oil Prices, and the Volatility of the dollar amongst thousands of other variables affect the decisions companies must make to survive in these very challenging times. Trying to determine what these factors are is one of the huge problems facing investors and traders.
Instead of guessing what is driving AMRN’s price why not focus on the factors, companies, commodities, mutual funds, and ETFs that are statistically proven?
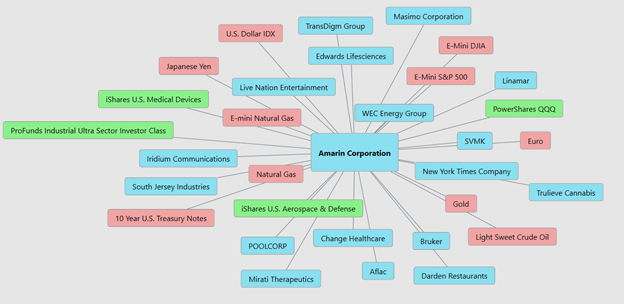
The following graphic represents the key drivers of AMRN’s price.
Blue are the STOCKS that are the key drivers.
Green are the ETF’s that are the key drivers.
Red are the Futures that are the key drivers.

Using the Intermarket Analysis will often allow you to see patterns and opportunities from a completely new angle.
The Fundamental Perspective
Shares of Amarin were down quite heavily over the past year, underperforming both the Virtus LifeSci Biotech Products ETF and SPDR S&P Biotech ETF .
From a purely fundamental perspective the stock fell sharply with the rest of the market in in late March after the company lost a patent trial it had brought against two generic drug manufacturers, Hikma Pharmaceuticals and Dr. Reddy’s Laboratories , which were selling an equivalent version of Vascepa at significantly lower prices.
The company appears to think it can increase sales in North America. It has increased its sales force to 800 representatives and managers.
The expansion of a larger sales force provides a unique opportunity for Amarin to educate healthcare professionals about the benefits of Vascepa in cardiovascular risk reduction. Prescriptions for Vascepa are rising year over year. However, management is very concerned about the COVID-19 pandemic as many health sources are reporting that an over 70% decline in patient interactions with doctors has occurred.
Investors are excited to learn that growth lies ahead in international markets. Canada —
China may also offer an exciting commercial opportunity once Amarin’s partner there, Eddingpharm, nears completion of a clinical trial later this year.
Success in China, where AMRN management believes almost 18% of the adult population, has high levels of triglyceride (hypertriglyceridemia) — will position Vascepa as a first-in-class drug.
Considering the impact of the COVID-19 pandemic as well as economic lockdowns in multiple countries, Vascepa’s potential expansion into new markets, and ongoing legal issues, Amarin has VOLATILITY written all over it.
We advise Power Traders to monitor the daily A.I. forecast for Amarin for future opportunities both up and down as we think AMRN represents a wonderful vehicle for short term trading.
Let’s Be Careful Out There!
Remember, It’s Not Magic.
It’s Machine Learning.

