This week’s stock analysis is ZAI LAB. ($ZLAB)
Zai Lab ($ZLAB) is a research-based, commercial stage biopharmaceutical company based in China and the U.S. focused on bringing transformative medicines for oncology, autoimmune disorders, infectious diseases, and neurological disorders to patients in China and around the world. Zai Lab develops and commercializes therapies to treat oncology, autoimmune disorders, infectious diseases primarily in China and Hong Kong.
Over the past several weeks it has grabbed a lot of attention as it has posed a strong countertrend rally which was directly inverse to what has been happening across the rest of the broader stock market indexes.
On the positive side, $ZLAB revenue is expected to increase 45.7% per year. However, the company is unprofitable, and the company is not expected to become profitable for at least 3 years.
As we will see, the share price has been extremely volatile over the last three months and shareholders have been diluted. Shareholder dilution occurs when additional shares are issued, resulting in a decrease in the ownership percentage of existing shareholders. While this may not seem important, it can have a significant impact on control of the company. For example, if executives receive bonuses in the form of stock options, they will own more shares and have a greater say in decisions made about the company. Additionally, dilution can make it difficult for outside interests to buy a controlling stake in the company. As a result, shareholder dilution can have significant implications for the future of a company. Many companies purposely dilute their shares to make it almost impossible for an outsider to gain a controlling interest. Shareholder dilution is an important aspect of corporate finance that should be carefully considered by both businesses and investors.
One of the major problems to evaluate when shareholder dilution occurs is the effect it has on other basic investor metrics such as earnings per share. While additional shares may be issued for a variety of reasons, such as raising capital or employee incentives, the net effect is always the same: each shareholder’s ownership stake is diluted.
One of the keyways that shareholder dilution affects investors is through earnings per share (EPS). EPS is calculated by dividing a company’s net income by the number of outstanding shares. When additional shares are issued, the denominator increases, which has the effect of reducing EPS. This can be a major concern for investors, as EPS is often used to compare companies on a quarterly basis. As such, any reduction in EPS can make a company appear less profitable than its peers, even if its underlying business performance has remained unchanged.
In sum, shareholder dilution can have a significant impact on a company’s earnings per share, which can in turn affect its share price and overall profitability. As such, it is always important to keep an eye on a company’s share count when evaluating its financial performance.
Bottom Line: $ZLAB is unprofitable, and losses have increased over the past 5 years at a rate of 49.4% per year.
In this weekly stock study, we will look at and analyze the following indicators and metrics which are our guidelines which dictate our behavior regarding a particular stock.
- Wall Street Analysts’ Estimates
- 52-week high and low boundaries
- Vantagepoint A.I. forecast
- The Best Case – Worst Case Scenarios
- Neural Network Forecast
- Daily Range Forecast
- Intermarket Analysis
- Our trading suggestion
We don’t base our trading decisions on things like earnings or fundamental cash flow valuations. However, we do look at them to better understand the financial landscape that a company is operating under.
Wall Street Analysts’ Estimates
Based on 1 Best Performing Wall Street analysts offering 12-month price targets for Zai Lab in the last 3 months. The average price target is $193.00 . The average price target represents a 387.00% change from the last price of $39.63 .
The first factor we want to point out is the unfortunate reality that only 1 Analyst is covering the stock. This should make any trader suspicious and want to dig deeper.
Why is only 1 analyst covering this stock?
Analysts are Wall Street professionals who track companies and provide recommendations to their clients regarding whether to buy, hold, or sell the stock. When a company is only tracked by a small group of analysts, it may be due to the company’s size or the sector it operates in. For example, small-cap companies are typically followed by fewer analysts than large-cap companies. Additionally, certain sectors such as healthcare and technology are followed by more analysts than others. One way to measure analyst coverage is by looking at the number of analysts who cover a stock. Another way to measure analyst coverage is by looking at the number of earnings
conference calls that are conducted by the company. Companies that are followed by more analysts tend to have more conference calls.
Analyst coverage can also be measured by looking at the accuracy of analyst recommendations. If a company is only followed by a small group of analysts, it may be more difficult for those analysts to generate accurate recommendations.
Ultimately, whether or not a company is followed by a small group of analysts does not necessarily mean anything positive or negative about the company. It is simply one metric that can be used to measure analyst coverage.
When a company is only tracked by a small group of analysts, it means that not many people are paying attention to it. This can be because the company is small, or because it’s in a niche market. As a result, there may be fewer people following the company’s conference calls, looking at its balance sheets, and talking to its customers. That said, a small group of analysts can still provide accurate information about a company. In fact, they may even have more insight than a larger group, since they’re more likely to be experts on the company and its industry. Ultimately, whether or not a company is followed by many analysts shouldn’t be the only factor you consider when making investment decisions. However, it’s something to be aware of, and it may give you some extra insight into the company.
While this estimate is optimistic, we will look at them within the context of the artificial intelligence forecast. $ZLAB has attracted a lot of attention, but we cannot place a great deal of emphasis on only one analyst’s opinion.
We will watch these Wall Street estimates very closely and would advise that you do as well. Before this company can capture Wall Street’s imagination it will have to gain much more analyst coverage.
52-Week High and Low Boundaries
Over the past year we have seen $ZLAB trade as low as $22.51 and as high as $176.17. This tells us that the annual trading range is $153.66.
Here is the annual 52-week chart of $ZLAB so that you can see the powerful price journey it has taken over the last year.

When you ZOOM out and look at the BIGGER picture the downtrend is even more obvious and devastating over a 10-year monthly chart.
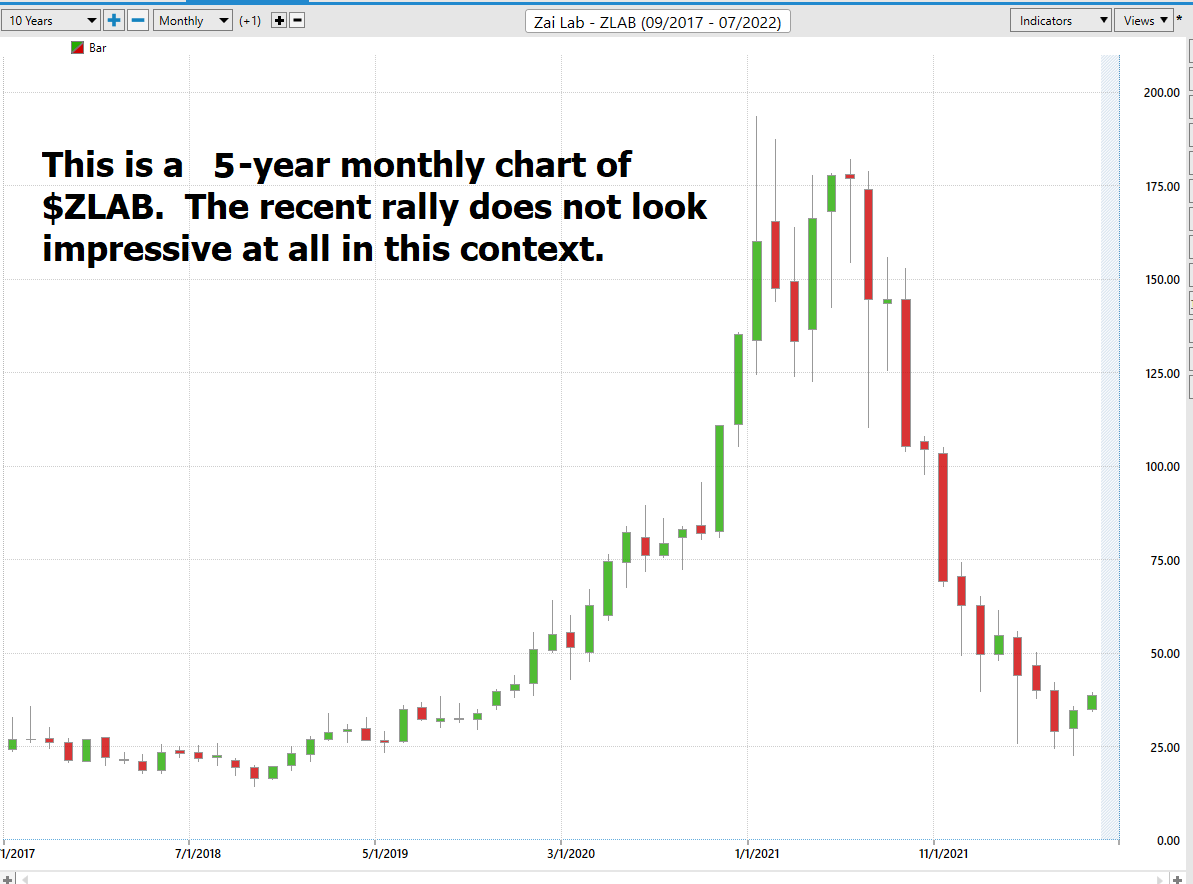
What we find incredibly useful and practical is to be very aware of the trading ranges for the weekly, monthly and quarterly time frames. The trading ranges for those time frames provide excellent volatility benchmarks that traders can use to know what the market has offered during that period.
Here are the average trading ranges for the daily, weekly and monthly time frames over the past year:
- Average daily trading range for $ZLAB over the past 52 weeks is 7% of the daily closing price.
- Average Weekly trading range for $ZLAB over the last 52 week is 18% of the weekly closing price.
- Average Monthly trading range for $ZLAB over the past 12 months is 207% of the monthly closing price.
A good rule of thumb is that if a stock is offering you X amount over a given time frame, a good trader should target 40% to 50% of that amount. A common mistake that many traders make is they target more than the market is offering and stay in a position far too long.
Next, we look at $ZLAB in the context of its performance relative to the broader stock market.

So, in $ZLAB we have an asset that has performed much worse than the broader stock market indexes. With significantly higher volatility.
Over the past month and week, it has done exceptionally well. But comparatively speaking this is an incredibly volatile stock that is high risk, very speculative and should you choose to trade it, the holding period should be very short as well.
Best Case – Worst Case Scenario
But we also want to get an idea of the best case and worst-case scenarios have been in the asset. We refer to this as the best case versus worst case analysis.
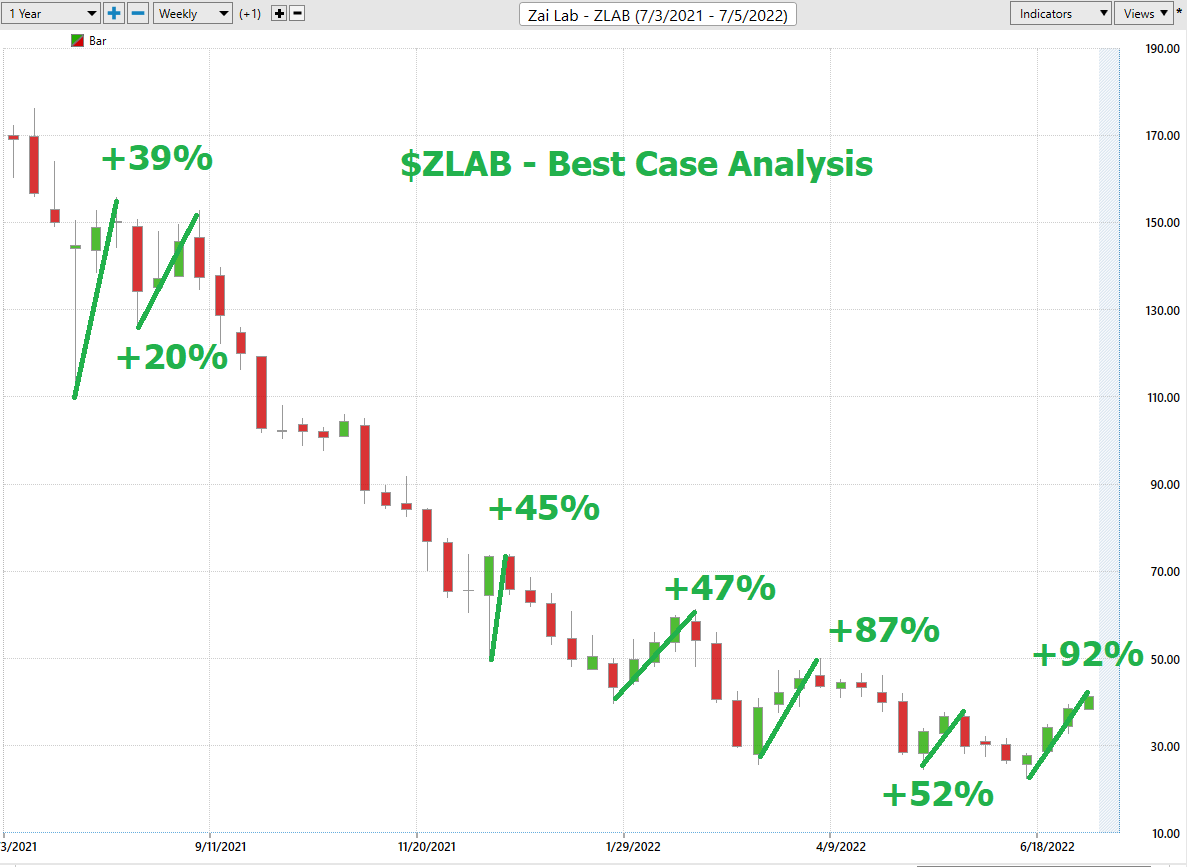
To get an idea of the risk and reward we simply mark on the chart any rally and decline of 10% or greater. These values are the ranges between the low and the high price.
The following charts are helpful in distilling and defining the volatility of this asset.
Here is the best-case analysis which clearly shows that as a trading vehicle, $ZLAB has had numerous rallies within its broader decline.
Next, we look at the declines in $ZLAB over the same period to form our worst-case analysis.
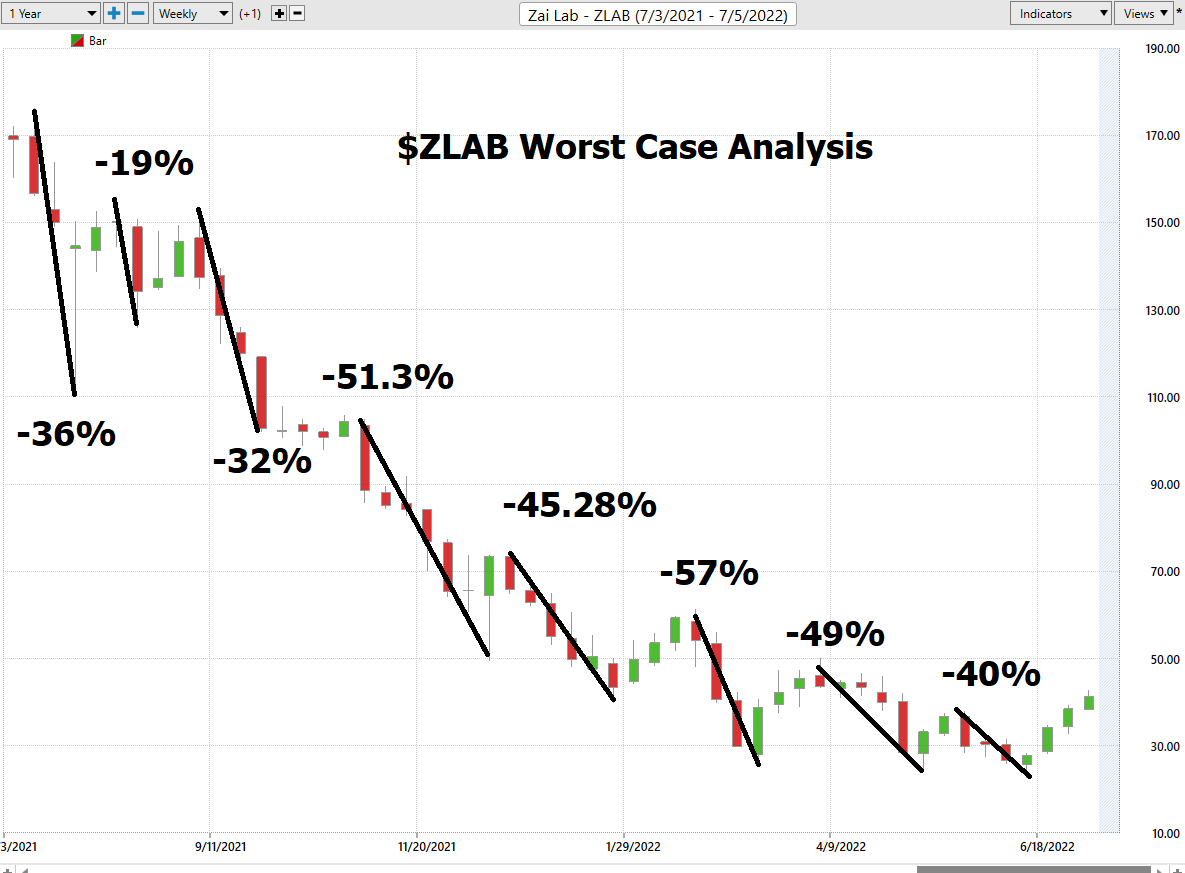
As a trading vehicle you must respect the volatility of this asset. You can quickly see that ALL these percentages were accomplished within a period of a few weeks. The value of this type of analysis is that it provides a very realistic expectation of what you can expect moving forward.
You need to comprehend that regardless of the amazing Wall Street Analyst’s estimate this is not a buy-and-hold vehicle.
The long and short of this analysis demonstrates that $ZLAB is a hit and run trading candidate. This is because of how quickly it alters its directional bias.
The Vantagepoint A.I. Analysis
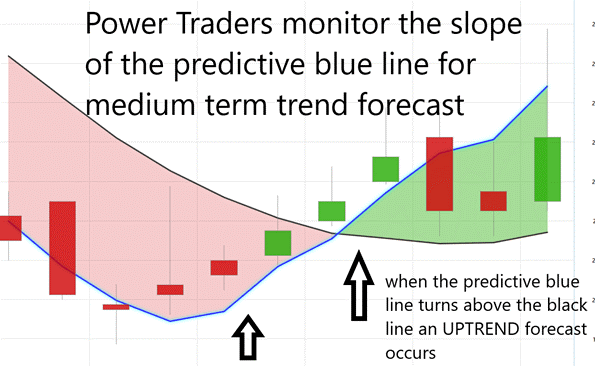
Let’s do some basic trend forecasting analysis based upon looking at the VantagePoint predictive blue line over the last year. On the following chart you will see the power of the VantagePoint Predictive blue line which determines the medium term trend price forecast.
The guidelines we abide by are as follows:
- The slope of the predictive blue line determines the trend and general direction of $ZLAB
- When the blue line turns above the black line an UP opportunity occurs
- When the blue line turns below the black line a DOWN opportunity occurs
- Ideally, the VALUE ZONE is determined to try and buy the asset at or below the predictive blue line in an UPTREND or Sell the market at or above the blue line in a downtrend.
This is the power and effectiveness of the Vantagepoint A.I. forecast in assisting traders to stay on the right side of the trend at the right time.
The predictive blue line is the initial indicator which Power Traders use to monitor and navigate the trend.
On the following chart you can see the maximum performance results in simply using the a.i. forecast to generate your trading opportunity.
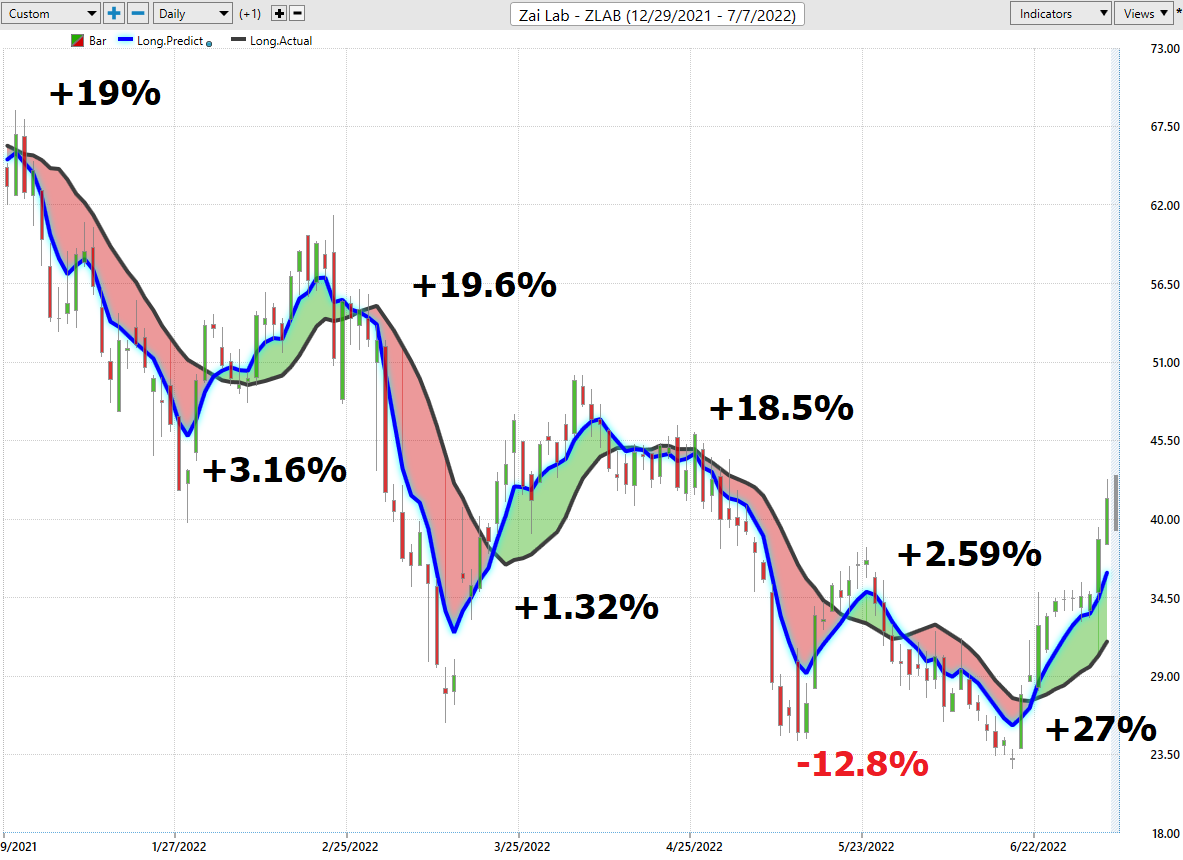
There are 8 trading opportunities:
#1 – short for +19%
#2 – long for +3.16%
#3 – short for +19.6%
#4 – long for +1.32%
#5 – short for +18.5%
#6 – long for -12.8% losing trade
#7 – short for 2.59%
#8 – long for 27%
The maximum available gains on these 8 trading opportunities amounted to 78%. The average was roughly 9.8%. The worst trade was -12.8%.
Next traders cross-reference this signal with the historical pattern recognition available with machine learning.
Neural Network Indicator (Machine Learning)
At the bottom of the chart is the Neural Network Indicator which predicts future short-term strength and/or weakness in the market. When the Neural Net Indicator is green it communicates strength. When the Neural Net is red it is forecasting short term weakness in the market. The Neural Index forecast is for the next 48 to 72 hours.
A neural network is a computing system that is modeled after the brain. neural networks are composed of input nodes, output nodes, and hidden nodes. Input nodes receive information from the outside world, while output nodes send information to the outside world. Hidden nodes are neither input nor output nodes; rather, they process information internally. neural networks learn by adjusting the weights of the connections between the nodes. The stronger the connection between two nodes, the more influential that connection is. neural networks can be used for a variety of tasks, including pattern recognition and data classification.
At its essence, a Neural Net is a computational learning system that uses a network of functions to understand and translate massive amounts of data into a desired output, consistently monitoring itself and improving its performance.
Whenever Power Traders are looking for statistically valid trading setups, they look for a DOUBLE confirmation signal. This signal occurs whenever the blue predictive line and the Neural Net at the bottom of the chart suggest the same future expected outcome.
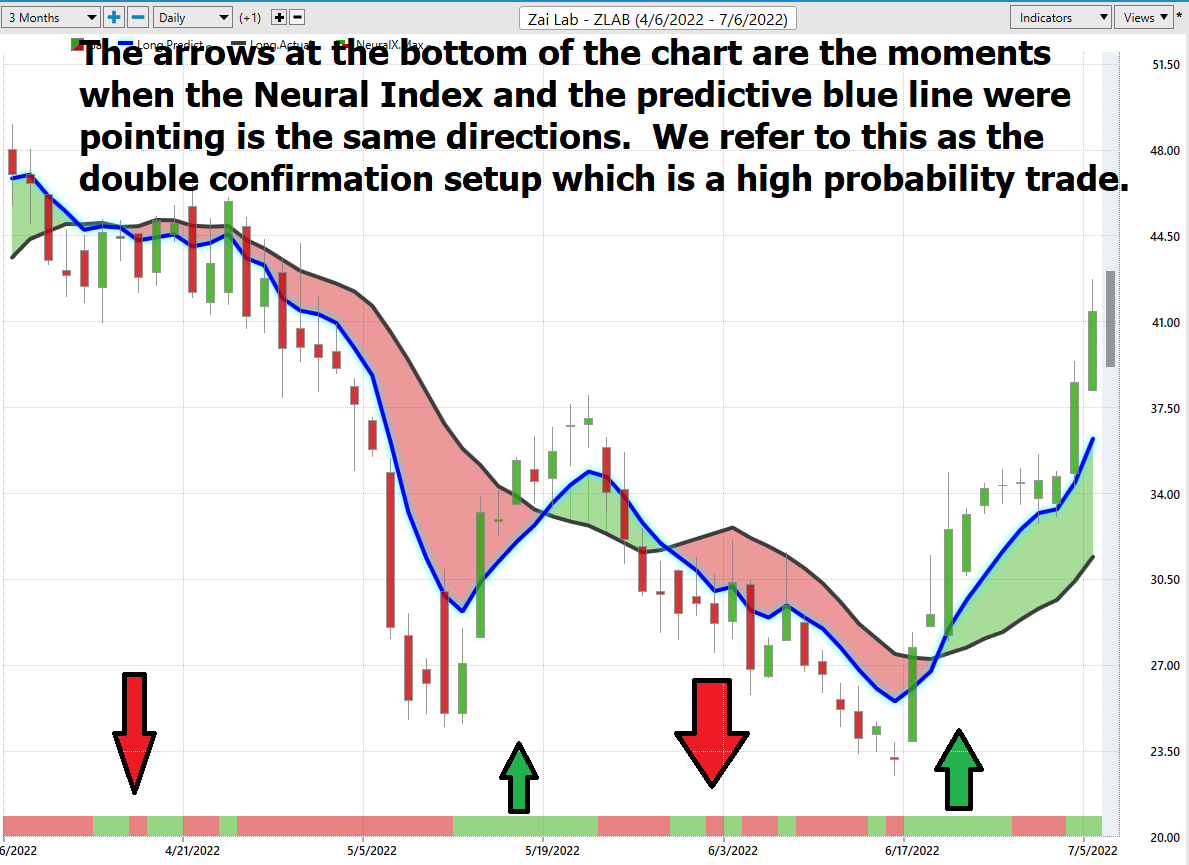
We advocate that Power Traders cross-reference the chart with the predictive blue line and neural network indicator to create optimal entry and exit points.
Traders look for confirmation on the Neural Net to position themselves for LONG or SHORT opportunities in the market. In other words, when the A.I. forecast is green, and The Neural Net is green, that presents a buying opportunity.
The inverse is also true, when the A.I. forecast is red and the Neural Net is red, that is a selling opportunity. The arrows on the chart below highlight the trading zones where Power Traders would’ve been using double confirmation to find a buying opportunity in cross-referencing the A.I. forecast with the Neural Net.
Power Traders are always looking to apply both the Neural Network and A.I. to the markets to find statistically sound trading opportunities.
VantagePoint Software Daily Price Range Prediction
One of the powerful features in the VantagePoint Software which Power Traders use daily is the Price Range prediction forecast.
This forecast is what permits Power Traders to truly fine tune their entries and exits into the market.
Every day traders are faced with the anxiety and frustration of wondering where they should be looking for opportunities to buy and sell the market. VantagePoint’s A.I. makes this decision super easy with the Daily Price Range Forecast. This is where the rubber meets the road.
This is some serious volatility. Here is the price chart of $ZLAB during the most recent uptrend. The software very clearly delineates the daily forecast by providing an exact lower and upper boundary and delineates the trend.
As we previously mentioned $ZLAB has some serious daily, weekly and monthly volatility.
- Average daily trading range for $ZLAB over the past 52 weeks is 7% of the daily closing price.
- Average Weekly trading range for $ZLAB over the last 52 week is 18% of the weekly closing price.
- Average Monthly trading range for $ZLAB over the past 12 months is 207% of the monthly closing price.
It is within this backdrop that the a.i., machine learning and neural networks operate to create a daily range forecast with exacting precision.
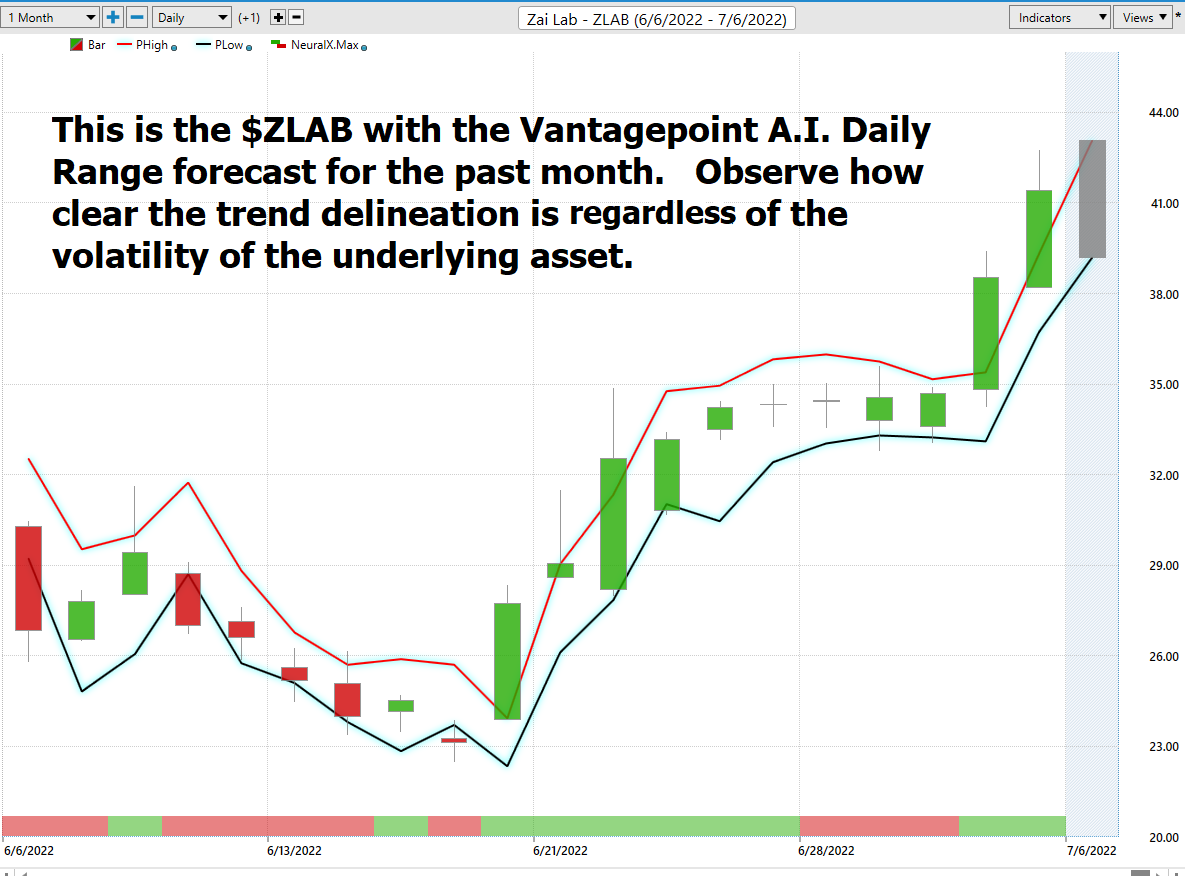
Many factors can affect the daily price range of stocks, from global political events to the weather. As a result, forecasting the daily price range is a complex task that requires careful analysis.
There are a number of methods that can be used to forecast daily price ranges, including technical analysis, fundamental analysis, and news-based analysis. Technical analysis involves studying past price movements to identify patterns that may provide clues about future price behavior. Fundamental analysis focuses on economic indicators such as company earnings and interest rates. News-based analysis involves tracking breaking news stories that could have an impact on the stock market. Vantagepoint A.I. uses a proprietary algorithm that combines the power of a.i., neural networks and machine learning to provide a daily price range forecast.
By using a combination of these methods, it is possible to develop a more accurate forecast of the daily stock market price range.
$ZLAB is a fasten your seatbelts type of trading opportunity. It is not for the faint of heart.
Intermarket Analysis
Power lies in the way we respond to the truth we understand.
One of the supremely important questions in trading is what is driving the price? Headlines often create interesting narratives. But these “stories” only capture the imagination. Traders want and need to understand the cause and effect of price movement.
The only way to get an answer to this important question is through Intermarket analysis which looks at statistical price correlations of assets.
Intermarket analysis is the study of relationships between different financial markets. It looks at how these markets affect each other, and how they can be used to predict future market movements.
By understanding these relationships, traders can make informed decisions about where to allocate their capital. Intermarket analysis can be used to trade a variety of asset classes, including stocks, bonds, commodities, and currencies.
There are a number of Intermarket indicators that can be used to identify opportunities, such as price correlations and momentum indicators. By taking the time to understand Intermarket dynamics, traders can give themselves a significant edge in the market.
So, a study of the relationship(s) will prove to be beneficial to a trader.
Interest rates, Crude Oil Prices, and the volatility of the Dollar amongst thousands of other variables affect the decisions companies must make to flourish and prosper in these challenging times. Trying to determine what these factors are is one of the huge problems facing investors and traders.
When I evaluate these relationships, I quickly can see that most of these stocks, ETF’s, currencies, and commodities have had a stressful 6-month horizon.
You always have a choice. You can tune in to the talking heads in the media who spin talking points which promote fear. Or you can rely on facts to base your decision making on.
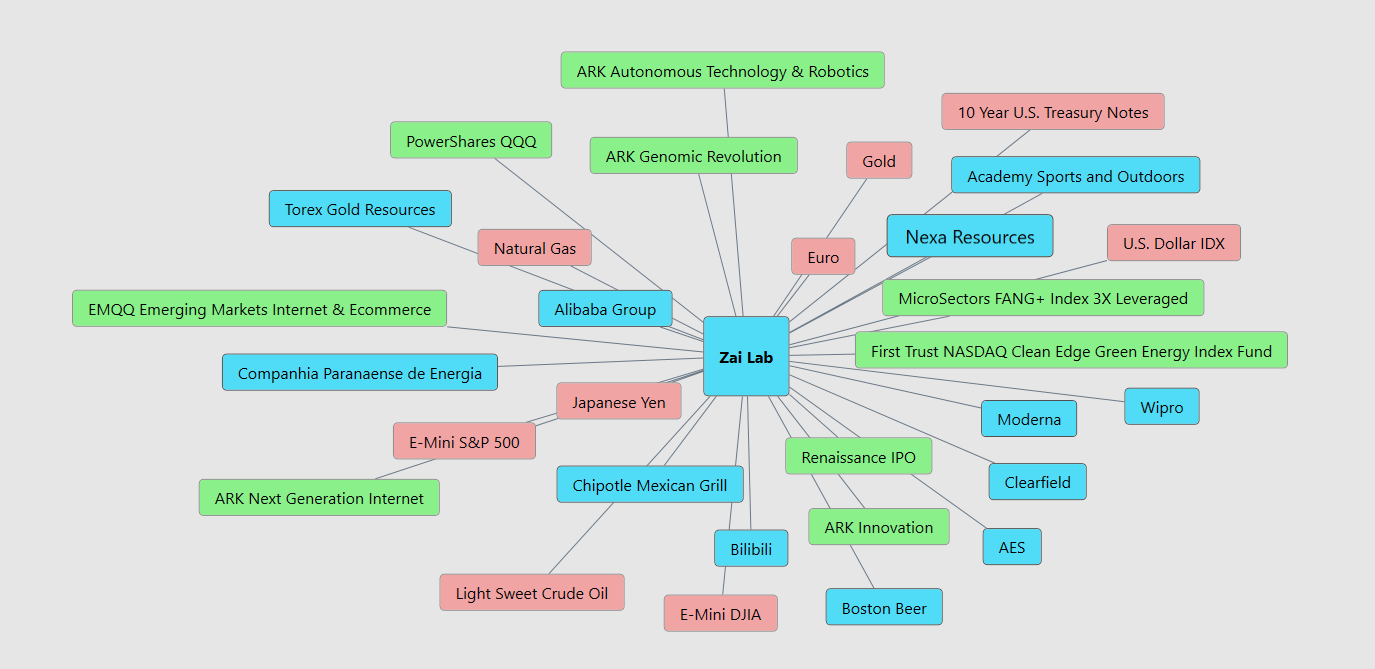
Within the following Intermarket Analysis graphic, you will see the 31 markets that are the key drivers to $ ZLAB’s price.
Our Suggestion
When you look at the last few weeks $ZLAB has moved $50%+ in a broader dismal market environment. Initially, that appears quite impressive on the surface.
However, when you zoom out and compare $ZLAB on longer term time basis this stock looks like what many traders refer to as a pump and dump rug pull.
The trend is clearly down.

Should you choose to approach $ZLAB you have to view it within this context. Money can be made trading stocks, but you should not get caught up in the hype and publicity of just one. After all there is only one analyst on Wall Street covering the stock.
We feel any trading opportunities you find in $ZLAB are short-term.
Any stock that has an average 7% daily trading range over the past year needs to be respected for its volatility. There are trading opportunities here, but primarily you must be cognizant of the risk.
We think that after the current rally subsides, we will see $ZLAB selloff and continue its downtrend. We will wait for guidance from the a.i. The backstory here in our estimation is that this is a very severe downtrend and has more room to go on the downside. The risk on this stock is massive. You should only put it on your radar if you are a seasoned trader and can move quickly.
Daily Range forecast and The Vantagepoint A.I. forecast will continue to be our guidance.
PUT $ZLAB on your radar and allow the a.i. to guide your trading decisions.
Practice solid money management on all your trades.
We will re-evaluate based upon:
- New Wall Street Analysts’ Estimates
- New 52-week high and low boundaries
- Vantagepoint A.I. Forecast (Predictive Blue Line)
- Neural Network Forecast
- Daily Range Forecast
Let’s Be Careful Out There!
Remember, It’s Not Magic.
It’s Machine Learning.
Disclaimer: THERE IS A HIGH DEGREE OF RISK INVOLVED IN TRADING. IT IS NOT PRUDENT OR ADVISABLE TO MAKE TRADING DECISIONS THAT ARE BEYOND YOUR FINANCIAL MEANS OR INVOLVE TRADING CAPITAL THAT YOU ARE NOT WILLING AND CAPABLE OF LOSING.
VANTAGEPOINT’S MARKETING CAMPAIGNS, OF ANY KIND, DO NOT CONSTITUTE TRADING ADVICE OR AN ENDORSEMENT OR RECOMMENDATION BY VANTAGEPOINT AI OR ANY ASSOCIATED AFFILIATES OF ANY TRADING METHODS, PROGRAMS, SYSTEMS OR ROUTINES. VANTAGEPOINT’S PERSONNEL ARE NOT LICENSED BROKERS OR ADVISORS AND DO NOT OFFER TRADING ADVICE.

