As the Bitcoin (BTC) halving event approaches, advise traders to adjust their strategies and expectations. The firm’s latest report emphasizes the importance of monitoring long-term holders’ behavior and the Long-Term Holder Market Inflation Rate to anticipate market changes.
This cycle differs from previous ones, with Bitcoin reaching an all-time high before the halving. The introduction of ETFs has brought stability to the market, but a decrease in ETF demand could amplify fluctuations.
Following the halving, the daily issuance of new BTC will drop from 900 to 450. While this reduction typically drives prices higher, the current market dynamics, particularly ETF acquisitions, are reshaping expectations. ETFs are removing more Bitcoin from circulation than miners, diminishing the halving’s impact on overall supply.
Glassnode suggests that the purchasing power of ETFs may overshadow the traditional “halving effect” on price and future market movements. As the halving draws near, traders are encouraged to consider new questions and adapt their strategies accordingly.
What Sets This Cycle Apart
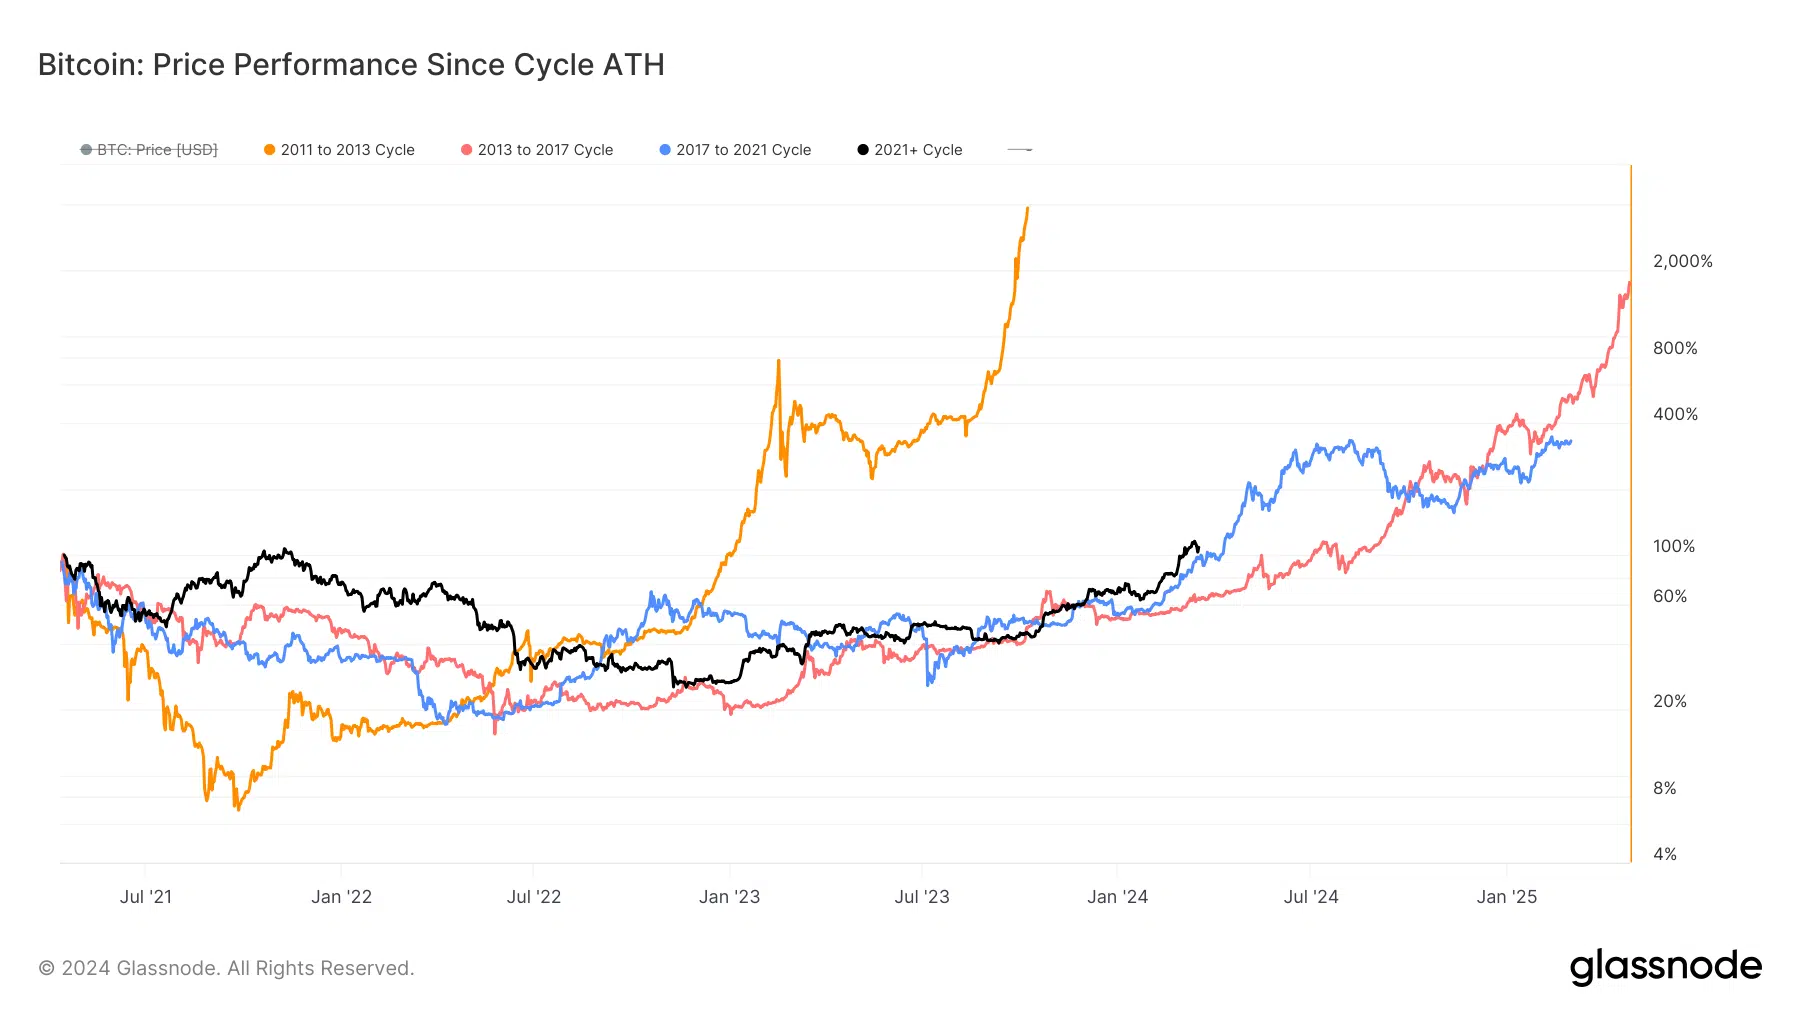
The current Bitcoin cycle has deviated from historical patterns, with BTC surpassing its previous all-time high (ATH) well before the upcoming halving event. Traditionally, new market cycles began 12 to 18 months after the previous bull market peak, and new ATHs were achieved several months post-halving. This has led to the belief that halving events catalyze bull runs due to supply constrictions.
However, the introduction of institutional demand from Bitcoin ETFs is likely to diminish the halving’s impact during this cycle. The influx of capital from these ETFs has likely contributed to BTC breaking its previous ATH prior to the halving.
Some speculate that the current cycle may be shorter than previous ones, but determining this with certainty is challenging. Analyzing data can help assess the current stage of the market cycle and the likelihood of a continued bull run.
Breaking the ATH before the halving doesn’t necessarily indicate a deviation from historical norms for Bitcoin. The key is to identify the true peak of the previous bull market. Glassnode maintains that this occurred in April 2021, despite Bitcoin reaching a higher price in November 2021. This assumption is based on the fact that after the April high, most technical and on-chain indicators related to market sentiment and investor behavior displayed typical bear market values and never fully recovered.
Considering April 2021 as the previous bull market high, the current cycle aligns well with historical norms. This suggests that the bull market may continue for an extended period, despite breaching the previous ATH before the halving.

When evaluating the differences between the current cycle and historical trends to optimize trading strategies, monitoring the Bull Market Correction Drawdowns metric can be beneficial. This indicator reflects the depth and frequency of price retracements during the ongoing bull market.
Interestingly, this cycle has experienced less severe corrections compared to the significant drawdowns of 30-40% observed in past bull markets. Tracking these drawdowns provides traders with insights into market sentiment, risk appetite, and potential turning points. As ETF inflows continue to shape the market, a notable shift in the trend of milder corrections could indicate changes in investor behavior and serve as a timely signal for adjusting strategies.
The influence of newly mined bitcoins is becoming less significant compared to the growing demand from ETFs. Recent market corrections have been largely influenced by negative capital flows in spot bitcoin funds.
As Bitcoin trades sideways between $63,000 and $65,000, traders are urged to closely monitor market dynamics and adjust their strategies to navigate the evolving landscape surrounding the upcoming halving event.

