What is currency correlation?
Currency correlation, or forex correlation, denotes the extent to which a given currency is interrelated with another, helping traders understand the price movements of currencies over time and influencing their forex decisions.
Currencies are traded in pairs, meaning no single currency pair is ever isolated. This means traders need to understand how currency pairs move in relation to others, particularly if they are trading multiple pairs at the same time.
Using currency correlation in forex trading
When using currency correlation in forex trading, traders can gain knowledge of the positions that cancel each other out, so they know to avoid those positions. Traders can also use currency pair correlation for diversifying a portfolio. More on these strategies will be discussed below.
Fx correlation is represented on a numerical scale. This ‘correlation coefficient’ ranges between -1 and +1 and shows the degree of correlation. For example, +1 would be a positive linear correlation, and implies that the two currencies will always move in the same direction. A correlation coefficient of -1 implies the currency pair will always move in the opposite direction, while if the correlation is 0, the relationship between the currencies in the pair will be random, with no correlation.
As an example, a positive correlation of, say, 0.50 between AUD/USD and EUR/USD would mean that when AUD/USD rallies, EUR/USD has also rallied 50% of the time, according to previous data. This can be observed in the charts below.
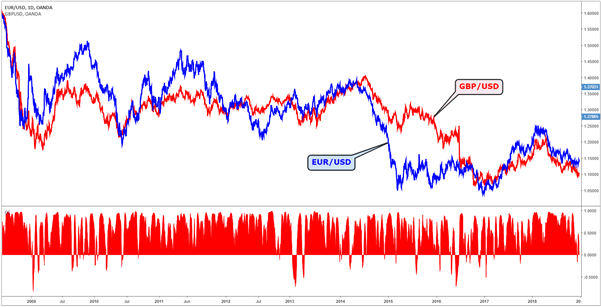
The below chart shows the currency correlation between EUR / USD (blue) and GBP/USD (red). The currency coefficient measure can be seen in the red secondary chart, revealing that while the currency pair moves in a similar direction most of the time, it is sometimes negatively correlated. The peaks represent the points in the chart showing positive correlation, with the troughs showing negative correlation.

EUR/USD- GBP/USD chart showing currency coefficient
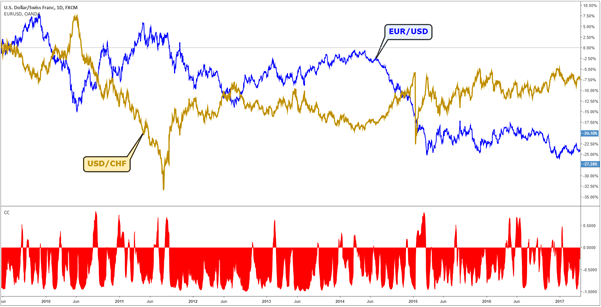
Meanwhile, this second chart shows the currency correlation between USD/CHF ( gold ) and EUR/USD (blue). The currency coefficient shows that while this correlation is mainly negative, it is occasionally positively correlated.

SD/ CHF -EUR/USD chart showing currency coefficient
Reading a currency correlation table
Currency correlation tables show the relationship between main forex pairs and other pairs over different time periods but, as seen in the charts above, currency correlations can and do change over time.
For example, the following table shows GBP /USD against five prominent currency pairs over a sample of 20 days, 60 days and 90 days:
| GBP/USD | EUR/USD | USD/JPY | USD/CHF | USD/CAD | AUD/USD | NZD/USD |
|---|---|---|---|---|---|---|
| 20 days | -0.16 | 0.25 | 0.50 | -0.35 | -0.33 | -0.57 |
| 60 days | 0.77 | -0.29 | -0.58 | -0.67 | -0.12 | -0.46 |
| 90 days | 0.61 | 0.20 | -0.36 | -0.45 | -0.01 | -0.03 |
Source: https://tradecaptain.com/correlation-studies
GBP/USD and USD/CHF , as an example, shows a positive correlation over the shorter timeframe of 20 days. However, the pairing is overall regarded as a negative correlation for similar reasons to USD/CHF and EUR/USD. CHF is a safe haven currency and can appreciate dramatically when economic turmoil hits and equities fall, which is one reason that might explain the negative figures.
Why traders use currency correlation
Traders typically use currency correlation for inter-market trading, hedging a position, and diversifying risk.
Inter-market trading
Identifying markets that are closely correlated with each other can be useful because, if patterns are not clear in one market, clearer patterns can be used in the second market to help traders place trades in the first.
The commodities market can be particularly useful for correlation and an example of inter-market trading is the pair of USD/CAD and oil . Since Canada is the largest exporter of oil to the US, the currency pair is sensitive to the commodity price, and when the oil price rises CAD will tend to strengthen against USD. Another example is the correlation of the Australian Dollar (AUD) with gold, with price rises in the precious metal equating to rises in AUD due to the country being one of the leading gold producers in the world.

Hedging a position
Hedging a position is also a reason to trade forex correlations. If you are bullish about AUD and want to buy AUD/USD, then buying USD/CHF to hedge off some of the USD exposure may be a wise move.
Different pip or point values can be used to a trader’s advantage when hedging exposure. Where the value of a pip move for a given pair may be $10 for a lot of 100,000 units, a negatively correlated pair with the value of a pip move at $9.20 for the same number of units can represent a useful hedge.
Diversifying risk
Traders can also use currency correlation for diversifying risk. For example, having three trades on ( GBP/NZD , USD/JPY , and EUR/JPY ) means you can run an analysis between the three markets to make sure they are not correlated, effectively diversifying your trades.
Summary: Forex correlation trading tips
In summary, when creating a forex correlation trading strategy, some factors to consider when trading are:
- Use Intermarket correlations to your advantage: Find markets that have strong positive or negative correlations with the exposure you are seeking, such as major stock indices . Forex trading, in many cases, may provide more liquidity and 24-hour access to the market.
- Find currency markets with strong positive or inverse correlations: Correlations above +0.5 and below -0.5 suggest a strong correlation exists. Use those strong correlations for hedging exposures.
- Diversify risk: If you want to diversify risk, look for markets with correlation figures between -0.3 and +0.3 as that suggested they are not correlated

