
Knowing how to accurately value a stock enables traders to identify and take advantage of opportunities in the stock market. Stock valuation, also referred to as ‘equity valuation’, provides the framework for traders to identify when a stock is relatively cheap or expensive. The difference between a stock’s market value and its intrinsic value presents traders with an opportunity to benefit from this disparity.
Why value a stock?
Valuing a stock allows traders to acquire a solid understanding of the value of a share and whether it is appropriately priced. Once the value of the share is known, it can then be compared to the quoted price of the share in the stock market.
If the quoted share price is higher than the calculated value, it is seen as expensive and traders will look to short/sell the stock in anticipation of price reverting to its intrinsic value.
If the quoted price is lower than the calculated price, it is seen as cheap and traders will look to buy/long the stock in anticipation of the price reverting to its intrinsic value.
The information below summarizes this relationship:
Market value > intrinsic value = Overvalued (short signal)
Market value < intrinsic value = Undervalued (long signal)
It is worth mentioning that while a stock may be overvalued or undervalued, it is possible for it to remain that way for a prolonged period of time if the underlying cause of the imbalance persists.
The different types of stock value
What determines the value of a stock? The best way to answer this is to deal with the concept of value. What is value? Is it the going price that one person is prepared to pay to another ( market value ), or is it an underlying value that can be calculated objectively, based on a set of publicly available data ( intrinsic value )?
These two concepts are defined below:
1) Market value : The quoted share price in the stock market. Essentially it is the last traded price. Market value is the price where a willing buyer and a willing seller agree to exchange.
2) Intrinsic value : A more calculated measure of value, based on publicly available information. Since there is no definitive model on stock valuation, analysts tend to arrive at different intrinsic values however, these values tend not to differ greatly.
In reality, share prices often differ from their intrinsic value. An example of this would be a case where there is major hype around a new share, or a rapidly growing share that investors look to snatch up quickly. Increasing FOMO would naturally prolong this imbalance until the share price undergoes a major correction.
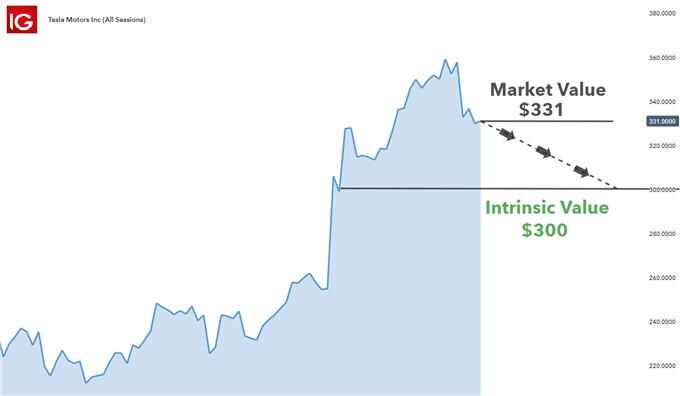
For example, if Tesla Inc is currently trading at $331 and the intrinsic value is $300, traders may anticipate a move lower towards $300.
Example of share trading above intrinsic value (Tesla Inc):
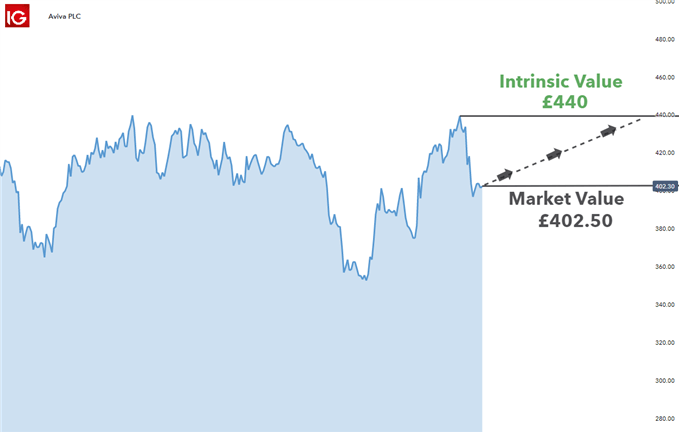
The reverse of this is where a share trades below its intrinsic value and traders purchase the share in anticipation of the share price rising to match the intrinsic value. This is often the case for value stocks. An example of this is shown below where Aviva PLC is trading below intrinsic value.
Example of stock trading below intrinsic value (Aviva PLC):
Top 3 ways to find the value of a stock
Stock valuation performed by leading financial institutions and hedge fund managers make use of highly sophisticated variations of the below valuation methods. This article seeks to provide traders with a comprehensive starting point to stock valuation for the following stock valuation methods:
- P/E Ratio
- PEG Ratio
- Dividend Discount Model (DDM)
1. P/E Ratio
A company’s price earnings ratio, or P/E ratio, is one of the most popular ways to value a share due to its ease of use and mass adoption by investment professionals.
The ratio does not provide an intrinsic value but instead compares the stock’s P/E ratio to a benchmark - or other companies in the same sector - to determine if the stock is relatively overvalued or undervalued.
The P/E ratio is calculated by dividing the stock’s price per share by its earnings per share.

For example, consider the following three companies and their respective P/E ratios:
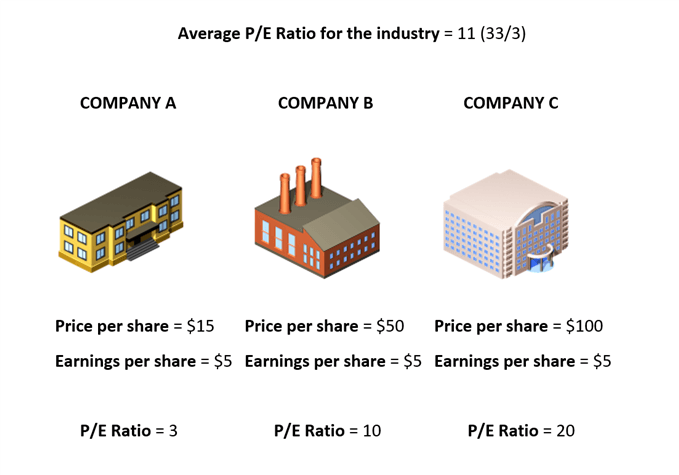
Company A and B look attractive as they are both below the industry average of 11. This is the starting point for stock valuation as there may be a very good reason why these companies look relatively cheap. It is possible that the company has taken on too much debt and the share price accurately reflects the market value of the debt ridden entity.
The same level of analysis needs to be conducted for Company C, which has a P/E ratio well above average. While it looks expensive, it is possible that the market has factored in an increase in future growth in earnings and therefore, investors are willing to pay more for these increased earnings.
2. PEG Ratio
When taking the P/E ratio a step further, traders are able to get a good idea of the value of a stock when incorporating the growth rate of Earnings Per Share (EPS). This is more realistic as earnings are seldomly static and therefore, adding EPS growth to the mix creates a more dynamic stock valuation formula.
The earnings figure used can either be historic to provide a ‘Trailing PEG’ or a forecasted figure providing a ‘Forward PEG’.
The PEG ratio is calculated as follows:
Stock valuation formula :

Consider the same example but with added information on earnings growth:
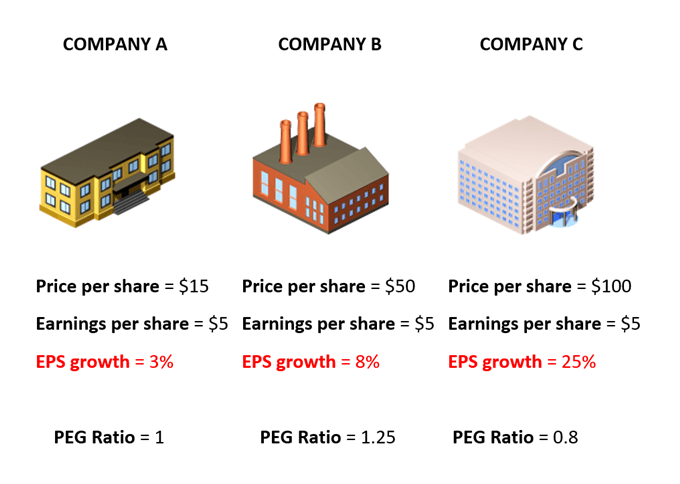
Generally speaking, a PEG ratio of less than one suggests a good investment, while ratios more than one suggest that the current price of the stock is too high in relation to the projected earnings growth and therefore, less of a good deal.
According to the PEG ratios, Company A is alright, company C looks very attractive even at its high price and Company B does not look flattering at all.
Once more its crucial to note that investment decisions should not be made entirely on the PEG ratios and that further analysis into the company's financial statement should be conducted.
3. Dividend Discount Model (DDM)
The dividend discount model is similar to the previous stock valuation methods as it considers future dividends (earnings) to shareholders. However, the DDM model looks at future dividends and discounts them to establish what those dividends would be worth in today’s value otherwise referred to as the present value (PV).
The reasoning behind this is that the share today should be worth whatever the shareholder receives in the form of dividends, discounted back to today.
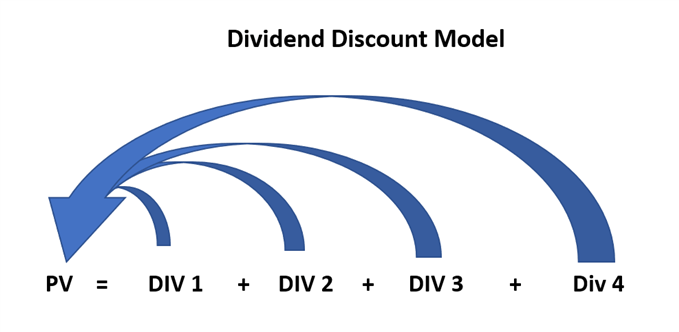
To make the calculation simpler, assume a dividend payment is made once a year. Secondly, it is normal to assume that dividends increase over the years as the business grows and as a result of the effects of inflation. Higher input costs get handed down to consumers are reflect in increased earnings and, by extension, increased dividend payments.
The growth in dividends is assumed to be constant and is denoted as ‘g’ below. The required rate of return is denoted ‘r’ and is used to discount future cash flows to today’s value.
Stock valuation formula :

- PV = Present value of the stock
- DIV1 = Expected dividend 1 year from now
- r = Discount rate
- g = Constant growth of dividends
Dividends received farther into the future are less valuable in today’s terms and therefore contribute less to the determination of the stock’s value today. After discounting future dividends, the answer at PV is the value of the stock according to the dividend discount model.
Determining the value of a stock: Key takeaways
It is clear that stock valuation can be quite straight forward when using the P/E ratio and PEG ratio, or more complex when using the DDM method. After finding a suitable method, traders can compare the market price of a particular share with the calculated intrinsic/relative value to establish if there is any meaningful difference.
If there is disparity between the two figures, traders can look to short overvalued stocks or long oversold stocks while always remembering to apply sound risk management .
Stock valuation FAQs
What is the best method for valuing stocks?
As explored above, there are various ways to value a stock and no method is more superior to the rest. Methods of valuing stocks become very specialized and complex however, traders that understand the basics are able to uncover mispriced stocks and set up trades to capitalize this.
How can I tell when a stock is going to go up in value?
The short answer is there is no way to know for sure if a stock is going to go up or even down in value. However traders can make use of fundamental and technical analysis in an attempt to increase the probability of winning trades, while adhering to sound risk management to mitigate moves in the opposite direction.
Download our free equities forecast to get the latest updates on the stock market, and the technical and fundamental factors affecting major stock indices . Brought to you by our expert analysts every quarter.

